Configure Service Paging Webhooks
Service paging webhooks enable external monitoring tools, legacy systems, and custom applications to trigger on-call notifications by sending alerts directly to a service. Each service can have a dedicated paging webhook that automatically creates alerts and pages the on-call User Group.
Overview
The service paging webhook provides two integration methods:
- HTTP POST: Send JSON payloads over HTTP to a unique webhook URL.
- Email: Send alerts by email to a unique service email address.
When an alert is received through either method, the system automatically:
- Creates an alert with the provided title and description.
- Routes the alert to the service's assigned User Group.
- Pages responders according to the service's escalation policy.
How it works
When you enable a paging webhook on a service, the system atomically creates three components:
- Webhook: A unique URL and authentication key for receiving alerts.
- Alert template: A system-controlled template that defines how incoming data maps to alert fields.
- Alert rule: An always-true condition that automatically pages the service when any alert arrives.
This setup ensures that every alert sent to the webhook immediately triggers the configured escalation policy.
Alert fields
The paging webhook accepts these fields:
| Field | Description | Default Value |
|---|---|---|
message | Alert title (required) | None |
email_text | Alert description (optional) | Empty string |
priority | Alert priority | p1_critical |
status | Alert status | triggered |
created_at | Alert creation timestamp | Current time |
started_at | Alert start timestamp | Current time |
Enable a service paging webhook
Before you begin
- Service configured: The service must exist in the Service Directory.
- User Group assigned: The service must have an owning User Group and escalation policy configured.
- On-call schedule: The User Group must have an active on-call schedule.
Enable the webhook
Enable paging on a service to generate its webhook and email endpoint:
- Navigate to Project Settings → Service Directory (AI SRE).
- Select the service you want to configure.
- In the Paging tab, enable the webhook.
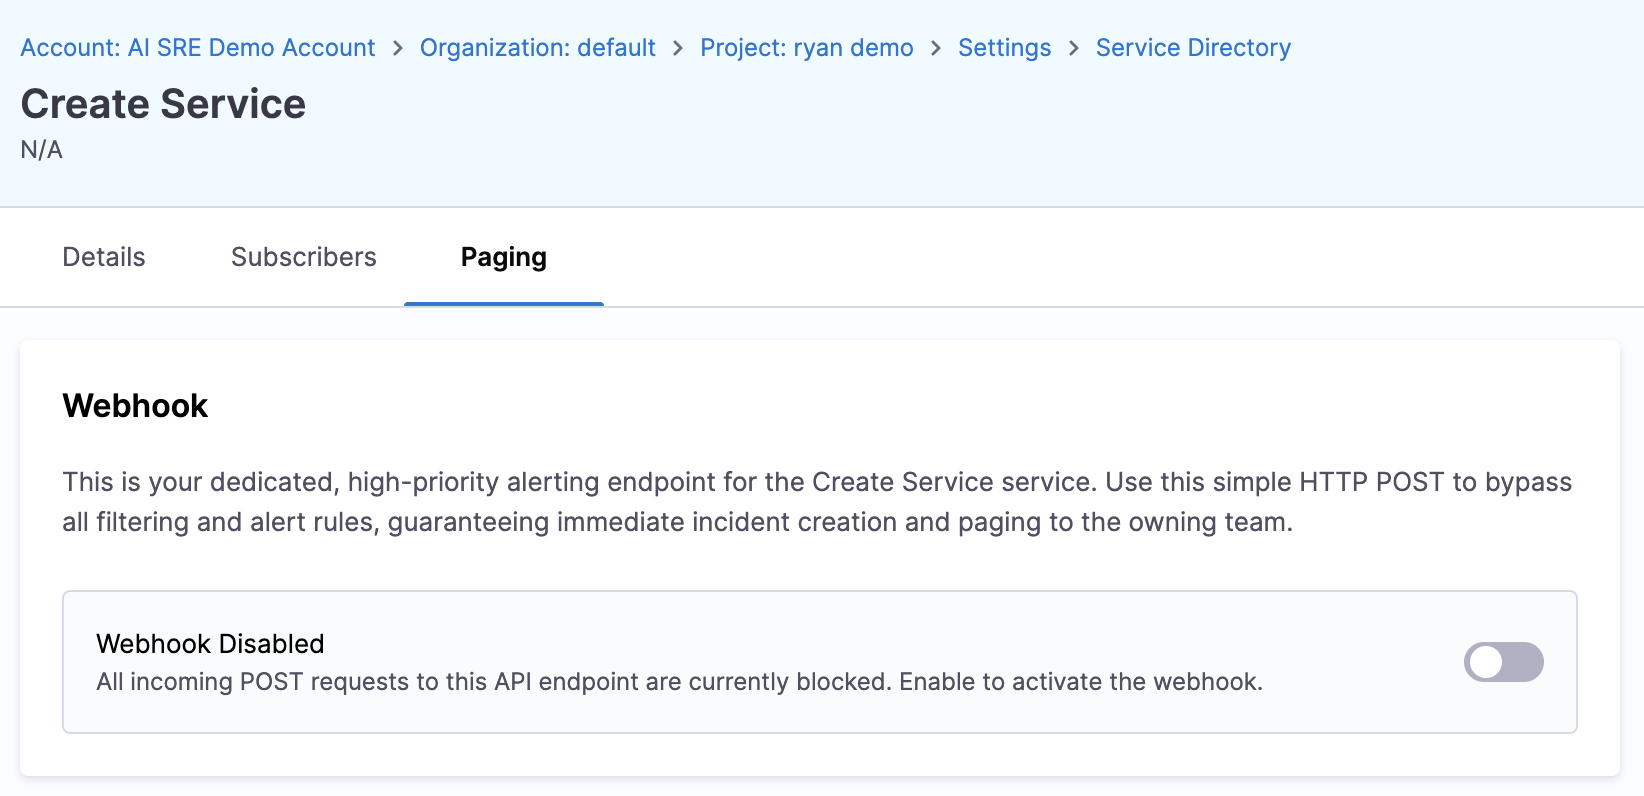
- The system creates the webhook, alert template, and alert rule automatically.
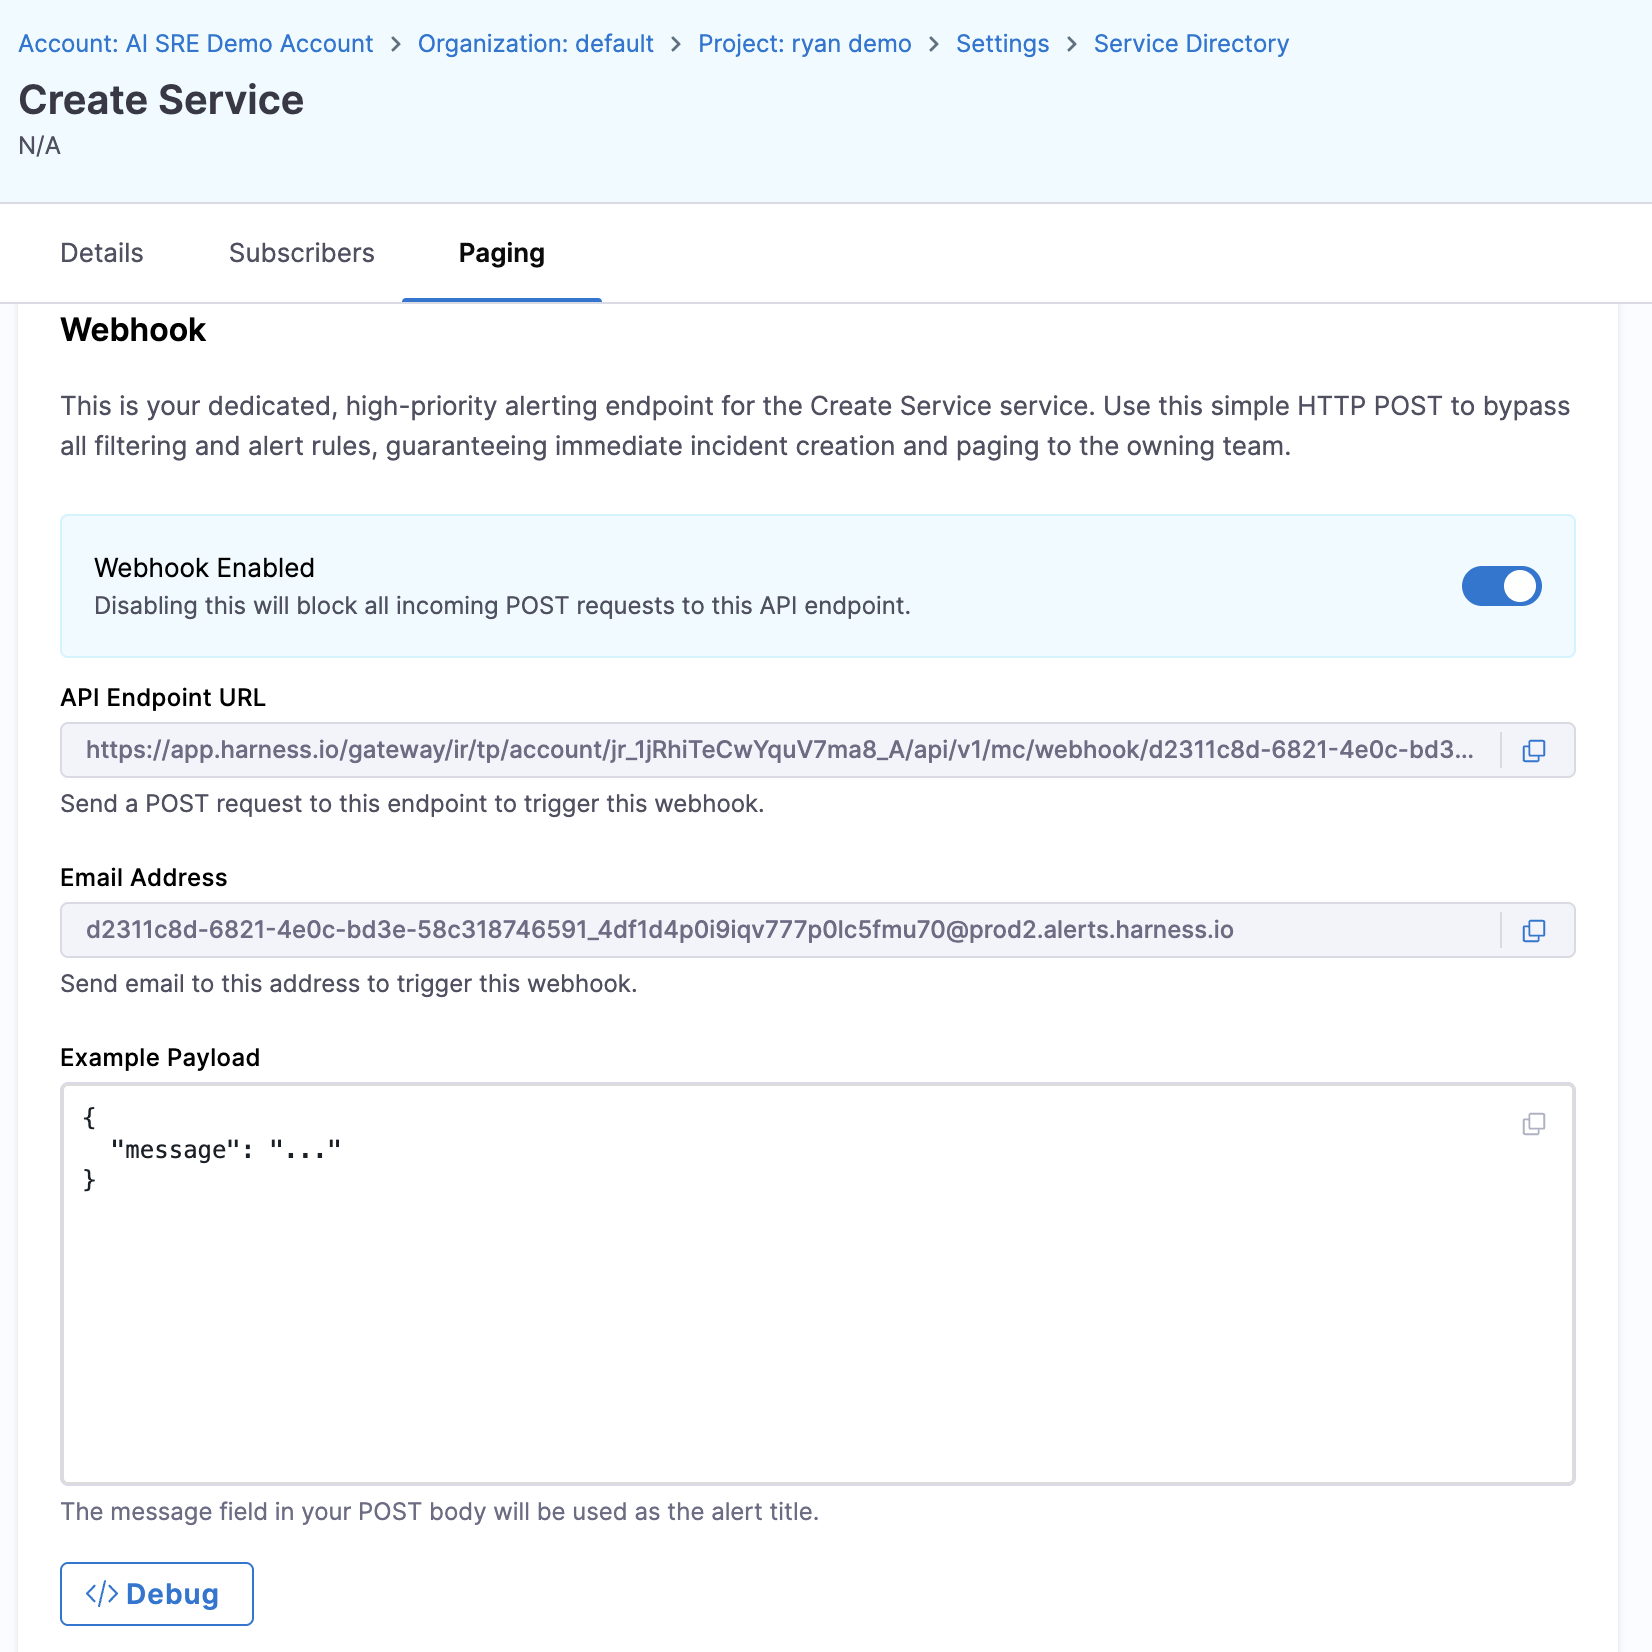
- Copy the Webhook URL and Email Address displayed in the UI.
The webhook is now active and ready to receive alerts.
Each service supports one paging webhook. Attempting to enable a second webhook on the same service refreshes the existing webhook configuration rather than creating a new one.
Use the HTTP webhook
Webhook URL format
The webhook URL follows this format:
https://app.harness.io/api/v1/webhook/{webhookId}?key={key}
- webhookId: Unique identifier for the webhook.
- key: Authentication key (acts as a bearer token).
HTTP request format
Send a POST request with a JSON body:
Endpoint:
POST https://app.harness.io/api/v1/webhook/{webhookId}?key={key}
Headers:
Content-Type: application/json
Body:
{
  "message": "High CPU usage on production-api",
  "email_text": "CPU usage has exceeded 90% for the past 5 minutes.
Service: production-api, Host: api-server-01, Current value: 95.2%"
}
Example: cURL
curl -X POST 'https://app.harness.io/api/v1/webhook/abc123?key=xyz789' \
  -H 'Content-Type: application/json' \
  -d '{
    "message": "Database connection pool exhausted",
    "email_text": "Service: payment-service, Environment: production,
Connection pool: 100/100 connections in use,
Timeout errors detected"
  }'
Example: Python
import requests

webhook_url = "https://app.harness.io/api/v1/webhook/abc123?key=xyz789"
payload = {
    "message": "API latency spike detected",
    "email_text": "Service: user-api,
P99 latency: 2500ms (threshold: 500ms), Region: us-east-1"
}

response = requests.post(webhook_url, json=payload)
print(f"Status: {response.status_code}")
Example: shell script
#!/bin/bash

WEBHOOK_URL="https://app.harness.io/api/v1/webhook/abc123?key=xyz789"
MESSAGE="Service health check failed"
DETAILS="Service: auth-service, Health endpoint returned 503,
Last successful check: 2 minutes ago"

curl -X POST "$WEBHOOK_URL" \
  -H "Content-Type: application/json" \
  -d "{\"message\":\"$MESSAGE\",\"email_text\":\"$DETAILS\"}"
Use the email integration
Each service paging webhook includes a unique email address. Sending an email to this address triggers the same paging flow as the HTTP webhook.
Email address format
The email address follows this format:
{webhookId}_{key}@{domain}
Example: abc123_xyz789@alerts.harness.io
Email fields
Email components map to alert fields as follows:
- Email subject: Maps to the alert
message(title). - Email body: Maps to the alert
email_text(description).
Example: send an alert by email
To: abc123_xyz789@alerts.harness.io
Subject: High memory usage on staging-db
Body:
Memory usage on staging-db has exceeded 85% for the past 10 minutes.

Host: db-staging-01
Current memory usage: 7.2 GB / 8 GB
Swap usage: 1.5 GB
Database: PostgreSQL 14.5

Action required: Investigate query performance and consider scaling.
This email creates an alert with:
- Title: "High memory usage on staging-db"
- Description: (email body text)
- Priority:
p1_critical(default) - Status:
triggered(default)
Email size limits
The email integration enforces the following size limits:
- Maximum email size: 10 MB (raw email)
- Passthrough without truncation: 96 KB
- Text body truncation: 32,000 characters
- Maximum after processing: 2 MB
Emails exceeding these limits are rejected or truncated.
How replies are handled
Emails containing an In-Reply-To header are ignored. Only new emails (not replies) create alerts. This prevents duplicate alerts when someone replies to an alert notification.
Use cases
External monitoring tools
Scenario: Datadog monitors detect an issue but you want alerts routed through Harness AI SRE for unified on-call management.
Solution: Configure Datadog webhook notifications to send alerts to the service paging webhook URL.
Legacy systems
Scenario: An older monitoring system only supports email-based alerting.
Solution: Configure the system to send alert emails to the service's unique email address.
Custom monitoring scripts
Scenario: Internal health checks run as cron jobs and need to page on-call when failures are detected.
Solution: Use cURL or a scripting language to POST to the webhook URL when checks fail.
Third-party tools without native integration
Scenario: A SaaS tool lacks a direct Harness integration but supports webhooks or email notifications.
Solution: Configure the tool to send webhooks or emails to the service paging endpoint.
Disable or refresh a paging webhook
Disable the webhook
Disable paging to place the webhook in quiet mode without deleting it:
- Navigate to Project Settings → Service Directory (AI SRE).
- Select the service.
- Click Disable Paging Webhook.
What happens:
- The webhook is set to quiet mode (does not create alerts).
- The webhook URL and email address remain valid but inactive.
- The webhook is not deleted from the system.
You can re-enable the webhook later to restore paging.
Refresh the webhook
Re-enabling a webhook refreshes its configuration and removes quiet mode. This is useful if you need to update the webhook manifest or restore paging after disabling it.
- Navigate to Project Settings → Service Directory (AI SRE).
- Select the service.
- Click Enable Paging Webhook (if currently disabled).
What happens:
- The webhook manifest is regenerated.
- Quiet mode is removed.
- The webhook resumes creating alerts and paging responders.
Debug and monitor webhooks
Service paging webhook debug drawer
The Service Directory UI includes a Debug Drawer that shows:
- Webhook status: Enabled, disabled, or quiet mode.
- Recent activity: List of recent alerts received through the webhook.
- Webhook URL and email address: Copy for external systems.
- Test webhook: Send a test alert to verify configuration.
View webhook activity
Open the debug drawer to review recent alerts received through the webhook:
- Navigate to Project Settings → Service Directory (AI SRE).
- Select the service.
- Click Debug in the lower left corner of the dialog.
- Review recent alerts and their status.
Best practices
For administrators
Follow these practices when you enable and manage paging webhooks:
- Test before production: Send test alerts to verify the webhook works before configuring external systems.
- Document webhook URLs: Store webhook URLs and email addresses in a secure location (password manager, secrets vault).
- Monitor webhook health: Use the debug drawer to check for recent activity and ensure alerts are flowing correctly.
- Align with escalation policies: Ensure the service has a valid User Group and escalation policy before enabling the webhook.
- Use quiet mode for maintenance: Disable webhooks temporarily during maintenance windows to prevent unnecessary pages.
For external system integrations
Follow these practices when you connect external tools to a webhook:
- Include context: Provide detailed alert descriptions with service name, environment, and affected resources.
- Use consistent formatting: Structure email subjects and webhook payloads consistently for easier troubleshooting.
- Avoid reply emails: Configure external systems to send new emails only (not replies) to prevent ignored alerts.
- Apply rate limiting: Avoid sending excessive alerts to the same webhook (group similar alerts when possible).
- Monitor delivery: Log webhook POST requests in external systems to track delivery success.
Security considerations
Follow these practices to keep webhook credentials secure:
- Keep keys confidential: The webhook key acts as an authentication token. Do not commit keys to version control.
- Use HTTPS only: Webhook URLs use HTTPS. Do not downgrade to HTTP.
- Rotate keys periodically: Disable and re-enable webhooks to refresh keys if they are compromised.
- Restrict email senders: Configure external systems to send emails from trusted addresses only.
Troubleshooting
Service paging webhook returns 401 Unauthorized
Verify the webhook URL and key match what is displayed in the Service Directory, confirm the webhook is enabled and not in quiet mode, and disable then re-enable the webhook to refresh the key if it is incorrect.
Emails sent to the service paging address are not creating alerts
Verify the email address matches the format shown in the Service Directory, confirm the email is a new message and not a reply, check the email is under the size limits, and ensure the webhook is enabled.
Service paging webhook creates alerts but no one gets paged
Confirm the service has an owning User Group with an escalation policy, verify the escalation policy has an active on-call schedule, and confirm someone is on-call during the current time period.
Cannot enable a service paging webhook (error or no button visible)
Check whether the webhook is already enabled, verify you have admin permissions for the organization, and ensure the service has an owning User Group and escalation policy configured.
Next steps
- Go to Integrate with the Service Directory to configure service-to-team mappings.
- Go to Configure Escalation Policies to set up on-call routing.
- Go to Route Alerts to create advanced alert routing logic.
- Go to Configure Webhooks to configure general webhooks beyond service paging.