Configure the Verify Step
Continuous Verification integrates with various health sources to:
- Verify that the deployed service is running safely.
- Perform automatic rollbacks.
- Apply machine learning to every deployment to identify and flag anomalies in future deployments.
This topic covers how to add and configure health sources for the AI Verify (v1) step.
Review: Verification setup options
To use the AI Verify (v1) step, you will need a Harness Monitored Service. In the simplest terms, a monitored service is basically a mapping of a Harness Service to a service monitored by your APM or logging tool.
You can set up a Monitored Service in the AI Verify (v1) step in a CD stage.
There are other ways to set up a Monitored Service. To learn more, go to Monitored Service
In this topic we'll set up the Monitored Service as part of the AI Verify (v1) step.
Step 1: Add AI Verify (v1) step
There are two ways to add the AI Verify (v1) step:
- When selecting the stage deployment strategy:
- The Verify step can be enabled in a CD stage the first time you open the Execution settings and select the deployment strategy.
- When you select the deployment strategy you want to use, there is also an Enable Verification option. Select it.
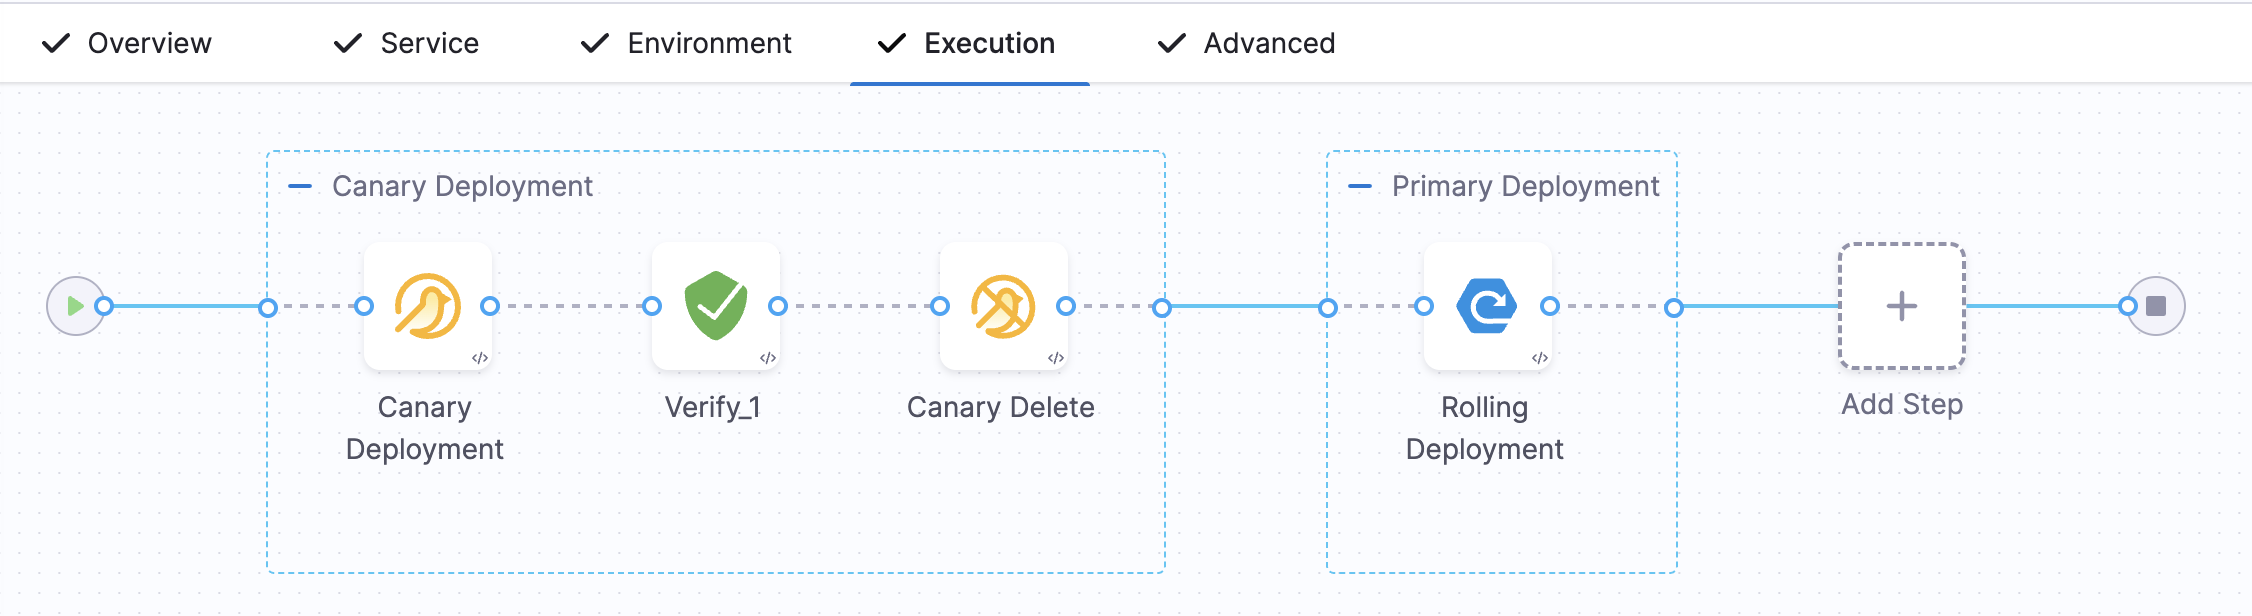
- Harness will automatically add the Verify step. For example, here is a stage where Canary strategy and the Enable Verification option were selected
- Add the AI Verify (v1) step to an existing Execution setup:
- You can also add the AI Verify (v1) step to the Execution section of a CD stage in a Pipeline you previously created.
- Simply click Add Step after the deployment step, and then select Verify.
Step 2: Enter a name and timeout
In Name, enter a name for the step.
In Timeout, enter a timeout value for the step.
You can use:
wfor weeksdfor dayshfor hoursmfor minutessfor secondsmsfor milliseconds
The maximum is 53w. Timeouts can be set at the Pipeline level also.
Step 3: Select a Continuous Verification Type
In Continuous Verification Type, select a type that matches your deployment strategy
Step 4: Create a Monitored Service
In Monitored Service, click Click to autocreate a monitored service.
Harness automatically creates a monitored service using a concatenation of the service and environment names. For example, a service named todolist and an environment named dev results in a monitored service with the name todolist_dev.
Monitored services can be stored in Git repositories using GitX, enabling version control and feature branch support for verification configurations. Go to Store monitored services in Git to configure GitX for monitored services.
The option to auto-create a monitored service is not available if you have configured either a service, an environment, or both as runtime values. When you run the pipeline, Harness concatenates the service and environment values you enter in the runtime inputs screen and generates a monitored service name. If a monitored service with the same name exists, Harness assigns it to the pipeline. If no monitored service that matches the generated monitored service name exists, Harness skips the verification step.
For example, suppose you enter the service as todolist and the environment as dev. In that case, Harness generates the monitored service name todolist_dev, checks whether a monitored service with the name todolist_dev is available, and assigns it to the pipeline. If no monitored service is available with the name todolist_dev, Harness skips the verification step.
Step 5: Add Health Sources
Harness supports a wide variety of health sources. For a full list, and instructions how to set up each one, go to health sources.
Step 6: Select Sensitivity
In Sensitivity, select High, Medium, or Low based on the risk level used as failure criteria during the deployment.
Step 7: Select Duration
Select how long you want Harness to analyze and monitor the logs/APM data points. Harness waits for 2-3 minutes to allow enough time for the data to be sent to the APM/logging tool before it analyzes the data. This wait time is a standard with monitoring tools.
The recommended Duration is 10 min for logging providers and 15 min for APM and infrastructure providers.
Configurable Properties
The AI Verify (v1) step supports configurable properties that allow you to customize verification behavior and access verification results in subsequent pipeline steps.
This feature is optional and currently behind the feature flag CDS_CV_INPUT_OUTPUT_VARIABLES_ENABLED. Contact Harness support to enable the feature.
To add a configurable property:
- In the AI Verify (v1) step configuration, expand the Optional section.
- Under Configurable Properties, select a property from the dropdown.
- Enter the value for the selected property.
deploymentStartTime
Use deploymentStartTime to specify when the deployment started. This tells Harness where to anchor the verification window, allowing the system to collect pre-deployment baseline data for the configured duration before this time. Enter the timestamp in UTC using one of the following formats:
- ISO 8601 (e.g.,
2023-03-10T15:30:00Z) - Common date/time format (e.g.,
2023-03-10 15:30:00) - Unix epoch timestamps (e.g.,
1678457400)
You can also use a pipeline expression to set the value dynamically. For example, <+pipeline.stages.stage_name.spec.execution.steps.step_name.startTs> resolves to the start timestamp of another step in your pipeline.
Future timestamps are not supported as fixed or runtime values. If you specify a time that has not yet been reached when the step runs, the verification will fail. If the specified time has already passed when the step executes, it is used as expected.
dataCollectionDuration
Use dataCollectionDuration to override the default data collection interval for the verification window. Enter the value as a positive integer representing the number of minutes. The maximum allowed value is 60 minutes.
customVerificationStartTime
By default, the post-deployment data collection window opens at the exact moment Harness executes the Verify step. CD deployment steps wait for a steady state before completing, which means the Verify step starts after a delay from when your service actually began running. During that delay, your health source may already be recording logs and metrics that fall outside the collection window.
Use customVerificationStartTime to shift the window start to an earlier timestamp so that data already recorded by your health source is included in the analysis. Enter a timestamp using any of the formats listed under deploymentStartTime. The value must be no earlier than the deployment start time.
If the custom time is earlier than the actual verification start time, Harness uses it as the window start. If the custom time is later than the actual verification start time, Harness ignores it, falls back to the actual verification start time, and logs a warning in the execution console.
For verification durations under 30 minutes, Harness buckets data in one-minute intervals, so a custom start time that falls earlier within a minute expands the collection window by one full minute.
Common use cases for this property include:
- Capturing head-of-deployment logs: If your health source (for example, Dynatrace) begins recording immediately when the service starts, set
customVerificationStartTimeto the deployment step start time to avoid missing the earliest entries. - Steps between deployment and verification: If you have additional steps between your deployment step and the Verify step, metrics and logs generated while those steps run are normally excluded from verification. Setting this property to the deployment step start time includes that data.
Sub-Task Notifications
This feature is optional and currently behind the feature flag CDS_CV_SUB_TASK_CUSTOM_WEBHOOK_NOTIFICATIONS_ENABLED. Contact Harness support to enable the feature.
Harness can send detailed webhook notifications for verification sub-tasks, allowing you to track the progress and results of individual verification operations such as data collection, log analysis, and time series analysis. This enables fine-grained monitoring and integration with external systems.
Enable Sub-Task Notifications
To configure custom webhook notifications for verification sub-tasks:
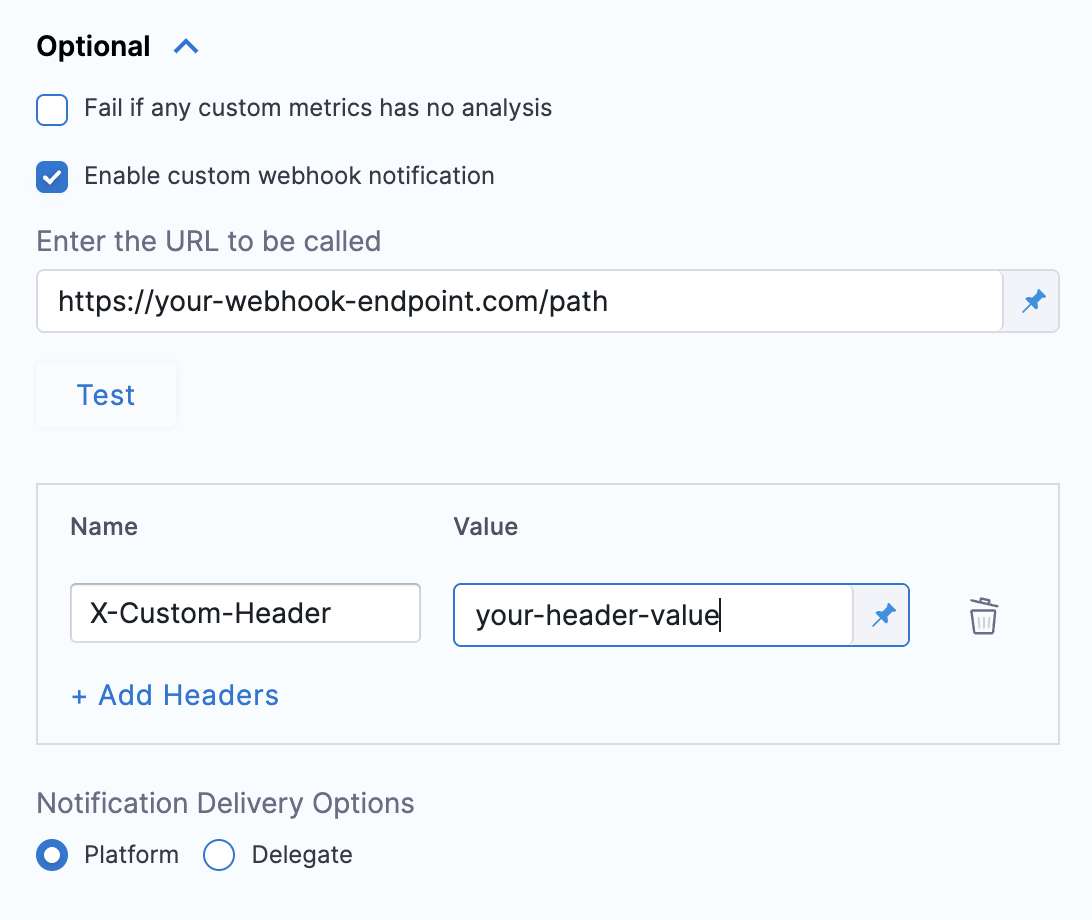
- In the AI Verify (v1) step configuration, expand the Optional section.
- Select the Enable custom webhook notification checkbox.
- Enter the URL to be called for the webhook endpoint.
- (Optional) Add custom headers by clicking + Add Headers and providing name-value pairs.
YAML configuration example:
isCustomWebhookNotificationEnabled: true
customWebhookNotification:
  notificationDeliveryMode: PLATFORM
  webhookUrl: https://your-webhook-endpoint.com/path
  headers:
    - key: X-Custom-Header
      value: your-header-value
Notification Delivery Options
You can choose how notifications are delivered:
- Platform (default): Notifications are sent through the Harness platform.
- Delegate: Notifications are sent through a Harness Delegate.
- When using delegate delivery, you can optionally specify delegate selectors to control which delegates handle the webhook calls.
Notification Event Types
When enabled, Harness sends webhook notifications for the following verification sub-task events:
Data Collection Task
Sent for data collection tasks status for a verification window.
Sample payload
{
  "eventData": {
    "verificationJobInstanceId": "your_verification_job_instance_id",
    "lastPickedAt": "2026-01-05T08:34:19.108Z",
    "verificationTaskId": "your_verification_task_id",
    "lastUpdatedAt": "1767602059813",
    "retryCount": "1",
    "eventType": "DataCollectionTask",
    "analysisEndTime": "2026-01-05T08:32:00Z",
    "notificationTimestamp": "1767602059827",
    "createdAt": "1767601849955",
    "startTime": "2026-01-05T08:31:00Z",
    "endTime": "2026-01-05T08:32:00Z",
    "firstPickedAt": "2026-01-05T08:34:19.108Z",
    "planExecutionId": "your_plan_execution_id",
    "status": "SUCCESS",
    "analysisStartTime": "2026-01-05T08:31:00Z"
  }
}
Deployment Time Series Analysis
Sent when time series (metric) analysis completes for a verification window.
Sample payload
{
  "eventData": {
    "verificationJobInstanceId": "your_verification_job_instance_id",
    "createdAt": "1767602082711",
    "verificationTaskId": "your_verification_task_id",
    "lastUpdatedAt": "1767602082711",
    "startTime": "2026-01-05T08:31:00Z",
    "endTime": "2026-01-05T08:32:00Z",
    "eventType": "DeploymentTimeSeriesAnalysis",
    "planExecutionId": "your_plan_execution_id",
    "notificationTimestamp": "1767602082723"
  }
}
Verification Terminal State
Sent when the verification step reaches a terminal state.
Sample payload
{
  "eventData": {
    "verificationJobInstanceId": "your_verification_job_instance_id",
    "isFinal": "true",
    "eventType": "VerificationTerminalState",
    "planExecutionId": "your_plan_execution_id",
    "status": "VERIFICATION_PASSED",
    "actualRunDuration": "489",
    "notificationTimestamp": "1767602326817"
  }
}
Payload Field Descriptions
Key correlation fields:
verificationJobInstanceId: Unique identifier for the verification job instanceplanExecutionId: Pipeline execution identifierverificationTaskId: Unique identifier for the verification task
There could be multiple verificationTaskId values correlated with a single verificationJobInstanceId.
Use these fields to correlate and group related notifications for a single verification execution.
Event types:
DataCollectionTask: Data collection completedDeploymentLogAnalysis: Logs analysis completedDeploymentTimeSeriesAnalysis: Metric analysis completedVerificationTerminalState: Final verification result
For a typical 5-minute verification step, you can expect to receive multiple webhook notifications as sub-tasks progress with analysis notifications followed by data collection notifications and then a terminal notification with final status.
Testing Webhook Configuration
After configuring your webhook URL and headers, you can click the Test button to send a sample notification to your webhook endpoint. This helps verify that your endpoint is properly configured to receive and process the notifications.
Step 8: Specify Artifact Tag
In Artifact Tag, use a Harness expression.
The expression <+serviceConfig.artifacts.primary.tag> refers to the primary artifact.
Option: Advanced Settings
In Advanced, you can select the following options:
Step 9: Deploy and Review Results
After setting up the Verify step, click Apply Changes.
Click Run to run the pipeline.
In Run Pipeline, select the tag for the artifact if a tag was not added in the Artifact Details settings.
Click Run Pipeline.
When the Pipeline is running, click the Verify step.
You can see that the verification takes a few minutes.
Once verification is complete, the AI Verify (v1) step shows the following:
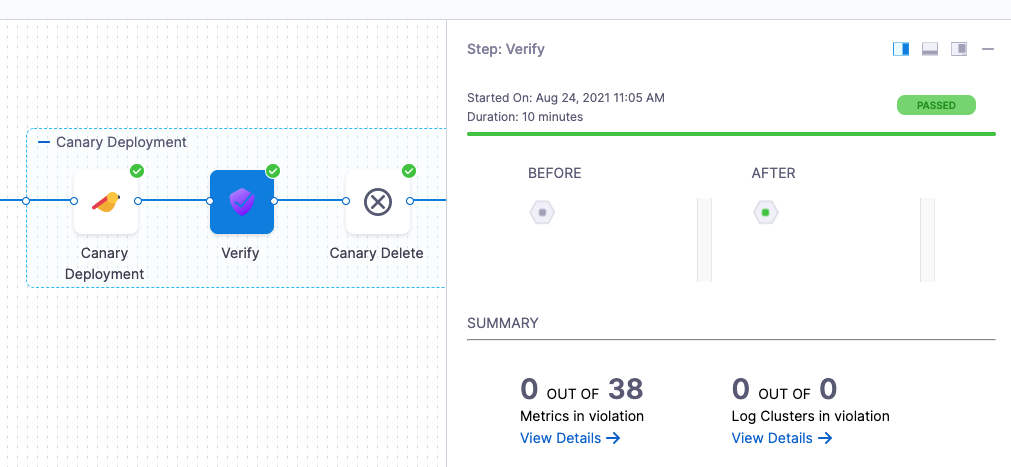
The risk level might initially display a number of violations, but the red and orange colored host often change to green over the duration.
Summary
The Summary section shows the number of logs that are in violation.
Console View
Click Console View or simply click View Details in Summary to take a deeper look at verification.
You can use the search option to search for any specific metric or transaction you want.
Set a pinned baseline
Currently, this feature is behind the feature flag SRM_ENABLE_BASELINE_BASED_VERIFICATION. Contact Contact Harness support to enable the feature.
You can set specific verification in a successful pipeline execution as a baseline. This is available with Load Testing as the verification type.
Set successful verification as a baseline
To set a verification as baseline for future verifications:
-
In Harness, go to Deployments, select Pipelines, and find the pipeline you want to use as the baseline.
-
Select the successful pipeline execution with the verification that you want to use as the baseline.
The pipeline execution is displayed.
-
On the pipeline execution, navigate to the Verify section, and then select Pin baseline.
The selected verification is now set as the baseline for future verifications.
Replace an existing pinned baseline
To use a new baseline from a pipeline and replace the existing pinned baseline, follow these steps:
-
In Harness, go to Deployments, select Pipelines, and find the pipeline from which you want to remove the baseline.
-
Select the successful pipeline execution with the verification that you have previously pinned as the baseline.
-
On the pipeline execution, navigate to the Verify section, and then select Pin baseline.
A confirmation alert message appears, asking if you want to replace the existing pinned baseline with the current verification. After you confirm, the existing pinned baseline gets replaced with the current verification.