Git Experience Health Status Page
After you connect your Harness entities to a Git repository, Harness monitors the health of the bi-directional synchronization between Git and Harness. The Git Experience Health Status feature gives you visibility into webhook coverage and Git sync events, so you can identify and troubleshoot synchronization issues.
You can monitor Git sync health in two ways:
- Account-level dashboard: Shows webhook coverage across your connected Git repositories, so you can quickly identify repositories that are fully configured or require attention.
- Event-level view: Provides detailed information for each Git event processed by Harness, including processing status, timestamps, and any errors encountered during synchronization.
Using these views, you can verify that Git changes are received and processed correctly, detect configuration issues early, and maintain a reliable Git Experience workflow.
What you will learn in this topic
- How to check account-level bi-directional sync health.
- How to view repository sync status.
- How to interpret the sync status values.
- How to view rate limit consumption.
- How to view individual webhook sync events.
Account-level bi-directional sync health
Bi-directional sync ensures that changes made in Git are synchronized with Harness by using GitX webhooks for repositories that contain remote entities. When your entities are distributed across multiple repositories, it can be difficult to verify that every repository is configured correctly for synchronization. The Observability view provides a centralized view of repository sync health and webhook coverage, making it easier to identify and resolve synchronization issues. Repository Sync Status supports all supported Git providers, including GitHub, GitLab, and Bitbucket.
It helps you to:
- Monitor bi-directional sync health and webhook coverage across your Git-backed entities from one account-level view.
- Identify repositories with missing or misconfigured webhooks before direct Git changes go unsynced and leave the Harness cache stale.
- Determine which repositories need a webhook created or updated, and remediate them before synchronization breaks.
To access the feature, go to the Webhooks page and select the Observability tab. This tab is available at the account scope when the feature is enabled.
If rate-limit monitoring is enabled, the Observability tab displays two collapsible sections. Expand either section to view the associated data.
- Bi-directional sync health: Repositories in scope without a webhook configured, and the entities at risk.
- Rate limit consumption: Per-connector rate-limit consumption over time, by provider and bucket.
Ensure your Harness Delegate is running version 896xx or later to use the Repository Sync Status and Rate Limit Consumption features.
View repository sync status
The repository sync status view provides a centralized overview of the synchronization status of entities across your Git repositories. Use the available filters and table controls to quickly locate repositories, monitor sync status, and customize the information displayed.
- Use the Repository and Entity Type selectors to filter the view.
- The Entity Type selector supports Environments, Infrastructures, Input Sets, Pipelines, Services, Service Overrides, and Templates.
- Refresh the page: Select the refresh icon to re-fetch the latest data for all repositories.
- Configure column display: Use the Columns selector to show or hide columns in the table.
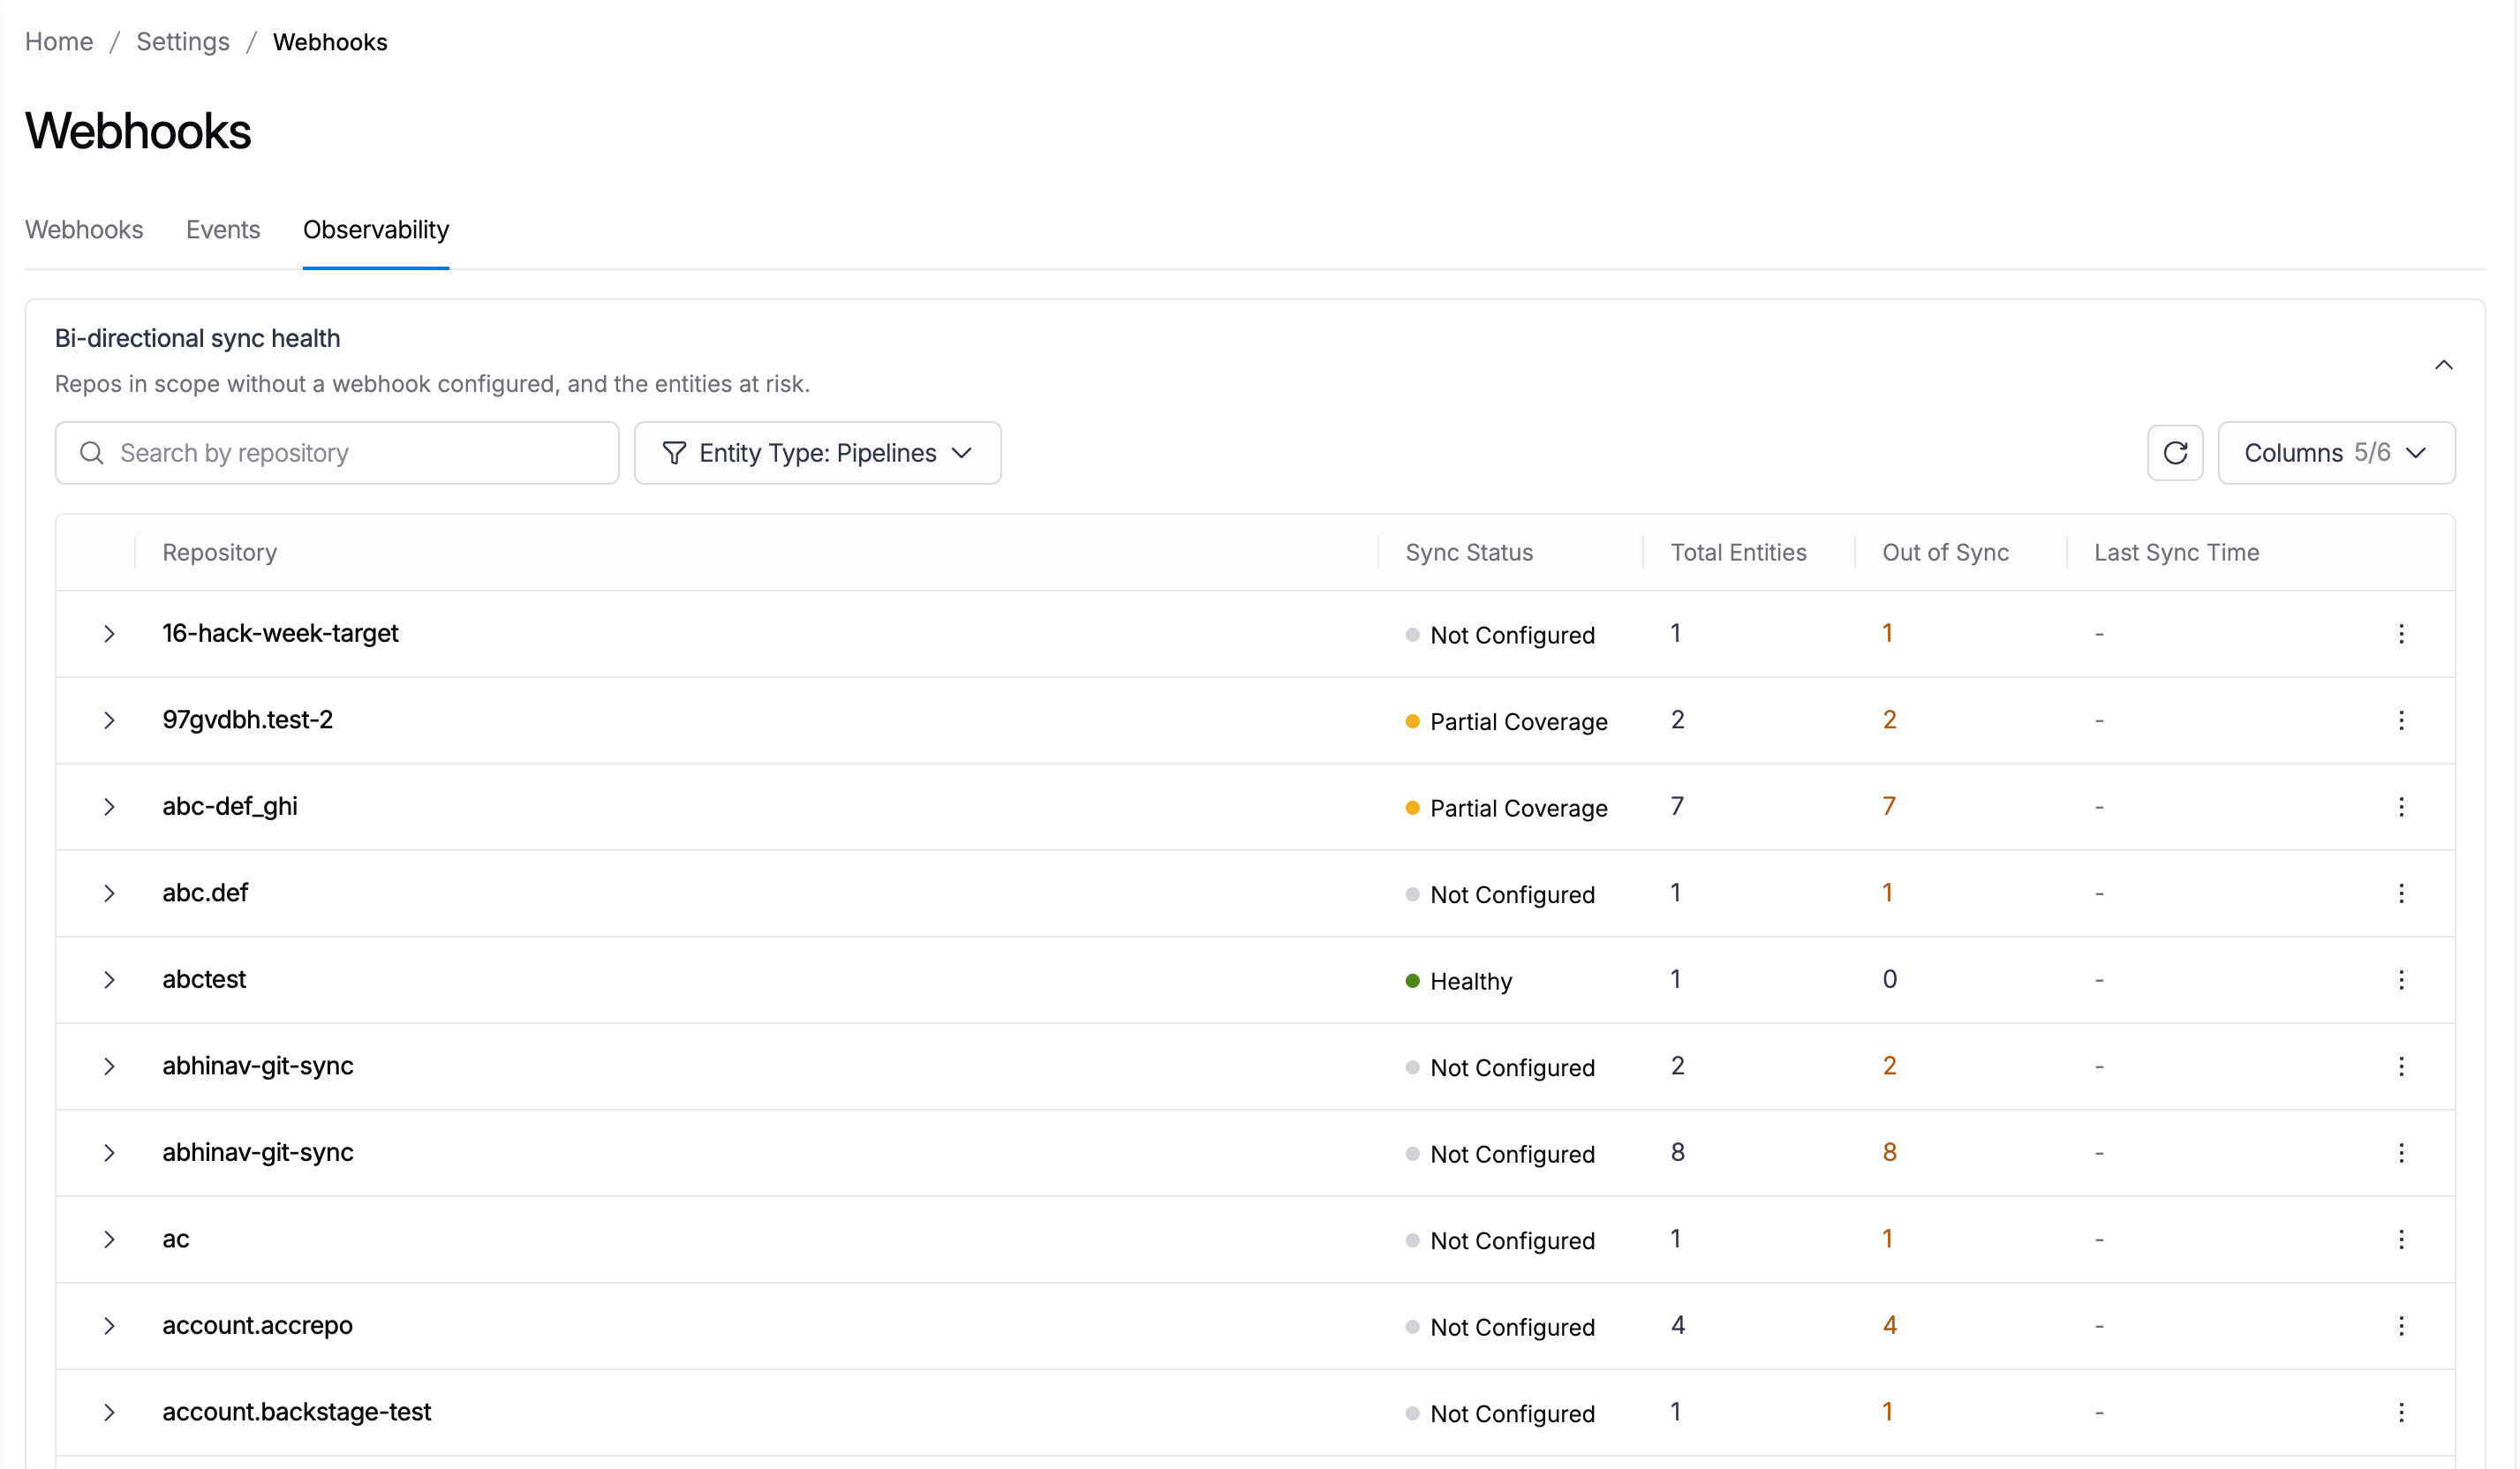
The repository list shows one row per repository with the following columns:
| Column | Description |
|---|---|
| Repository | The Git repository that holds the remote entities. |
| Entity Type | The type of Git-backed entities in the repository. |
| Sync Status | The webhook coverage status for the repository. |
| Total Entities | The number of remote entities Harness found in the repository. |
| Out of Sync | The number of entities that are out of sync with the source repository. This field is not applicable when the repository health status is Healthy. |
| Last Sync Time | The time of the most recent sync for the repository, or - if it has not yet synced. This field is displayed only when the repository status is Healthy. |
Each repository row has a three-dot menu (⋮) with two actions:
- View details: Opens the repository's entity details. To see the entities in a repository, expand its row or select View details.
- Refresh: Available only in the expanded View details section to re-fetch the repository's latest sync status.
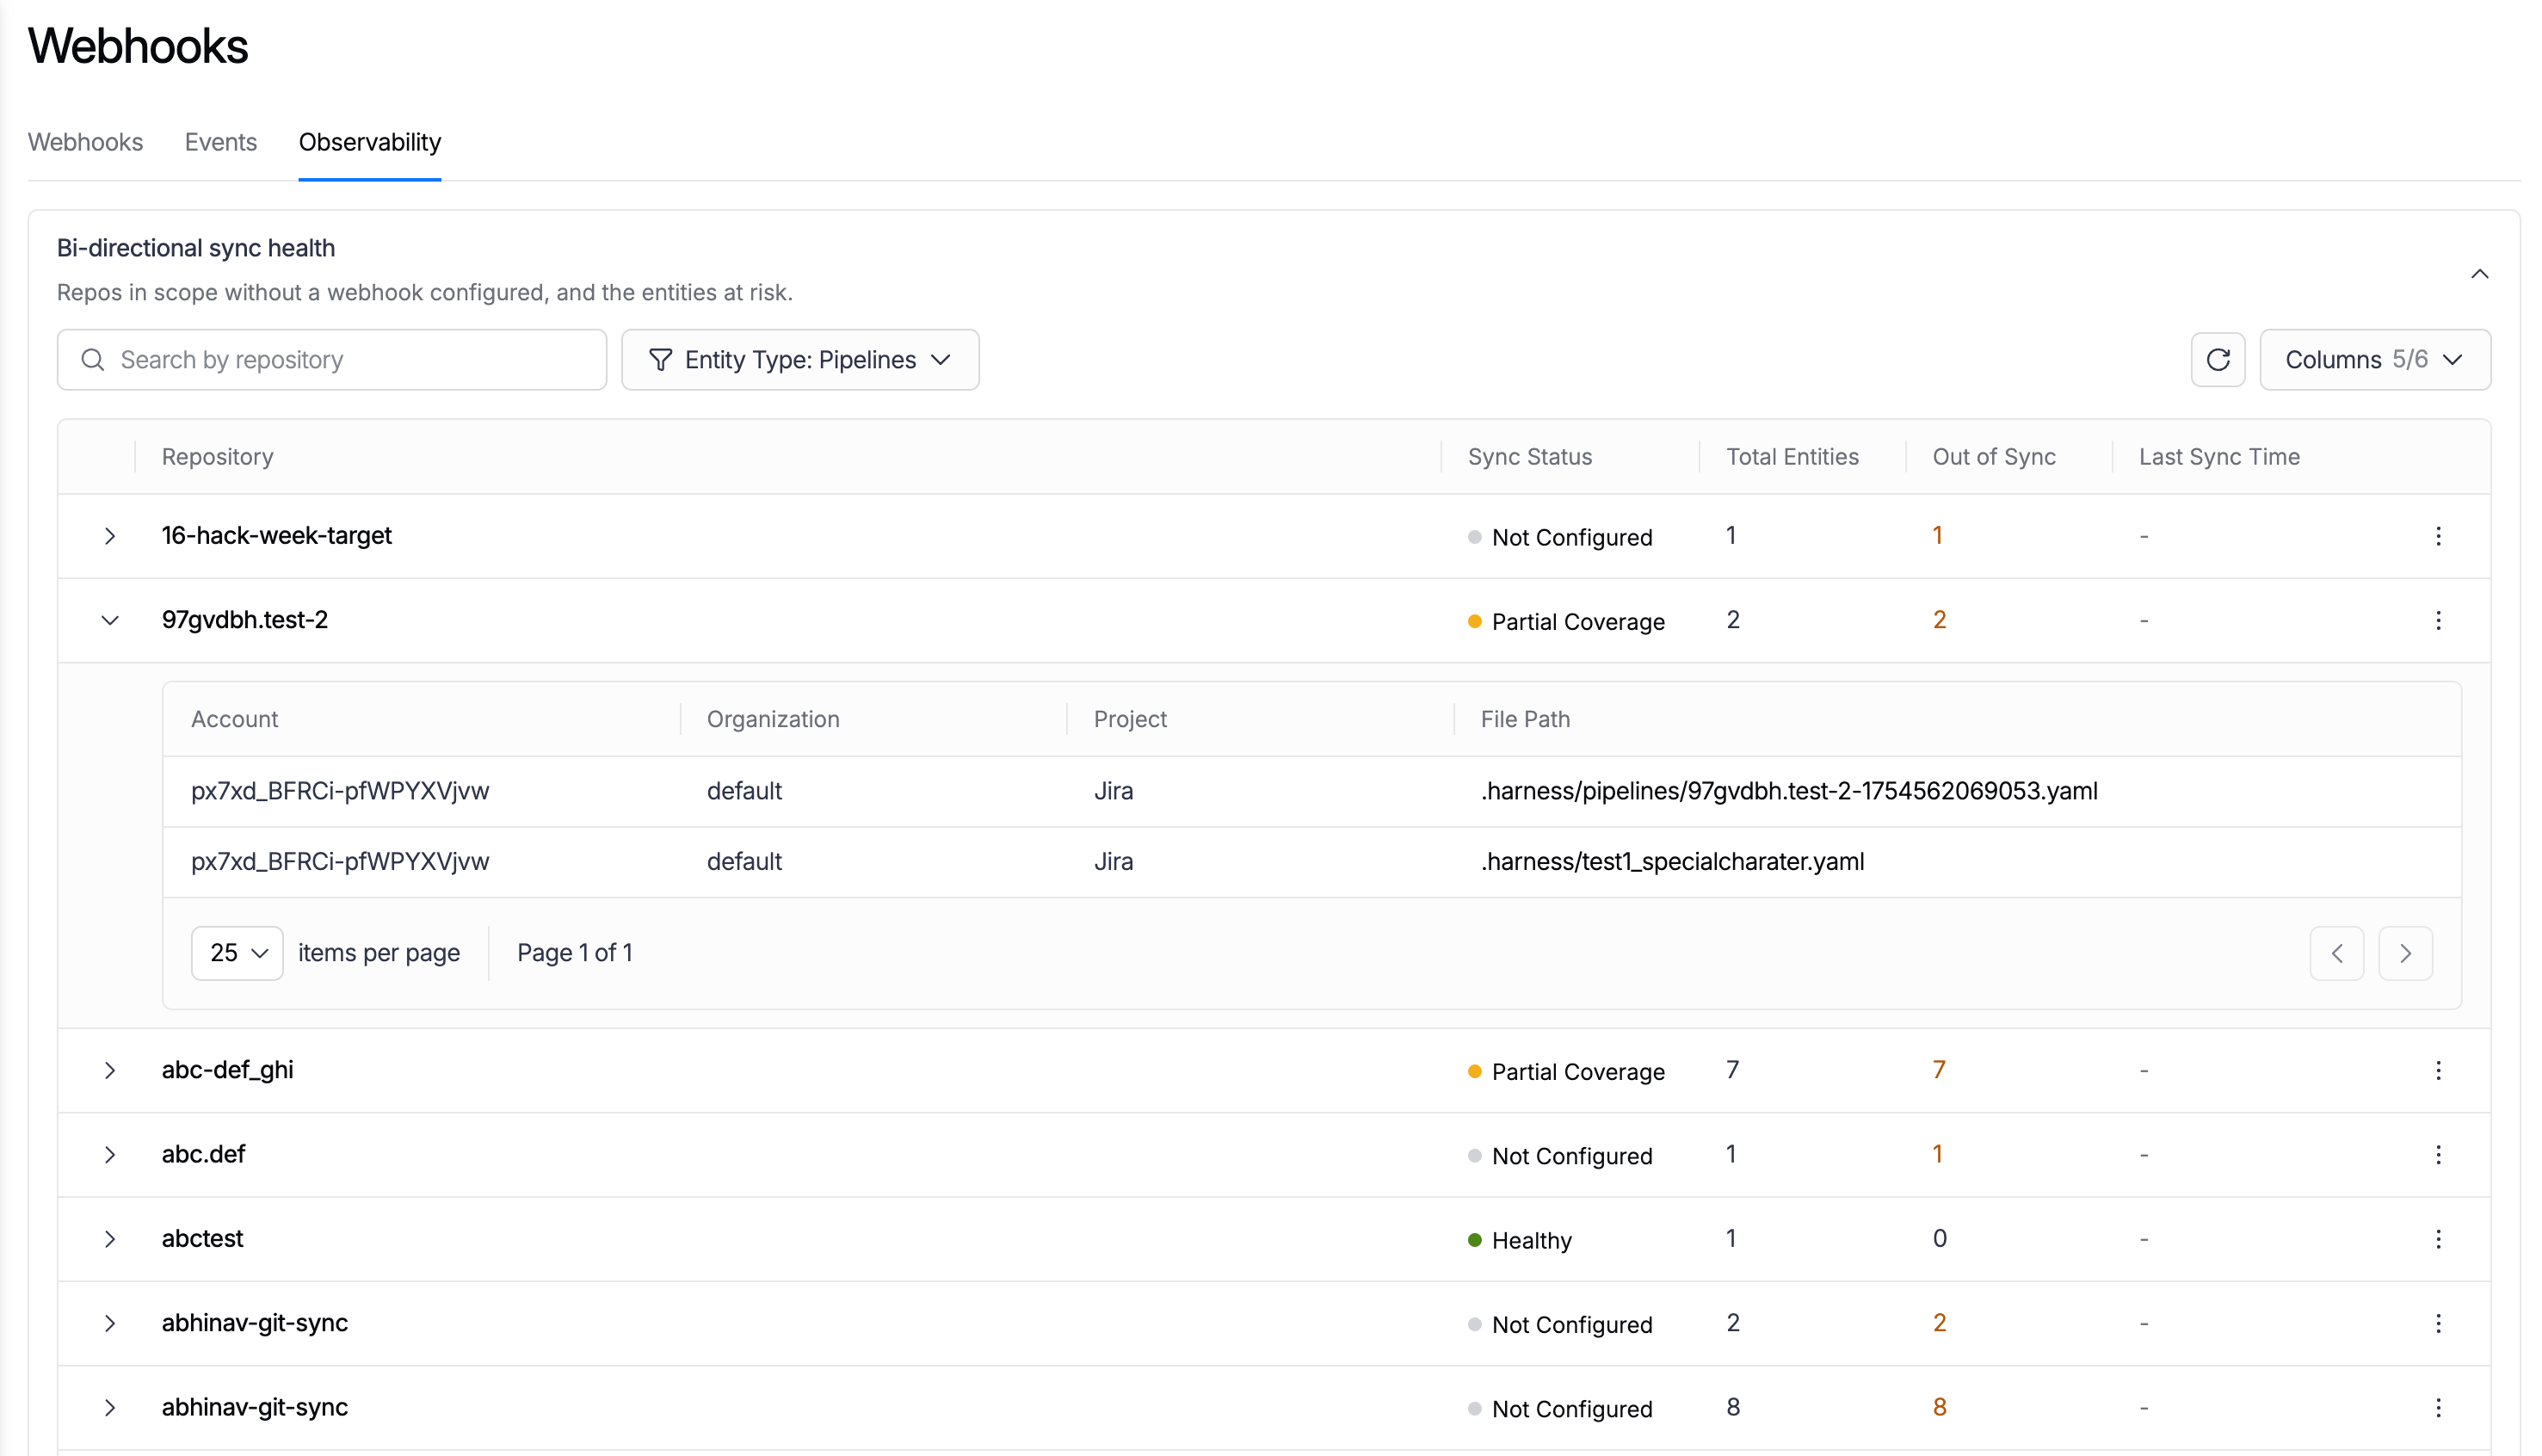
The entity details show the following columns:
| Column | Description |
|---|---|
| Account | The account the entity belongs to. |
| Organization | The organization the entity belongs to, if any. |
| Project | The project the entity belongs to, if any. |
| File Path | The path to the entity's YAML file in the repository. |
The entity details are paginated. Use the items-per-page selector and the page controls to move through the list.
Sync status values
The Sync Status column reflects how completely the repository's entities are covered by webhooks:
- Healthy: All the repository's remote entities are covered by a webhook.
- Partial Coverage: The repository is only partially governed by a webhook. This status is shown when:
- The webhook is disabled.
- The webhook scope differs from the scope of the repository's entities (for example, the webhook is configured for Project A, while some entities are stored in Project B).
- The webhook monitors only a subset of the repository's tracked file paths. For example, if the webhook monitors
.harness/,.harness/file1, and.harness/file2, but an entity referencesfile3outside the.harnessdirectory, that file is not governed by the webhook.
- Not Configured: No webhook is configured for the repository, so bi-directional sync cannot happen for its entities.
Each status appears with a colored indicator: green for Healthy, amber for Partial Coverage, and gray for Not Configured.
The sync health view is available at the account scope.
This view is behind the feature flag PIPE_GITX_WEBHOOK_HEALTH_PER_REPO. Contact Harness Support to enable the feature.
Rate limit consumption
The Rate limit consumption section provides visibility into Git provider API rate-limit usage across your Git connectors. It helps you monitor API consumption trends, identify connectors nearing their rate limits, and take corrective action before rate-limit exhaustion affects Git operations.
It helps you to:
- Monitor Git provider API rate-limit consumption over time by provider and rate-limit bucket.
- Identify connectors that are approaching their Git provider API rate limits before they impact pipelines or entity synchronization.
- Determine when to redistribute traffic or migrate to a higher-limit connection, such as a GitHub App, to avoid rate-limit exhaustion.
The rate-limit metrics displayed in this section include only Git provider API calls made by Harness using the configured Git connector credentials. API requests made outside of Harness (for example, by users, scripts, CI/CD systems, or other applications using the same credentials) are not tracked and are not reflected in the reported consumption.
If no Git API requests have been made by Harness using a connector during the last 24 hours, rate-limit data is unavailable for that connector. In this case, the UI displays the default (-) or null values.
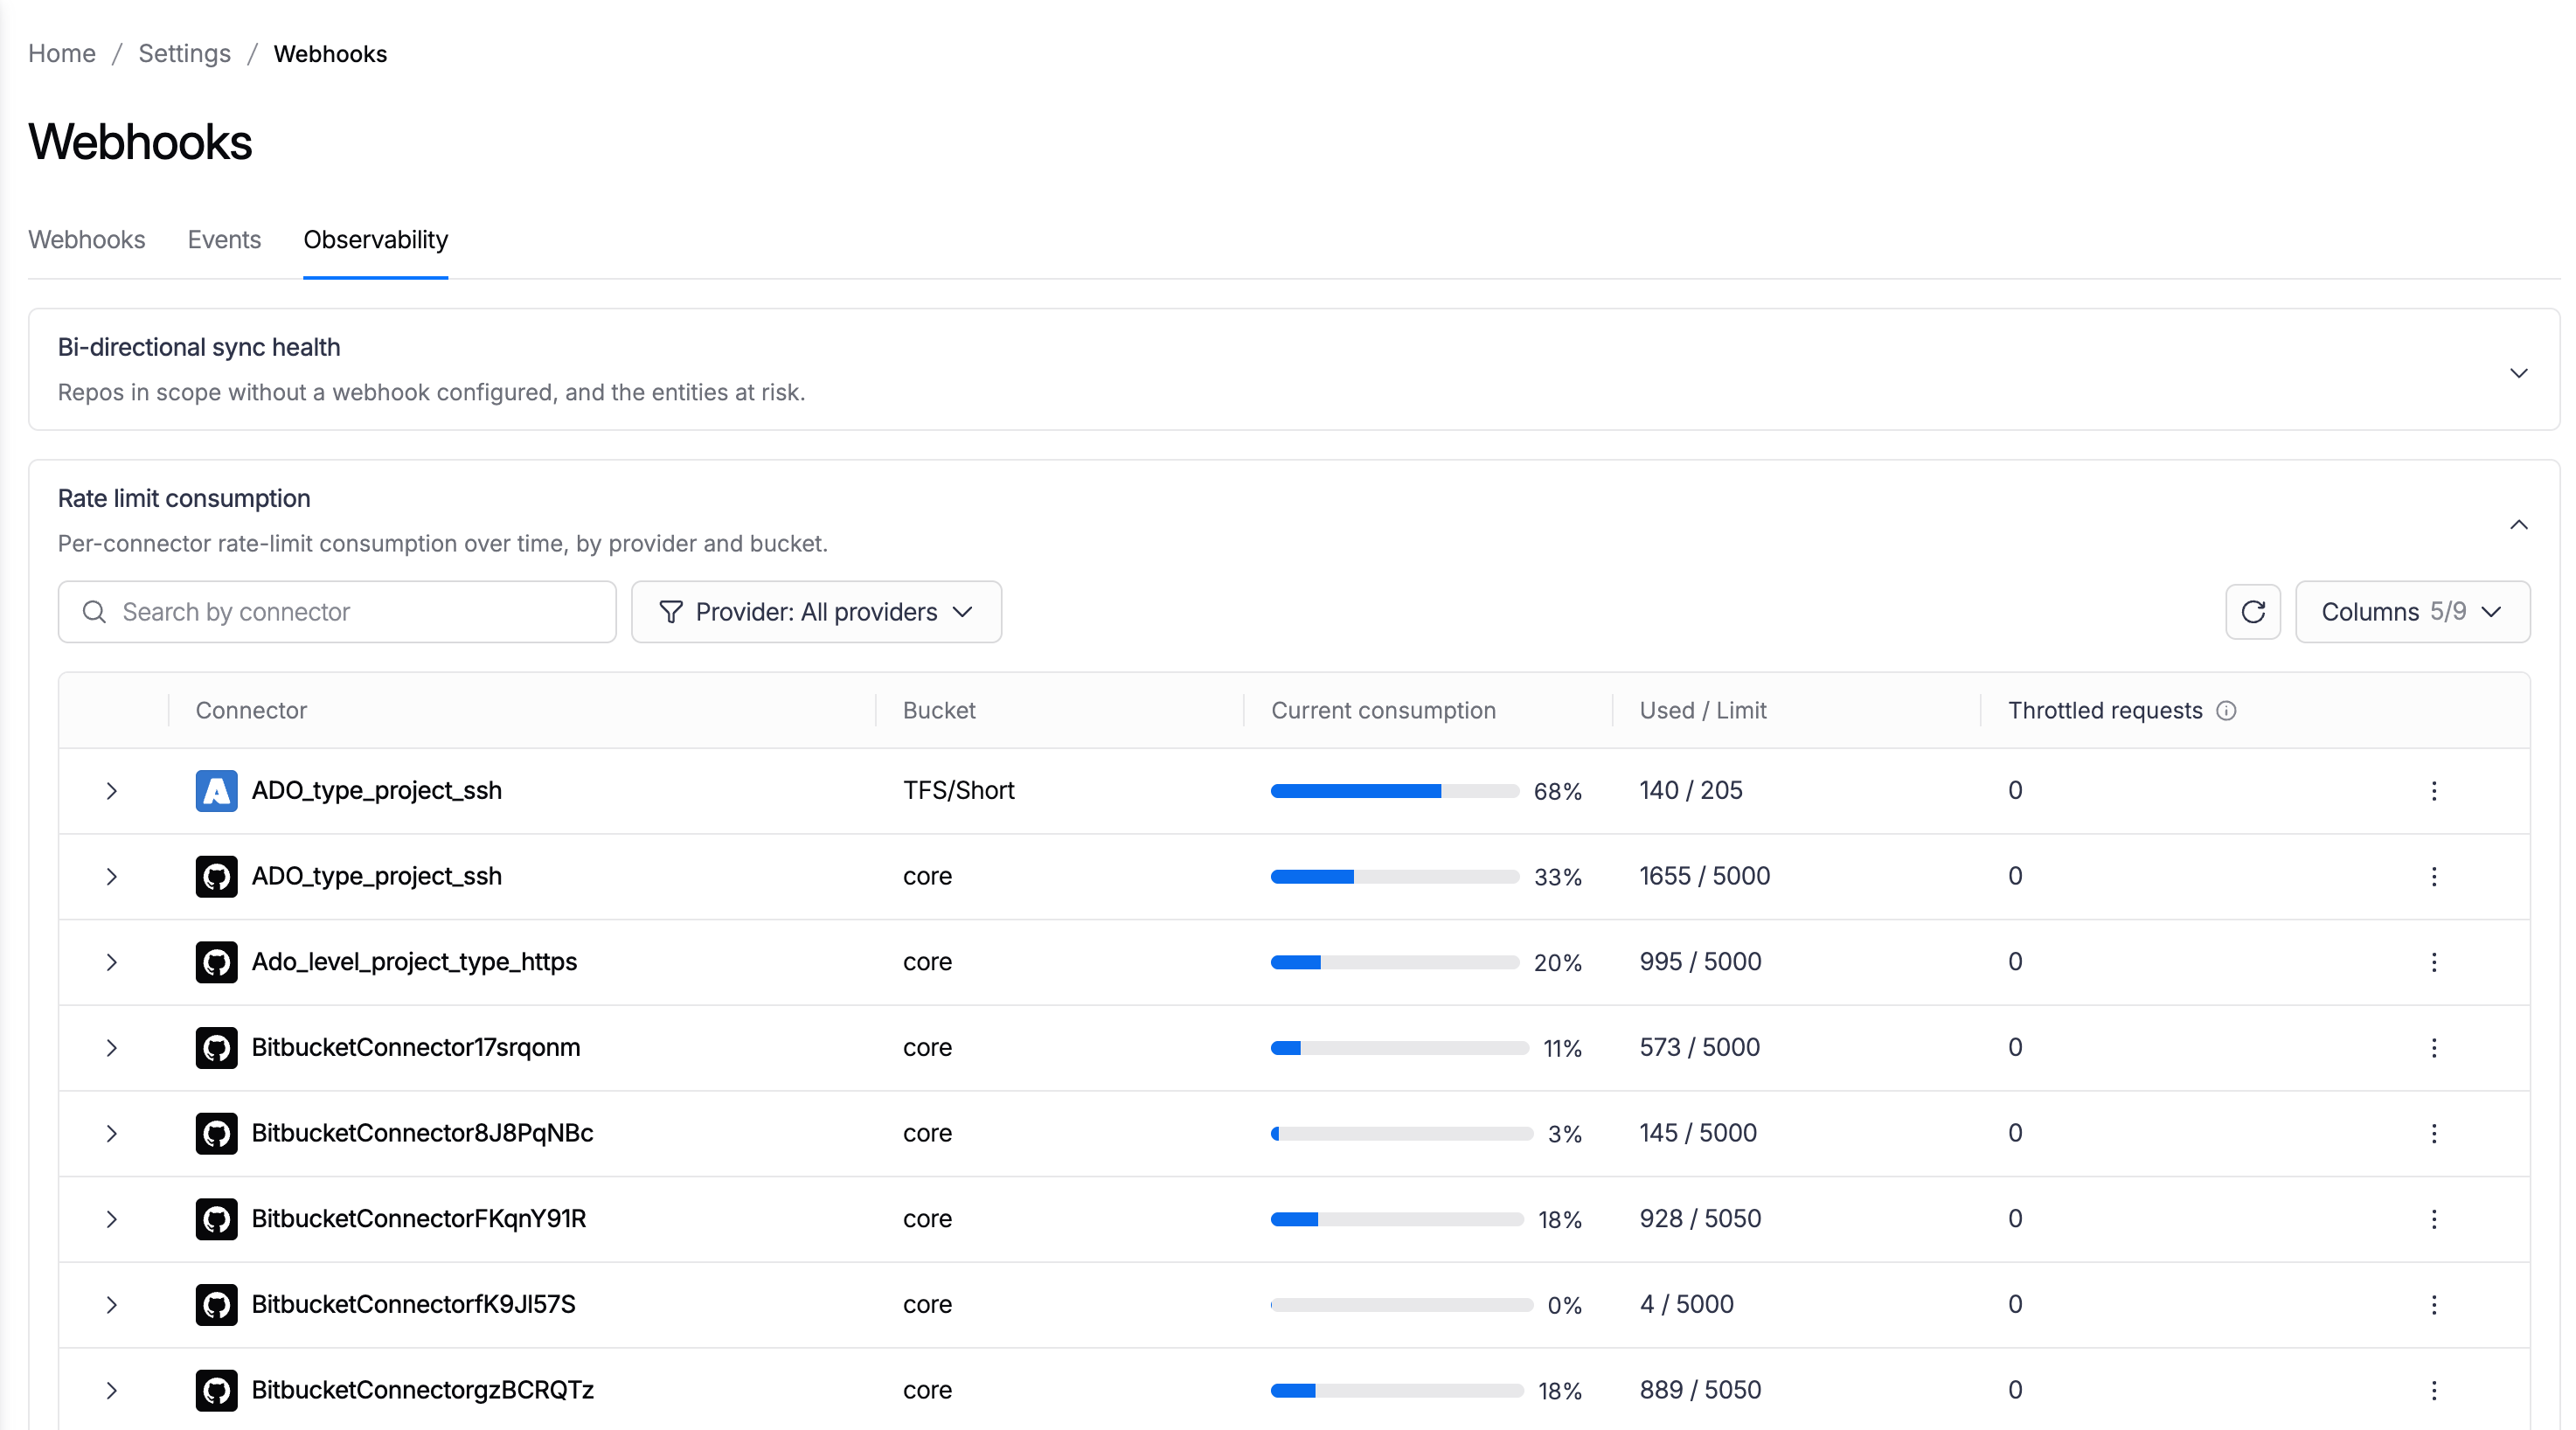
To scope and customize the view:
- Use the Search by connector field and the Provider filter to scope the list.
- The Provider filter supports All providers, GitHub, GitLab, Bitbucket, Bitbucket Server, and Azure Repos.
- Select the refresh icon to reload the metrics, and use the Columns selector to show or hide columns (select Reset to restore the defaults). The active filters are reflected in the page URL, so you can bookmark or share a specific view.
Each row shows a connector's consumption for a rate-limit bucket:
| Column | Description |
|---|---|
| Connector | The connector consuming the Git provider API. |
| Provider | The Git provider for the connector. |
| Bucket | The rate-limit bucket, for example core. |
| Current consumption | A progress bar and the percentage of the limit currently used. |
| Used / Limit | Requests used against the maximum allowed, for example 29 / 5000. |
| Remaining | The number of requests still available in the current window. |
| Resets in | When the current rate-limit window resets. |
| Throttled requests | The number of requests blocked because the limit was reached. |
| Last updated | When Harness last refreshed the metrics for the connector. |
Each row has a three-dot menu (⋮) with two actions:
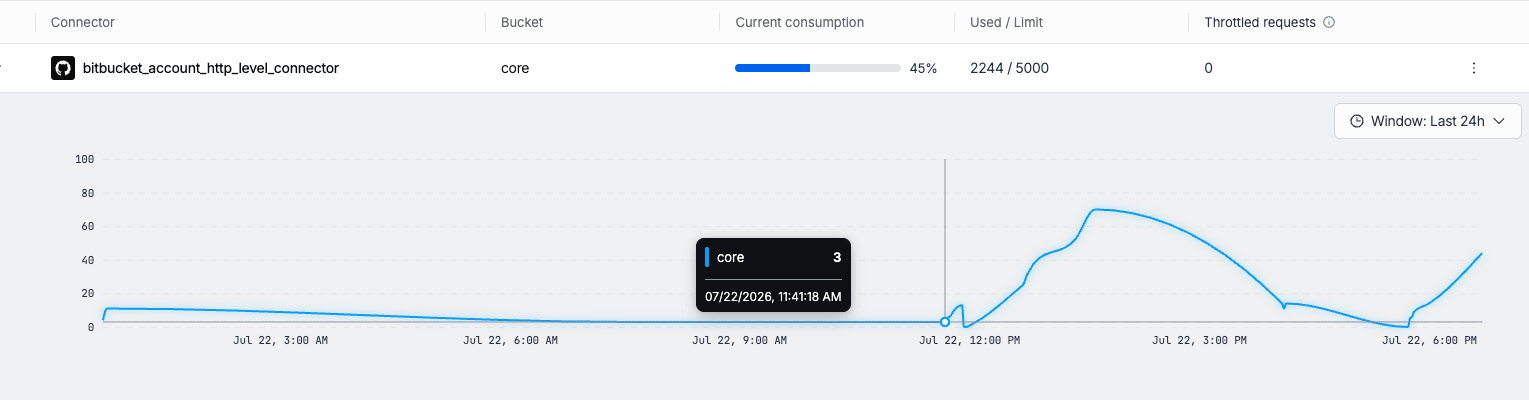
- View details: Expand the connector to show its consumption chart.
- Refresh: Available only in the expanded View details section to reload the metrics for the connector.
To see historical usage:
- Expand a connector row or select View details. The chart plots Percent consumed (0-100) over time for the bucket.
- Use the Window selector to change the time range: Last 1h, Last 3h, Last 6h, Last 12h, or Last 24h.
- Hover over a point to see the bucket, value, and timestamp.
If Harness has no data for the selected connector and window, the chart shows No timeline data.
This section is behind the feature flag PIPE_GITX_RATE_LIMITS_API. Contact Harness Support to enable the feature.
View webhook sync events
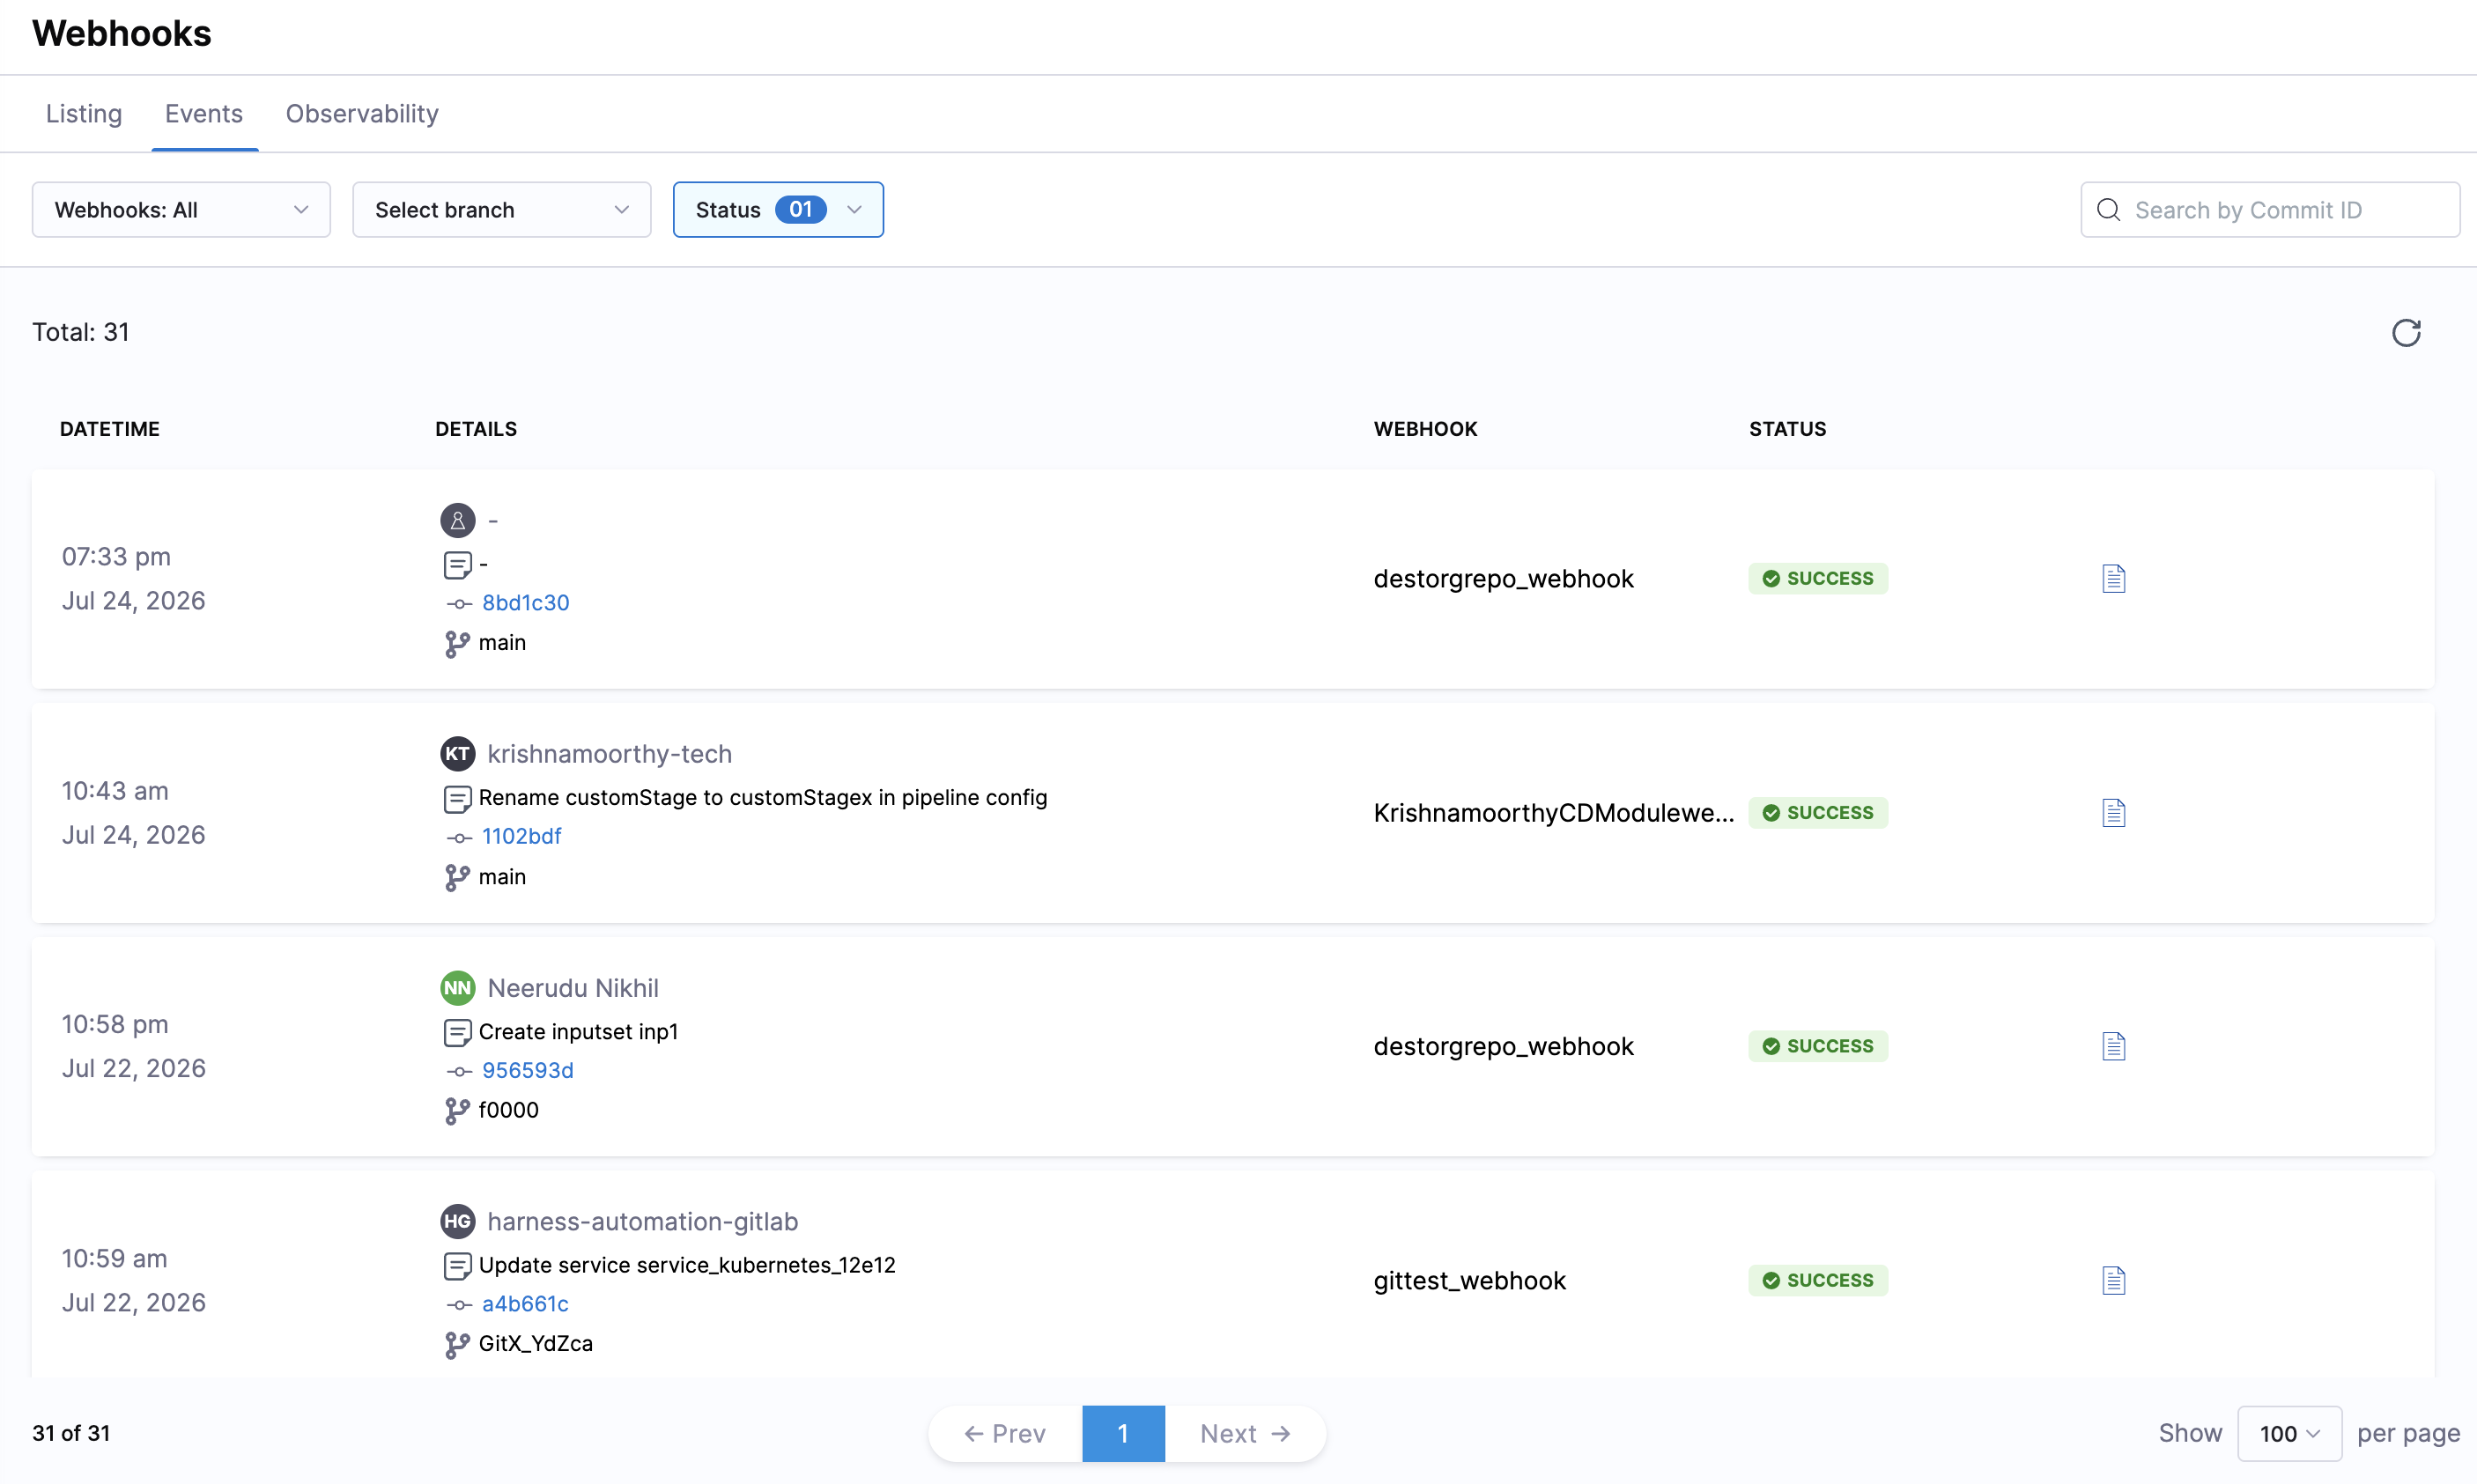
On the Webhooks page, select the Events tab to view the webhook sync events. The Events tab displays the history of webhook executions, allowing you to monitor webhook activity, filter results, and inspect individual event details.
-
The following filters are available at the top of the page:
- Webhooks: Select a specific webhook from the drop-down to display events for that webhook only. By default, All webhooks are displayed.
- Branch: Filter events by the repository branch.
- Status: Filter events based on their execution status. The available statuses are:
- FAILED
- PROCESSING
- QUEUED
- SKIPPED
- SUCCESS
- WARNING
-
Search by Commit ID: Search for a specific event by entering the commit ID.
-
Click the Refresh icon to reload the event list and retrieve the latest webhook execution records.
-
Each event displays the following information:
- Date and Time - When the webhook event was triggered.
- Details such as author who triggered the commit, commit message, commit ID (clickable), and branch name.
- Name of the webhook that processed the event.
- Current execution status of the webhook event.
- Click the document icon to view detailed information about the selected webhook execution, including the request and response payloads (if available).
-
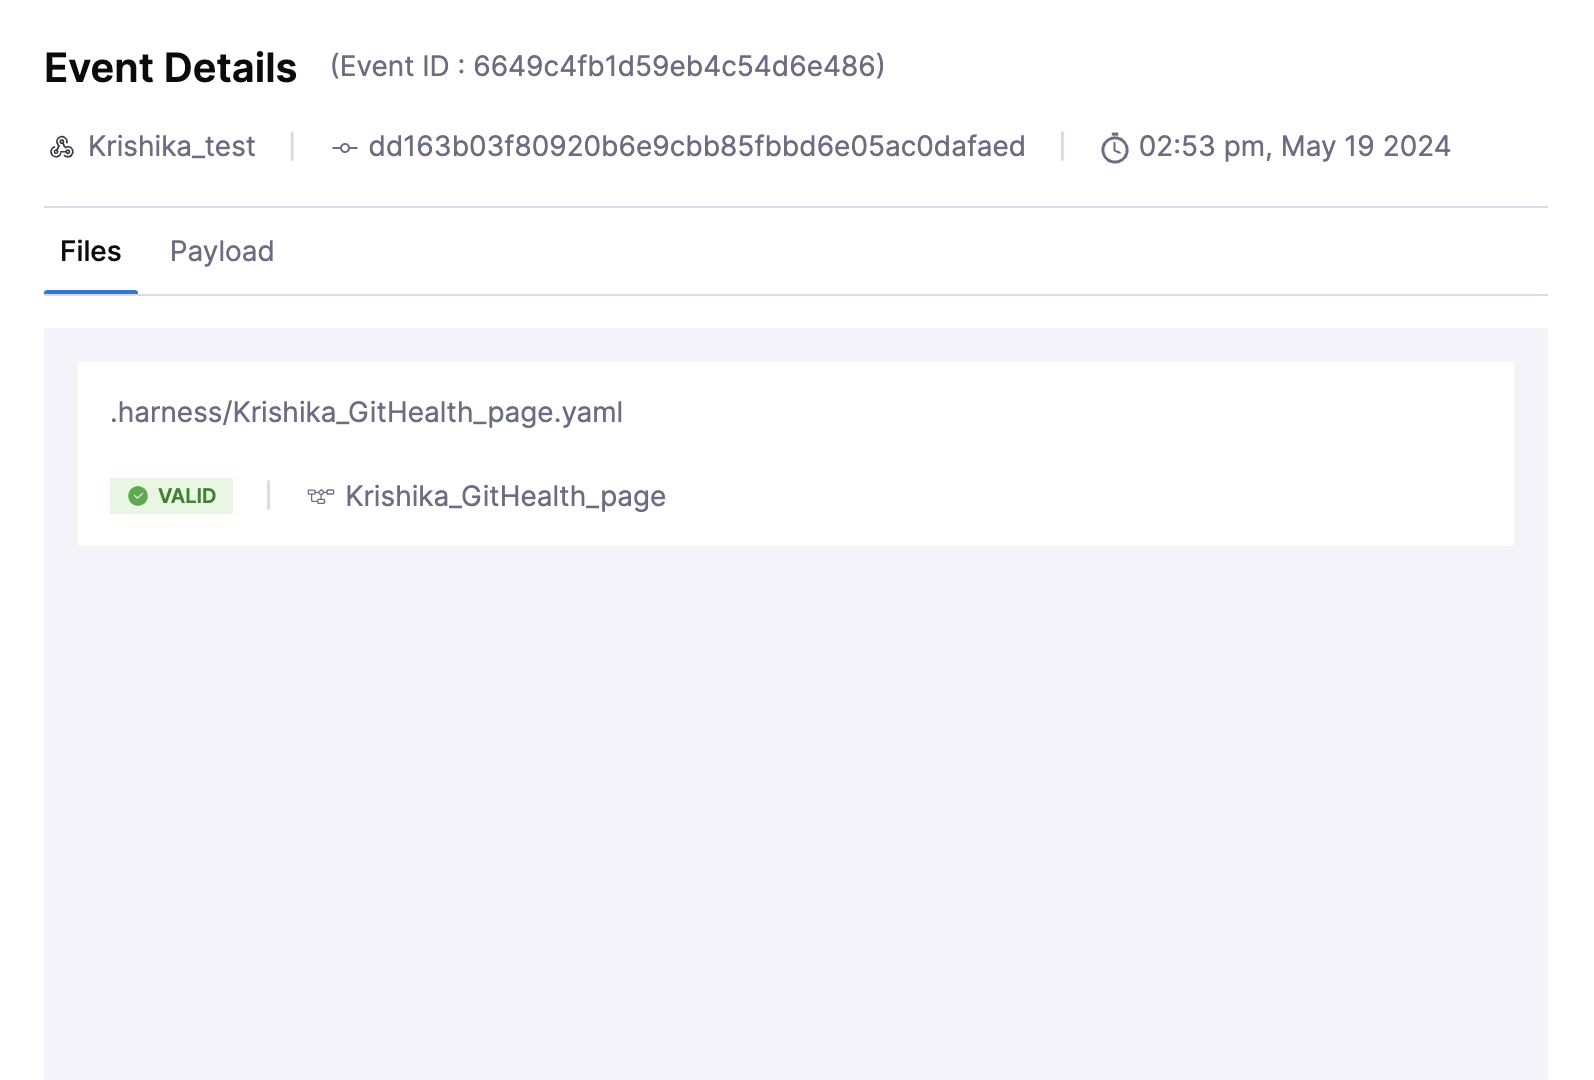
Select an event to open Event Details, where you see the file changes and the payload that was sent.
-
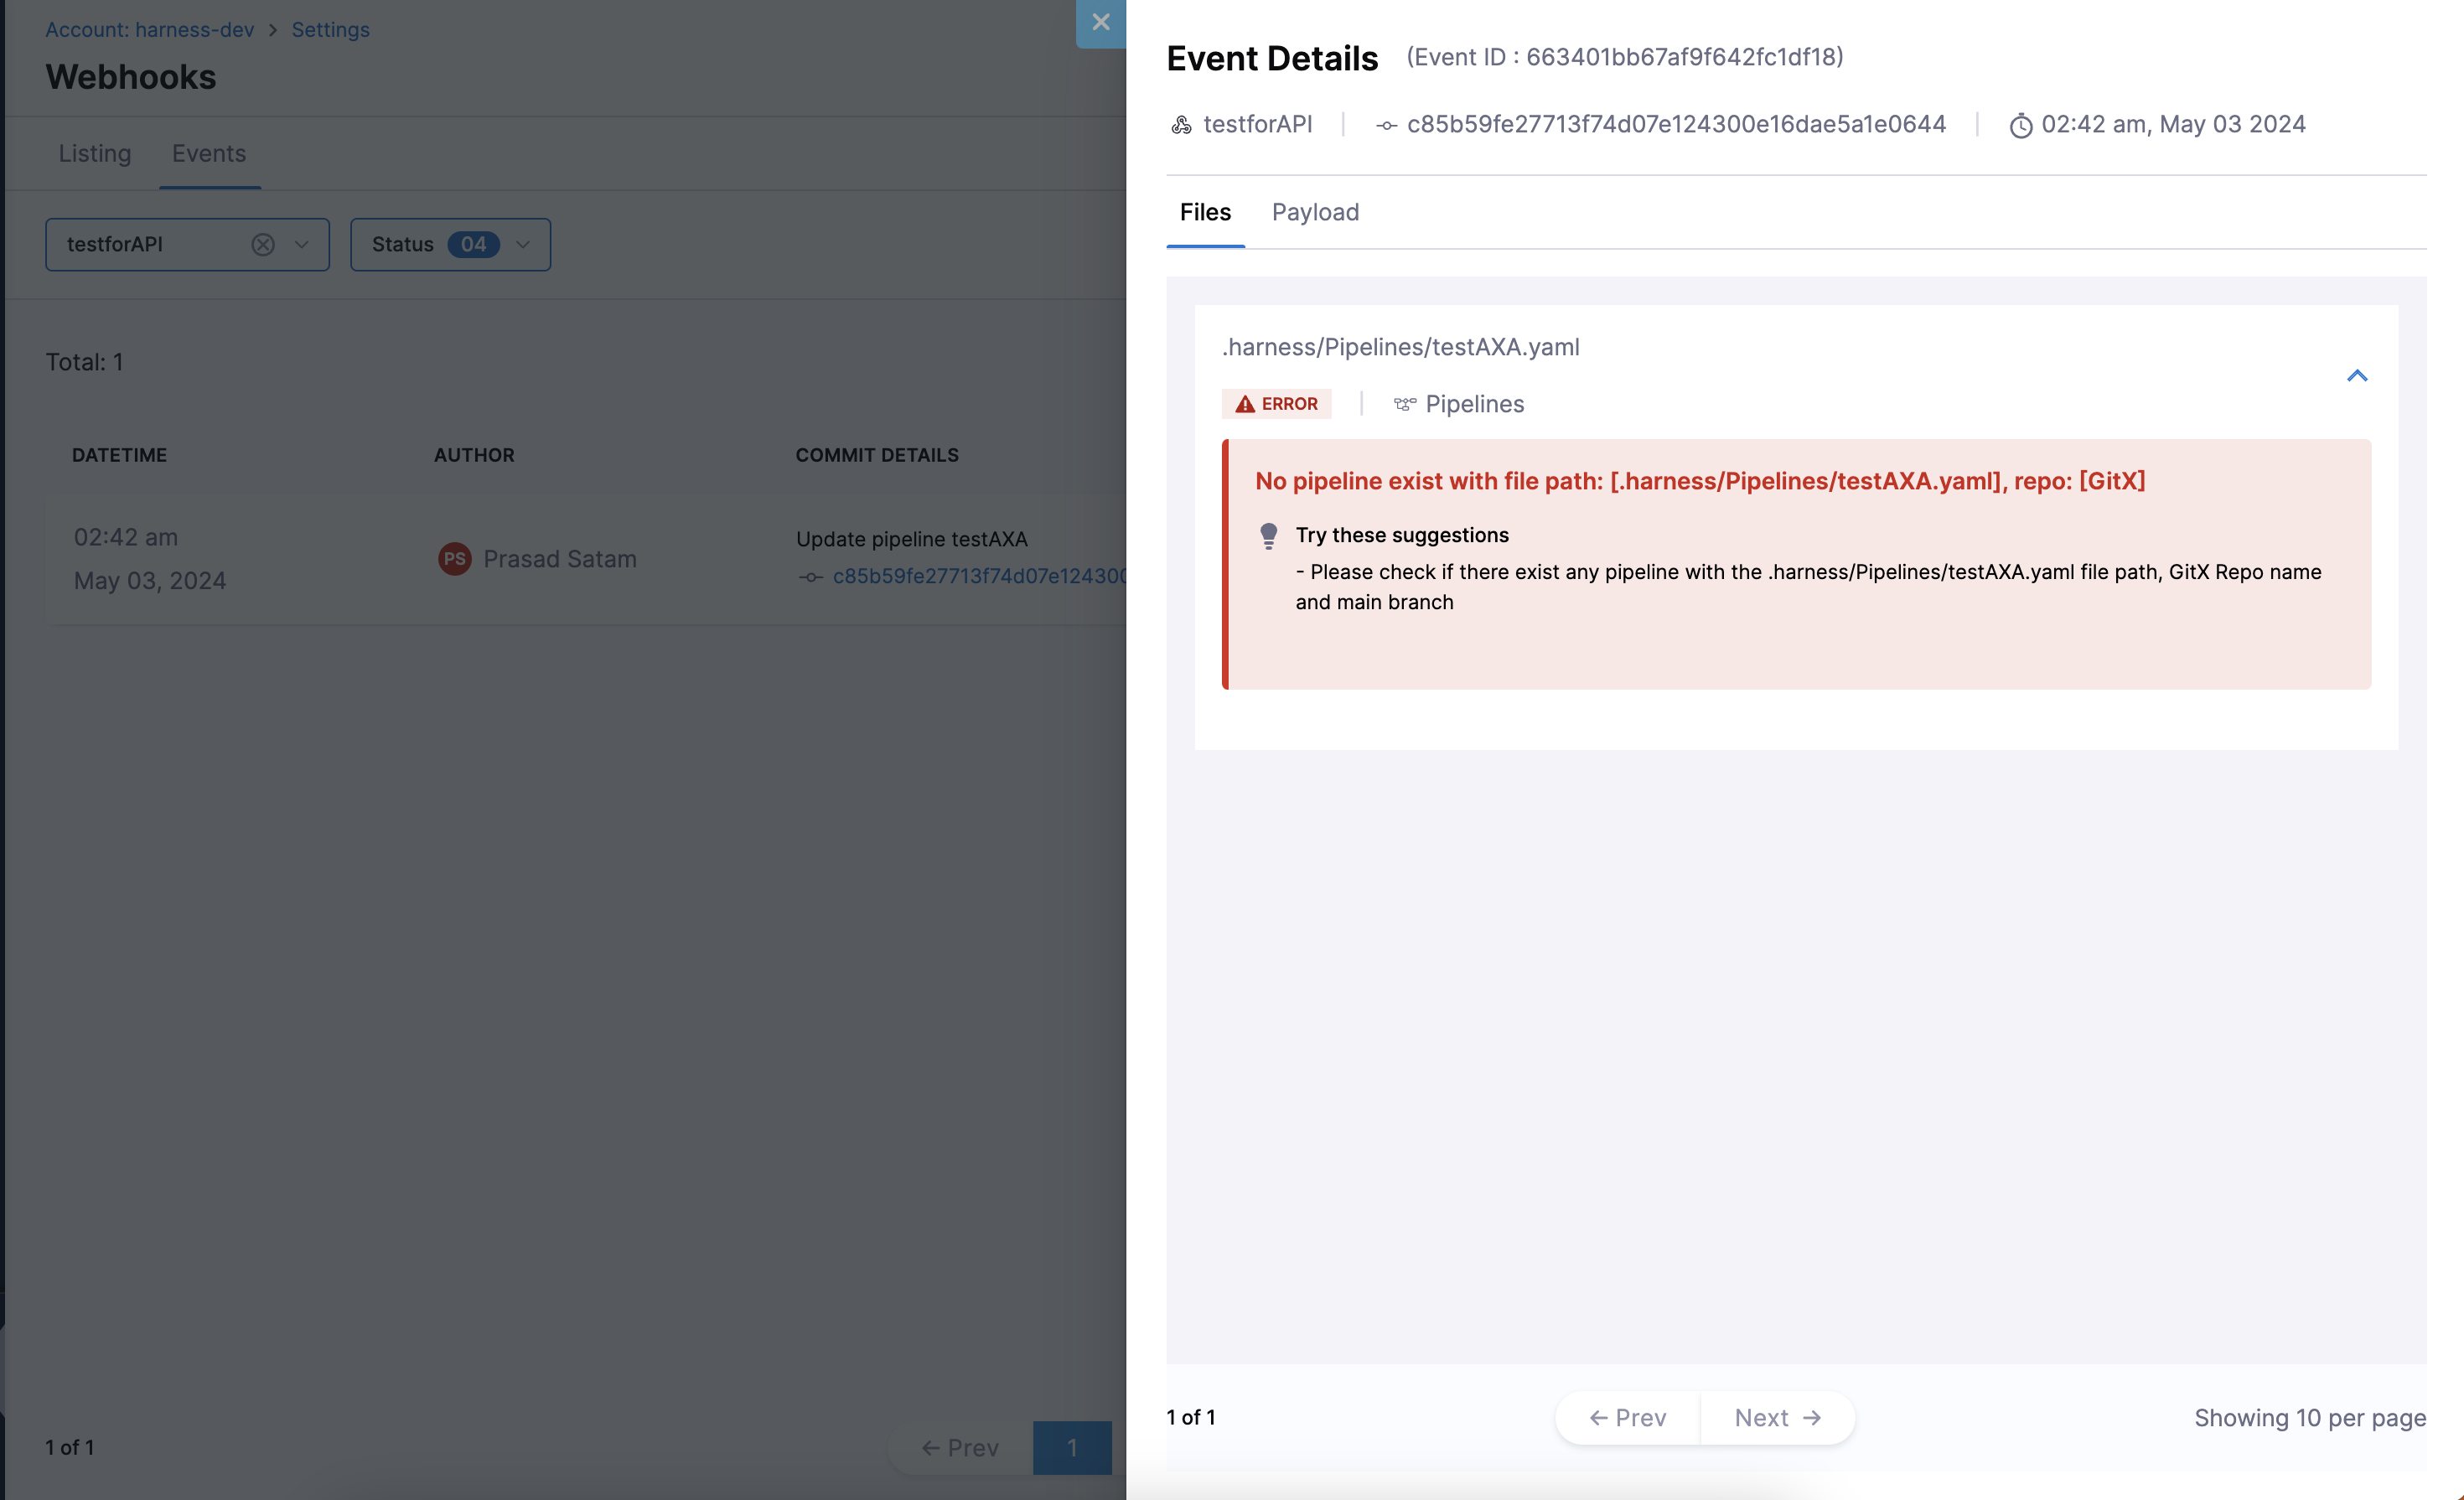
Under the Files section, you see the file that was updated along with its commit details. Harness validates all file changes. If there are any errors or warnings, Harness marks the status as Failed or Warning and provides the details of the error.
The following example shows a warning that no pipeline exists with the file path
.harness/Pipelines/textAXA.yaml:
- Under the Payload section, you can view the webhook payload that was sent.
-
Harness retains webhook event history for the last 15 days only. Events older than 15 days are automatically purged and cannot be retrieved. Plan any auditing or debugging activities within this retention window.
Next steps
- Set up bi-directional sync: Configure webhooks so Harness stays in sync with changes made directly in Git.
- Git Experience overview: Understand how Harness manages entities as code in your Git repositories.