> For the complete documentation index, see [llms.txt](https://developer.harness.io/llms.txt). Markdown versions of documentation pages are available by appending `.md` to page URLs; this page is available as [Markdown](https://developer.harness.io/artifact-registry/use-artifact-registry/manage-artifacts/audit-dashboard.md).
# Artifact Registry audit dashboard
Use the out-of-the-box Artifact Registry Audit Dashboard in Harness Dashboards to track artifact upload and download activity by user, IP, registry, package, and version.
The **Artifact Registry Audit Dashboard** is an out-of-the-box dashboard in Harness Dashboards that records every artifact **upload** and **download** across your Harness Artifact Registries. It is provisioned and maintained by Harness, so it appears automatically for every account that has Artifact Registry enabled. You do not create, build, or edit this dashboard.
The dashboard is intended for security, compliance, and incident-response workflows. Common use cases:
* Identify which users or service accounts pulled a specific package version after a CVE or zero-day disclosure.
* Audit upload activity on a registry over a time window for compliance reviews.
* Compare upload-versus-download activity across registries and projects.
{% hint style="info" %}
**AUDIT TRAIL VS. AUDIT DASHBOARD**
The Harness platform [Audit Trail](/harness-ai/use-harness-platform/governance/audit-trail/audit-trail.md) records create, update, and delete operations on registries and is the right tool for admin-level changes. The Artifact Registry Audit Dashboard covers only **upload** and **download** events on artifacts, which the platform Audit Trail does not store.
{% endhint %}
### Prerequisites
* A Harness account with Artifact Registry enabled and at least one registry that has received upload or download traffic.
* Access to **Harness Dashboards** in the same account.
#### Open the dashboard
1. In the left navigation, go to **Dashboards**.
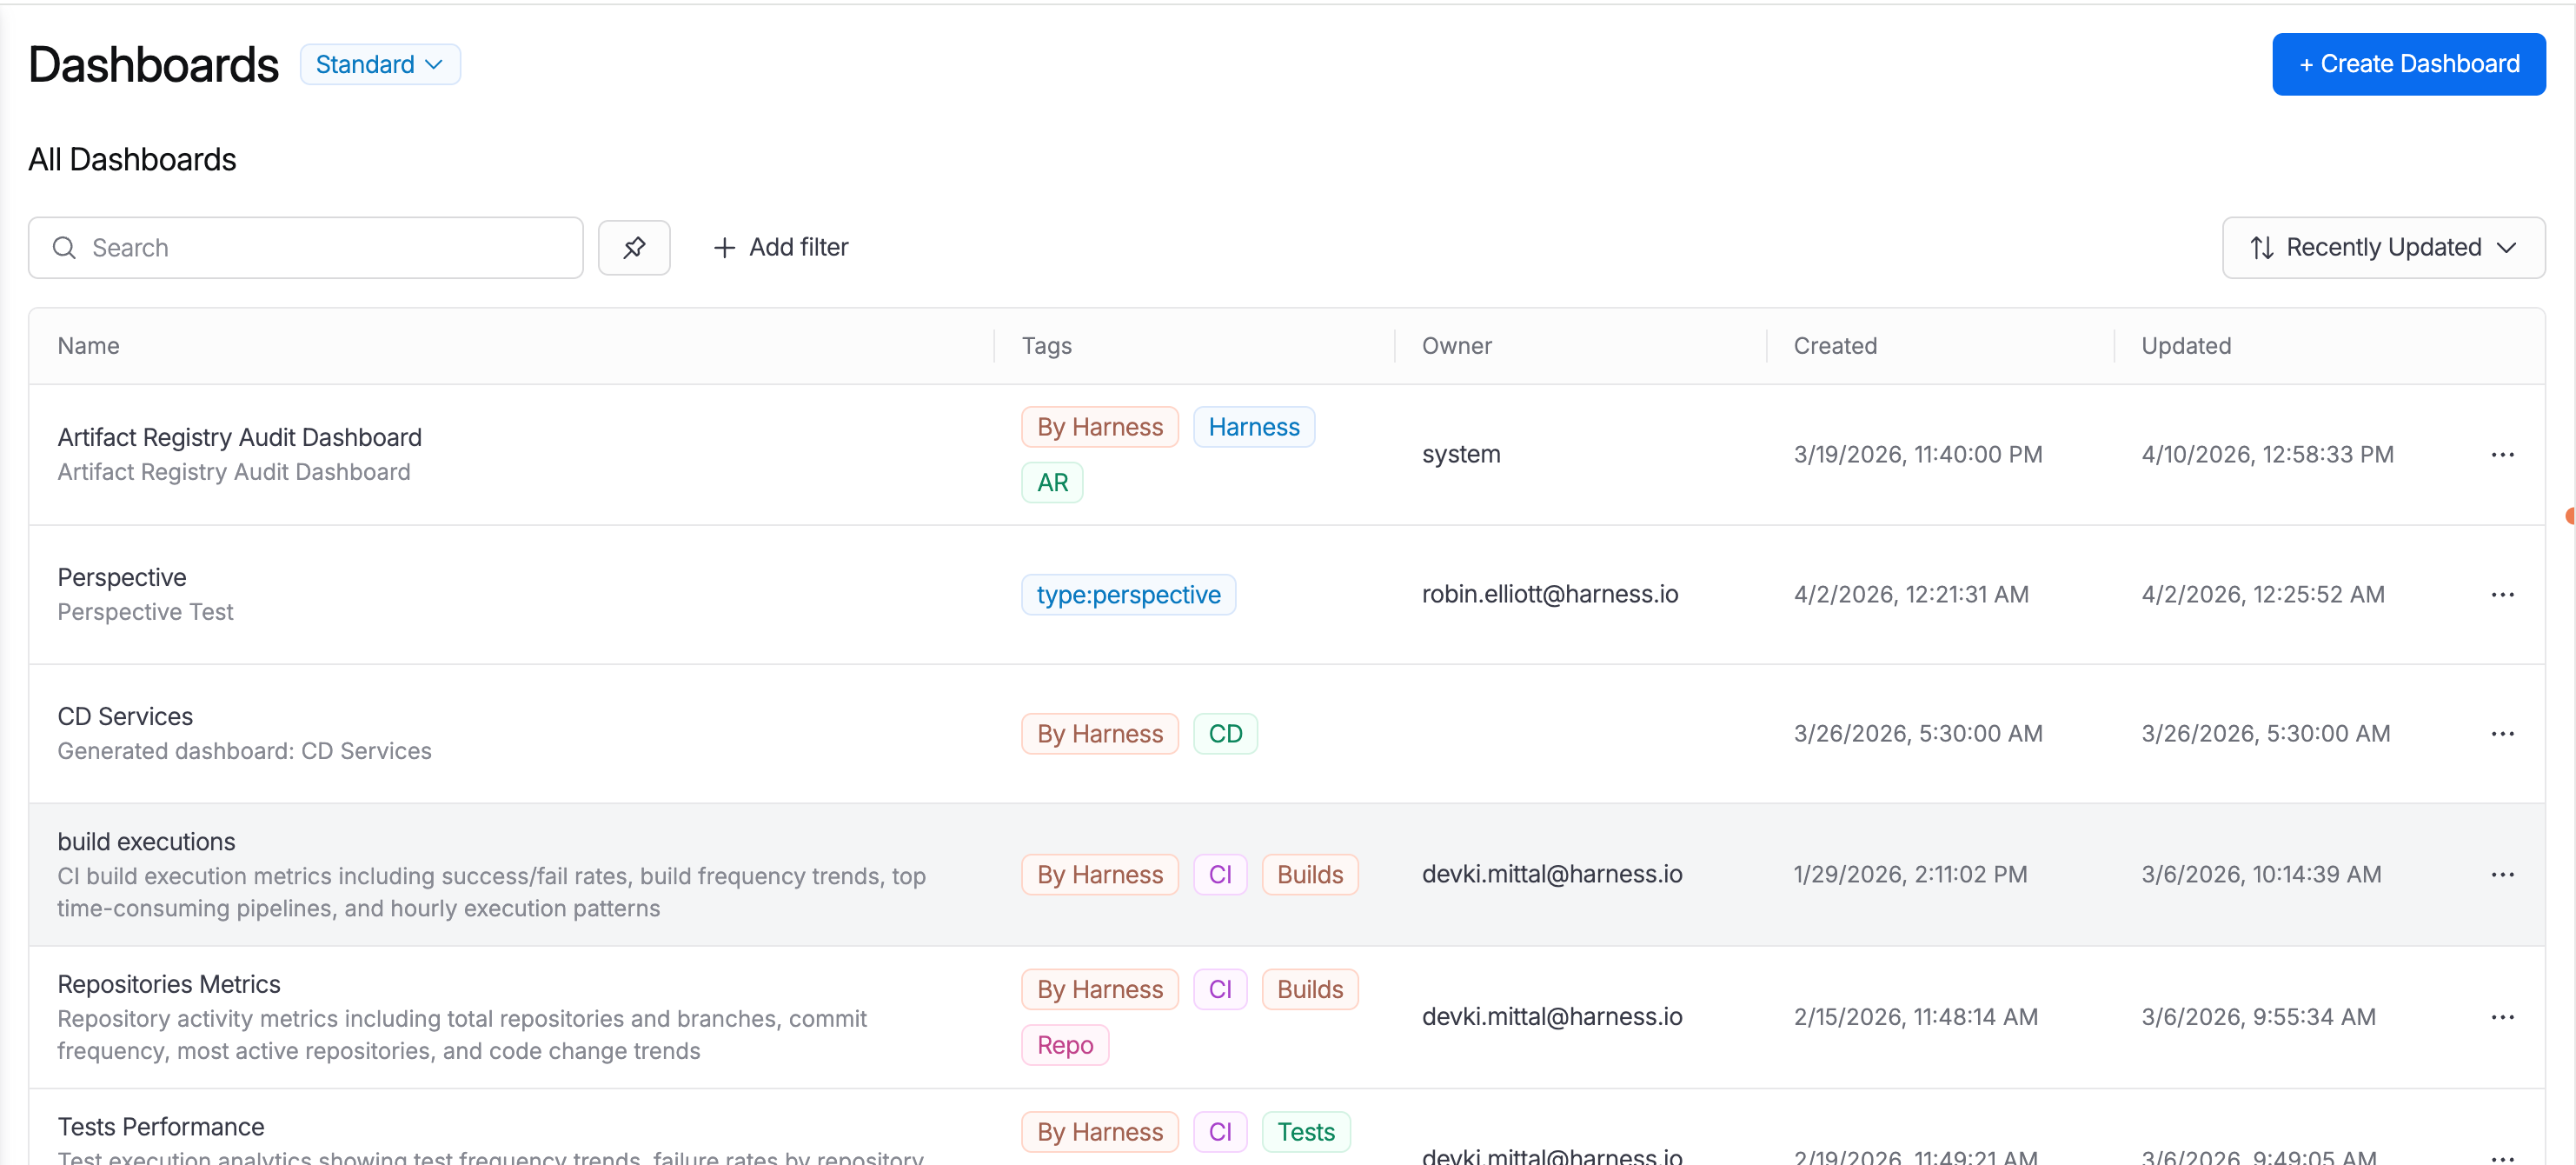
2. In the top-left mode toggle, make sure you are in **Standard** mode. New accounts open in **Legacy** mode by default, and the Artifact Registry Audit Dashboard is only listed in Standard mode.
3. In the **All Dashboards** list, look for **Artifact Registry Audit Dashboard**. It is owned by `system` and tagged **By Harness**, **Harness**, and **AR**.
Artifact Registry Audit Dashboard in the Dashboards list
4. Click the dashboard name to open it.
#### What the dashboard shows
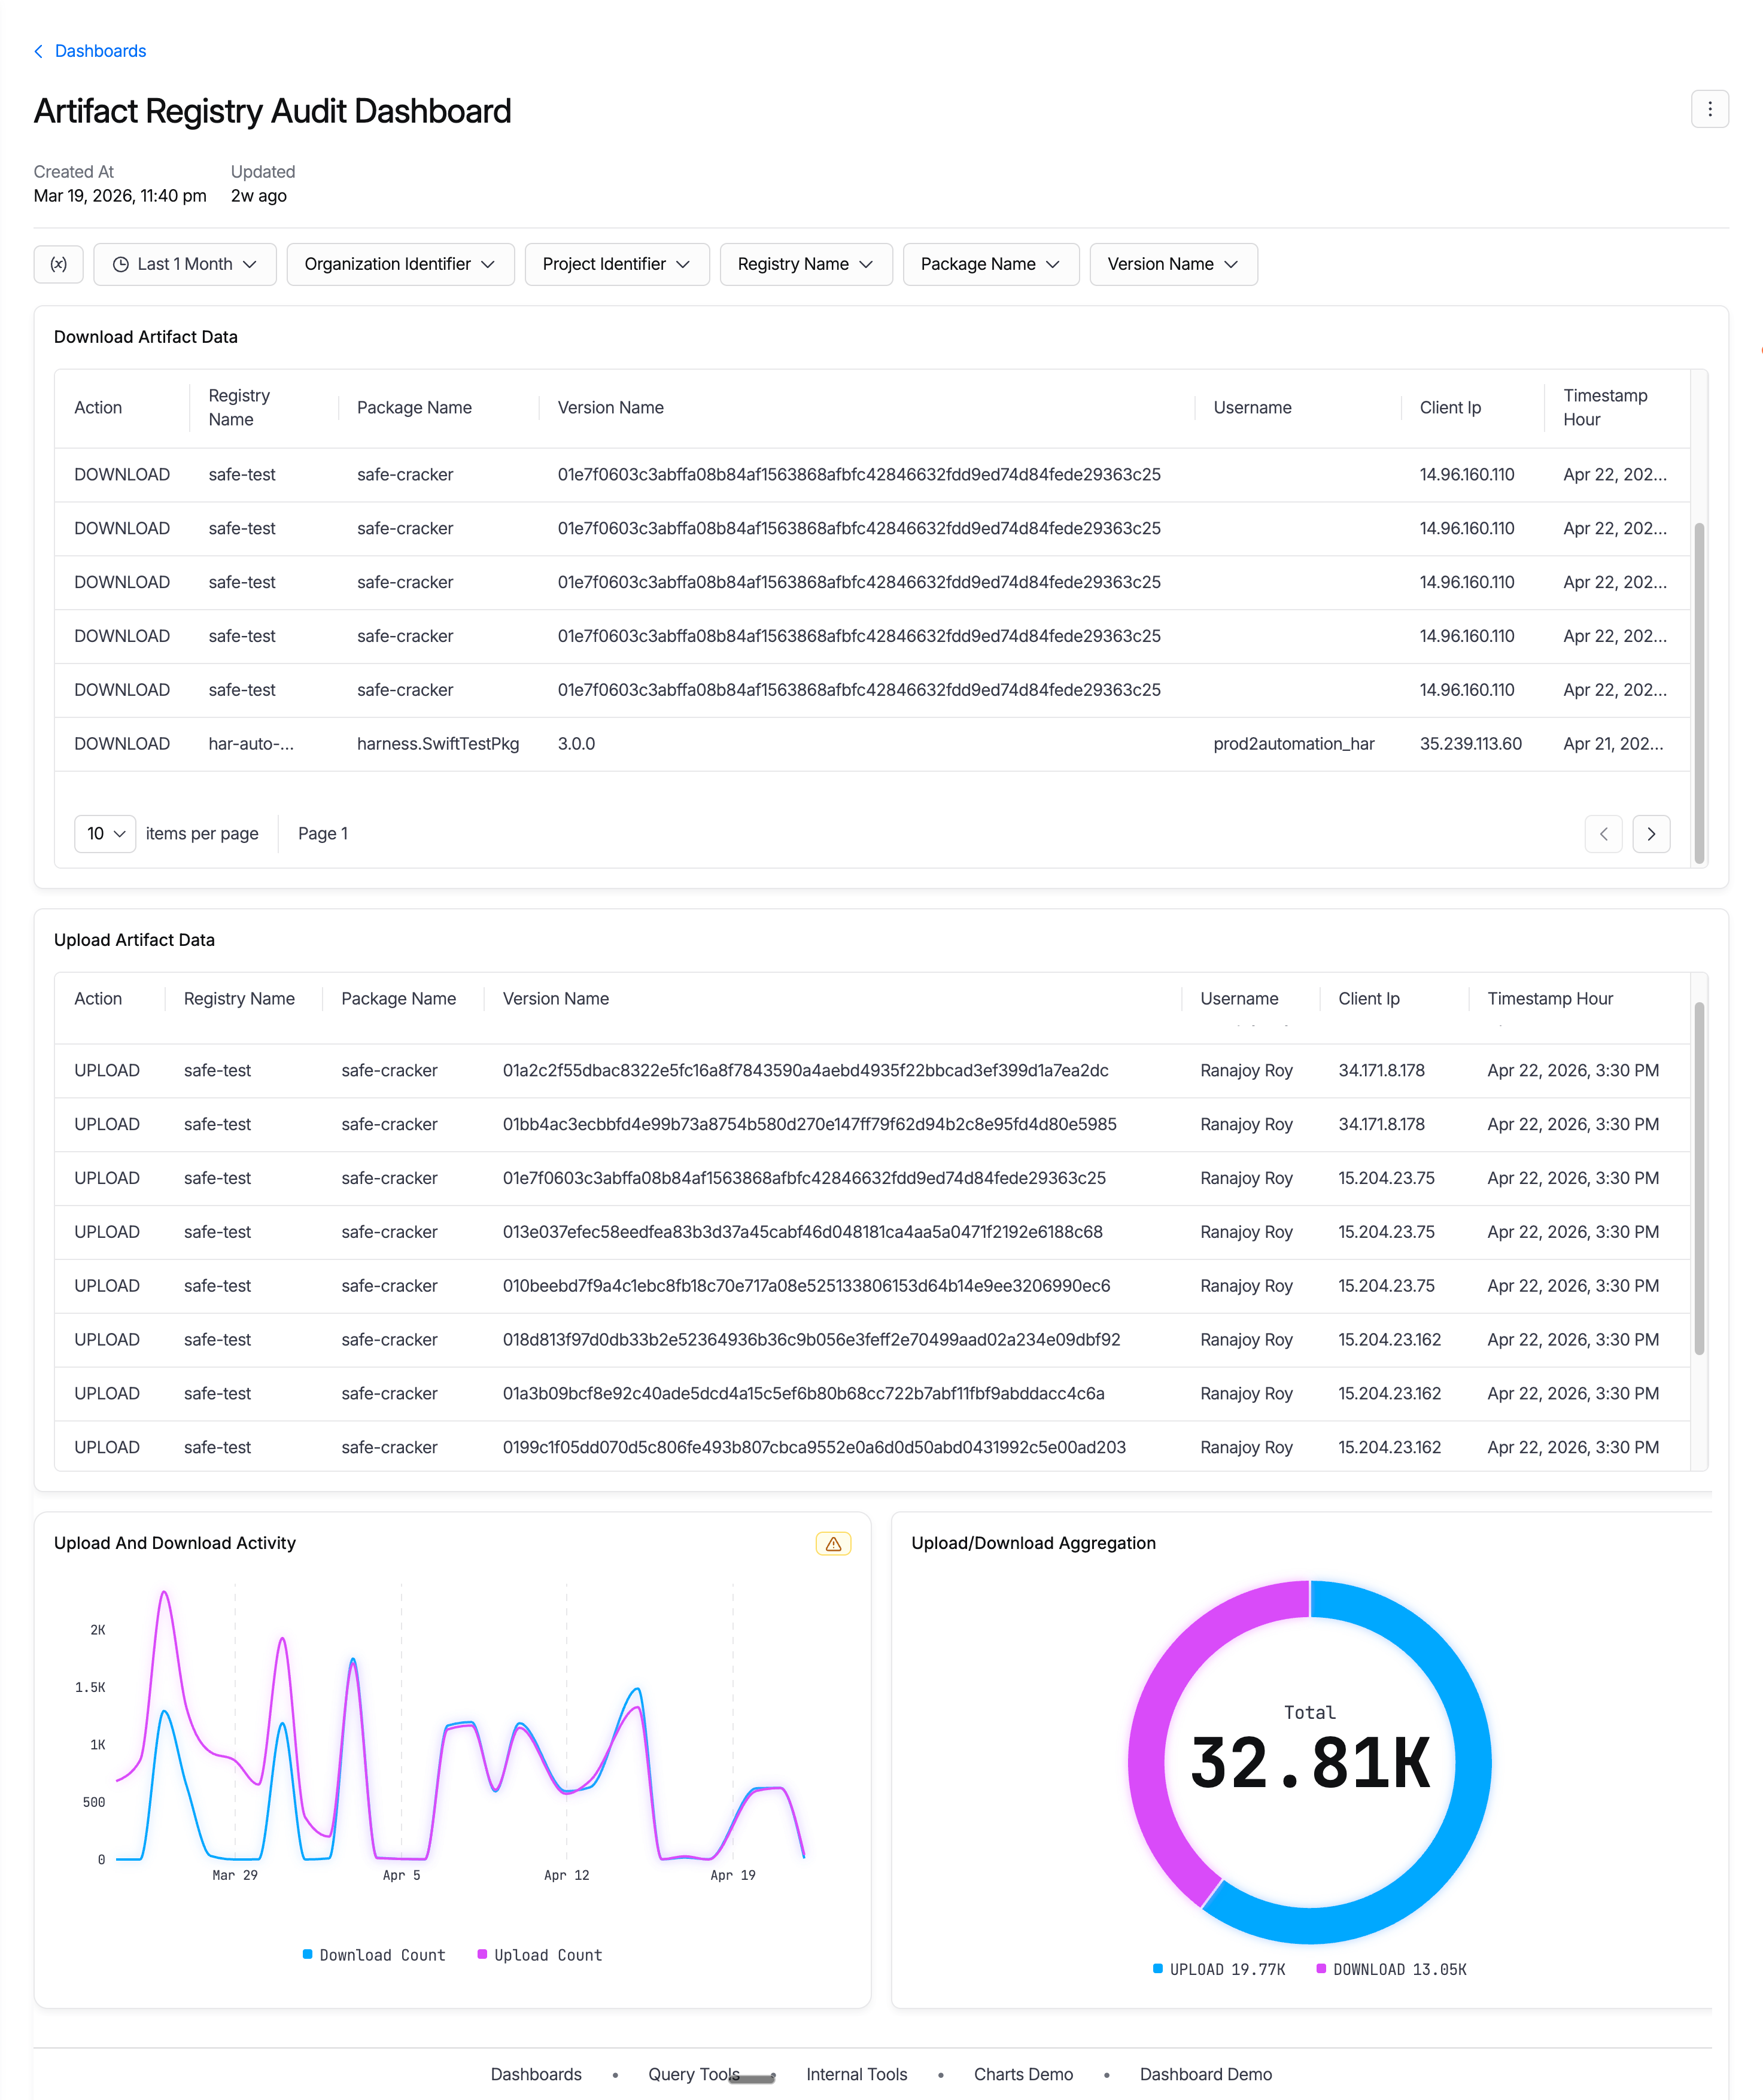
The dashboard opens with a **Time Range** selector (defaulted to **Last 1 Month**) and five identifier filters: **Organization Identifier**, **Project Identifier**, **Registry Name**, **Package Name**, and **Version Name**. Every widget on the page reacts to these filters.
Artifact Registry Audit Dashboard
Four widgets make up the page:
| Widget | What it shows | Use it to |
| -------------------------------- | ------------------------------------------------------------------------------------------------------------------------------------------ | ----------------------------------------------------------------------------------------------------------- |
| **Download Artifact Data** | A paginated table of recent `DOWNLOAD` events: Action, Registry Name, Package Name, Version Name, Username, Client IP, and Timestamp Hour. | Trace exactly who downloaded a specific package version, and from which IP, during the selected time range. |
| **Upload Artifact Data** | A paginated table of recent `UPLOAD` events with the same columns as the download table. | Audit which users or service accounts pushed artifacts into a registry. |
| **Upload And Download Activity** | A daily time-series line chart with two series: download count and upload count. | Spot spikes, drops, or unusual patterns in artifact traffic over the selected window. |
| **Upload/Download Aggregation** | A donut chart showing the total upload-versus-download split (with absolute counts) for the filtered range. | Get the overall mix of activity at a glance for the selected scope. |
**Identify who downloaded a package version**
A typical zero-day workflow:
1. Set the **Time Range** to cover the period of concern (for example, **Last 1 Month**).
2. Set **Registry Name** to the registry that recorded the event. This is the registry's literal name .
3. Set **Package Name** to the package or image name.
4. Optionally set **Version Name** to narrow to the specific affected version.
5. Read the **Download Artifact Data** table. Each row shows the **Username**, **Client IP**, and **Timestamp Hour** of the pull.
**Audit uploads to a registry**
Use the same filter approach but read the **Upload Artifact Data** table. Each row shows the principal that pushed the artifact, the source IP, and when the upload occurred. For client-token pushes, the **Username** is the principal that issued the token.
### Next steps
* [Artifact Registry overview](/artifact-registry/new-to-artifact-registry/overview.md)
* [Harness platform Audit Trail](/harness-ai/use-harness-platform/governance/audit-trail/audit-trail.md)
* [Harness Dashboards overview](/harness-ai/use-harness-platform/harness-dashboards/dashboard-legacy/dashboards-overview.md)
{% @harness-feedback/feedback %}