> For the complete documentation index, see [llms.txt](https://developer.harness.io/llms.txt). Markdown versions of documentation pages are available by appending `.md` to page URLs; this page is available as [Markdown](https://developer.harness.io/cloud-cost-management/3.0/cost-optimization/cluster-orchestrator-for-aws-eks-clusters/post-enablement.md).
# Cluster Orchestrator Dashboard
Learn how to interpret Cluster Orchestrator dashboards and metrics
After successfully setting up Cluster Orchestrator, you gain access to monitoring screens and dashboards that provide real-time insights into your cluster's performance, cost, and optimization opportunities. These dashboards are designed to help you track the effectiveness of your optimization settings and make data-driven decisions about your infrastructure.
Cluster Orchestrator provides different specialized views, each focusing on different aspects of your cluster:
## Overview
Overview
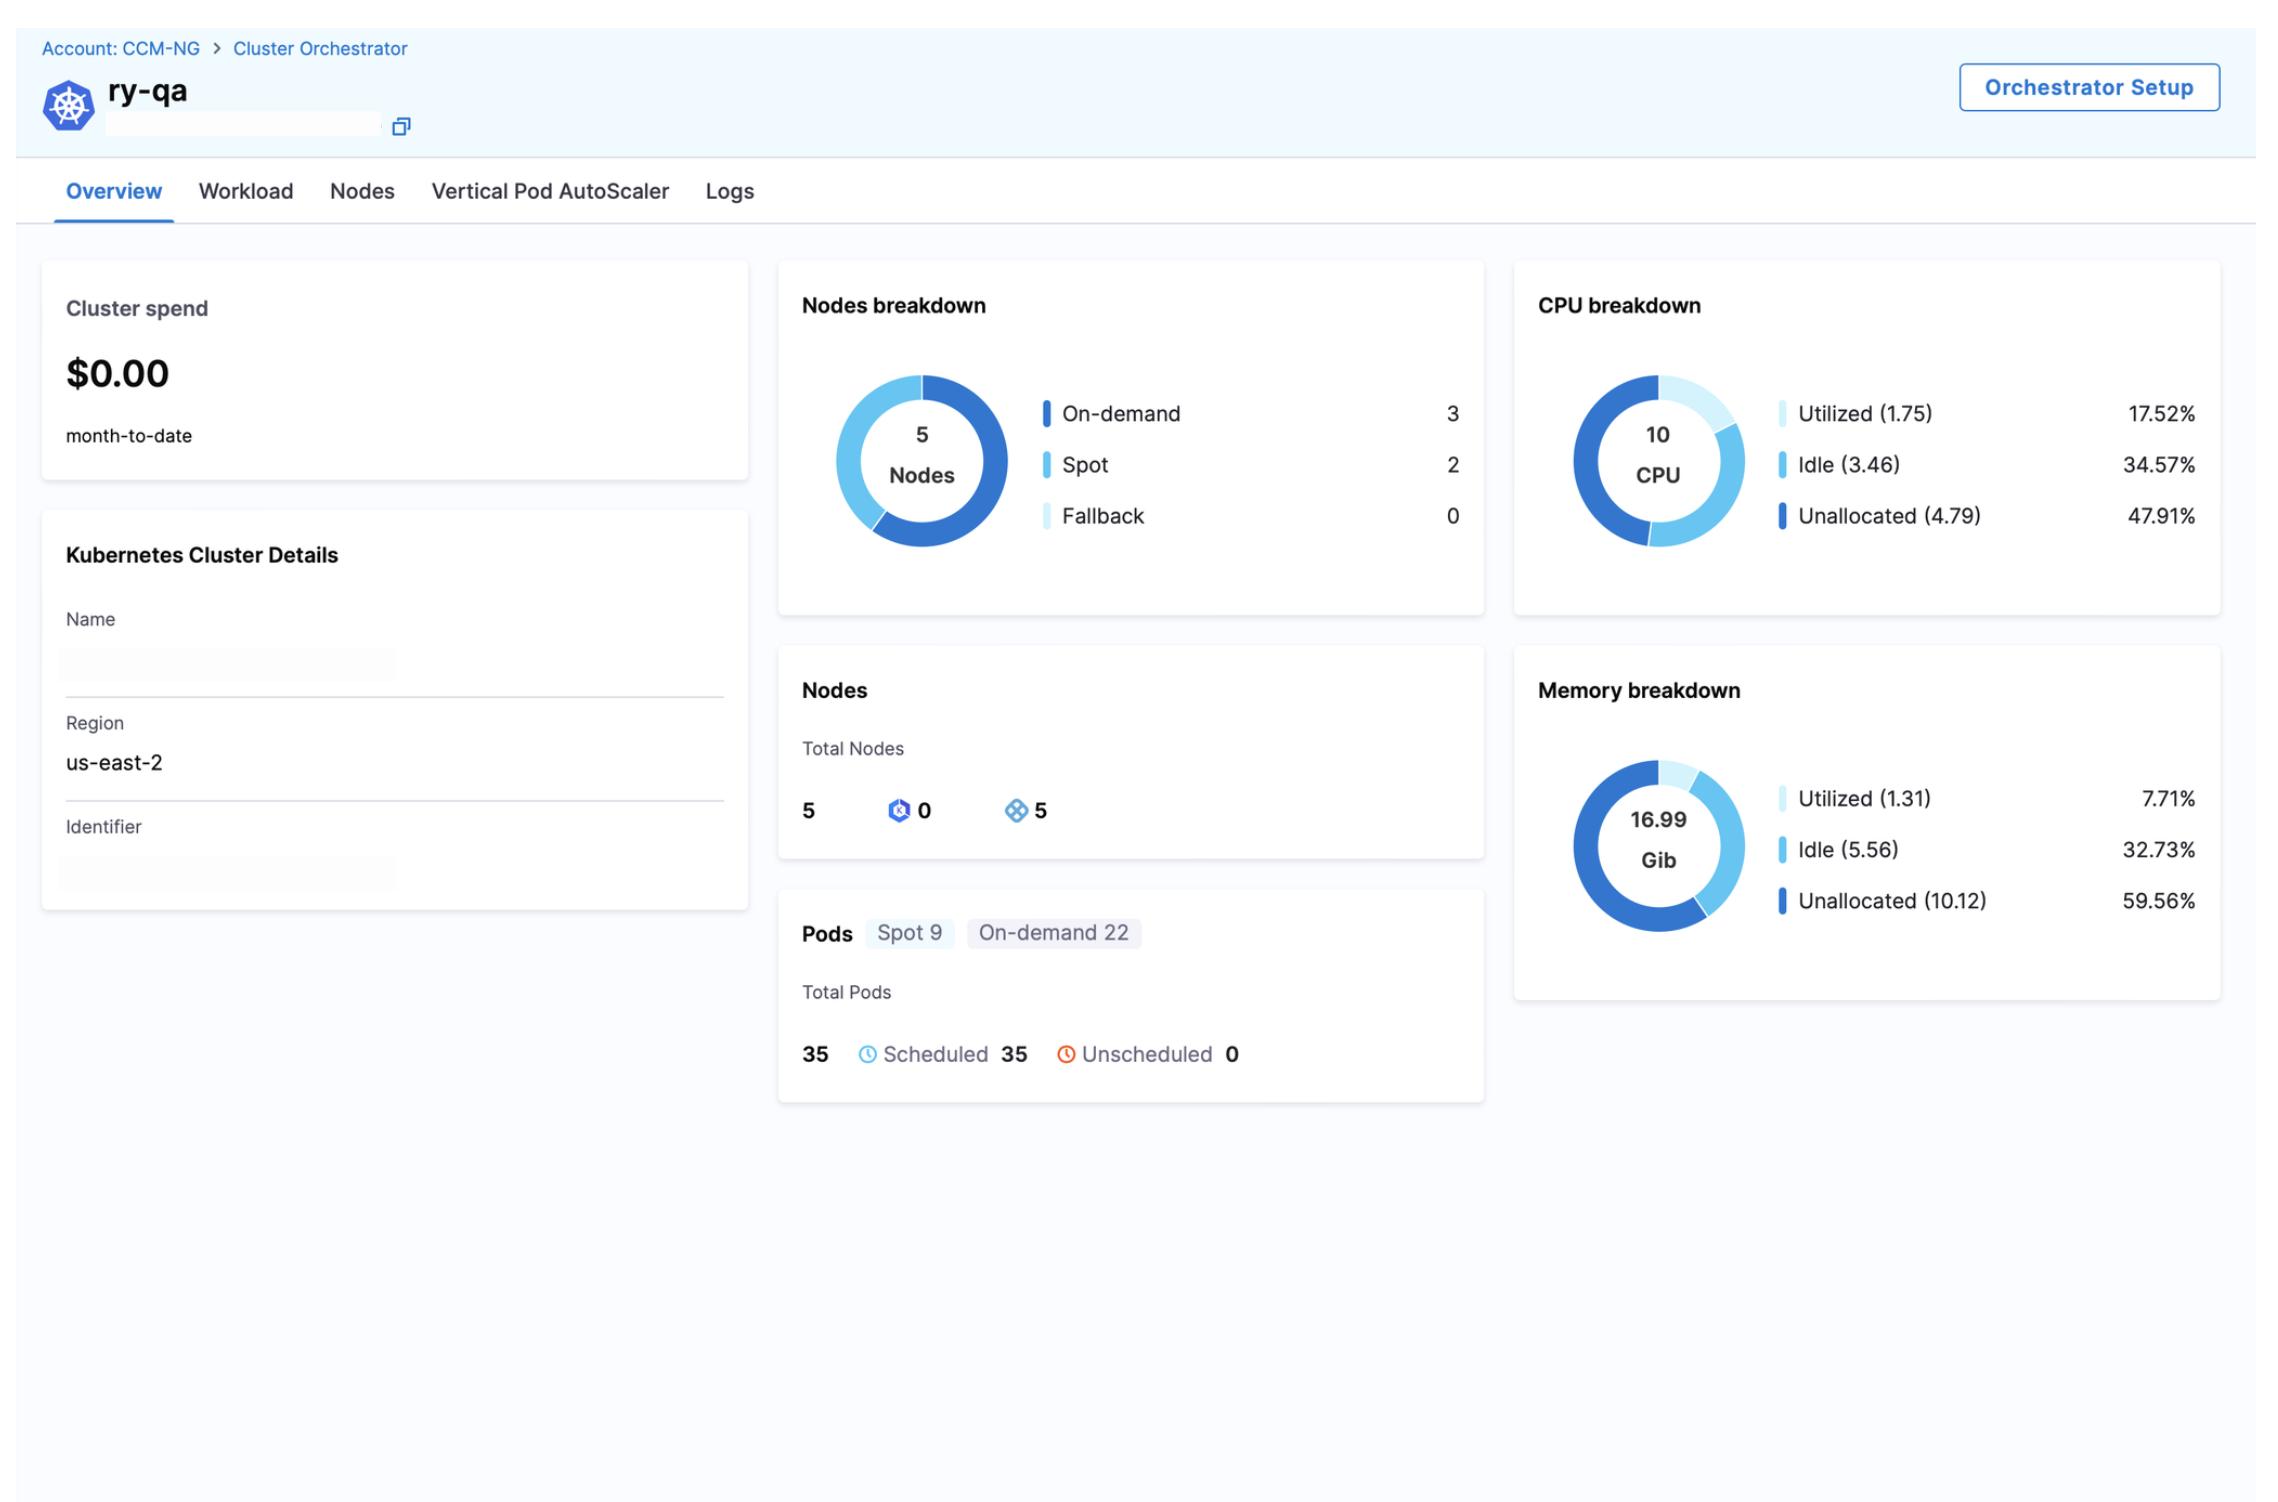
This is your central page for monitoring overall cluster health, performance, and cost metrics. The dashboard is divided into several key sections:
* **Cluster Spend**: Track your total cluster costs over time, with breakdowns by instance type and spot vs. on-demand usage
* **Cluster Details**: View essential information about your cluster including name, region, and identifier.
* **Nodes Breakdown**: Visualize your node distribution by fulfillment method (spot vs. on-demand)
* **CPU Breakdown**: Track CPU allocation, usage, and available capacity across your cluster
* **Memory Breakdown**: Monitor memory allocation, usage, and available capacity
* **Pod Distribution**: See how many pods are there as spot, on-demand scheduled and unsecheduled
***
## Workloads screen
Overview
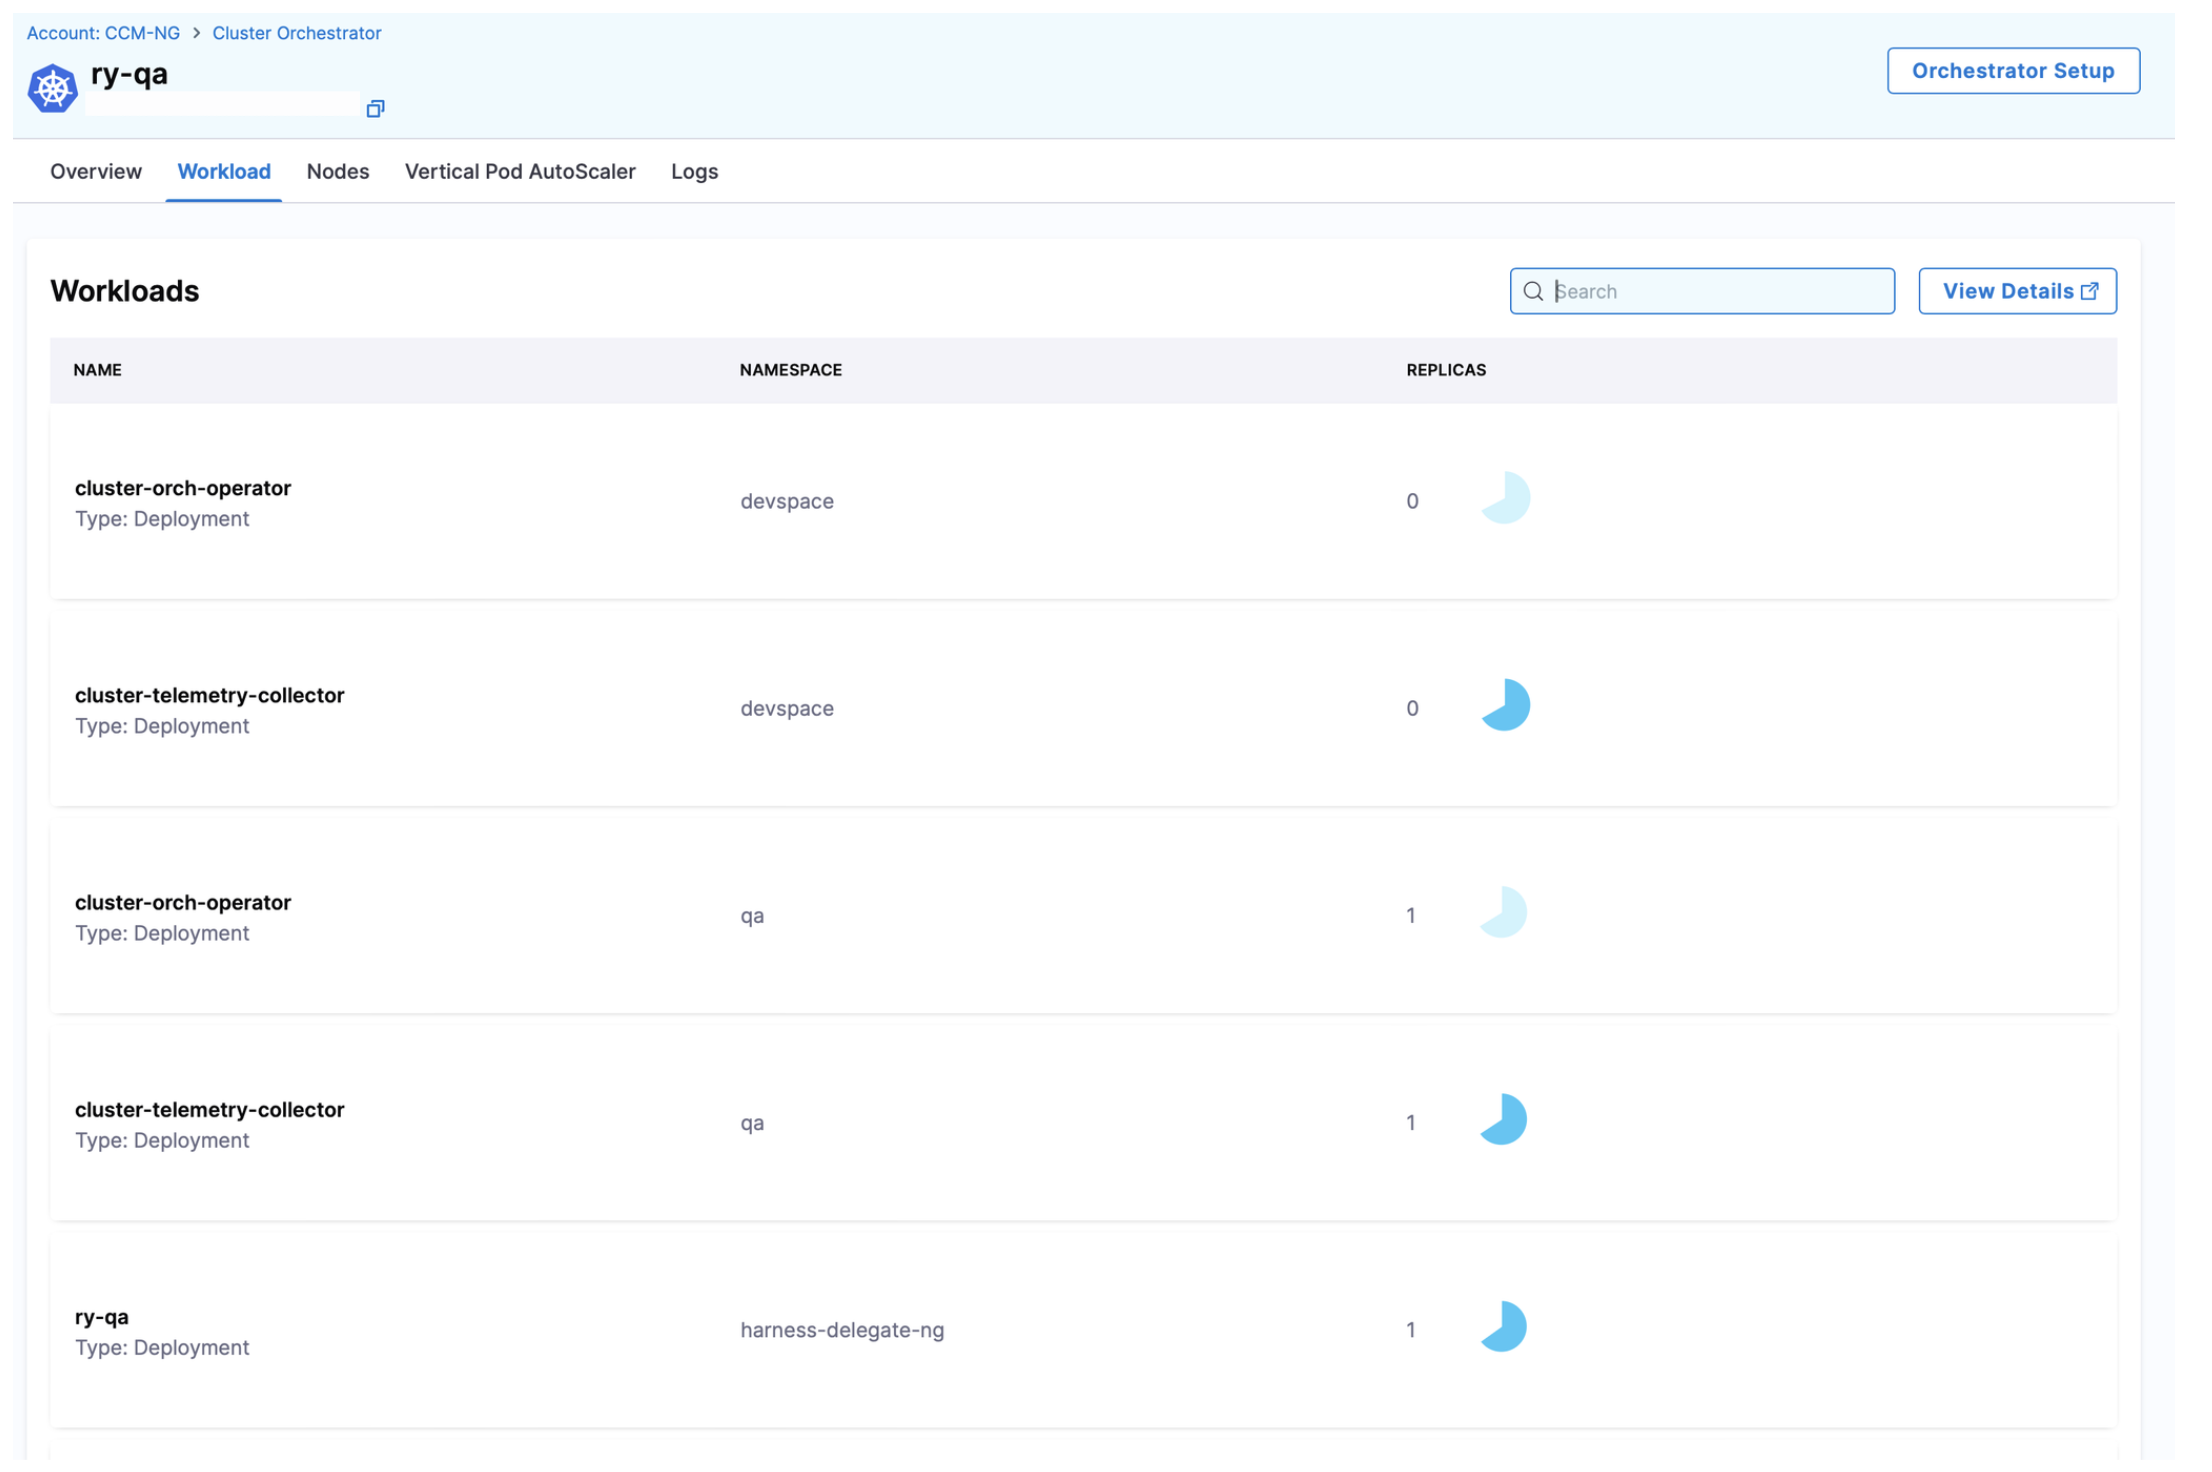
This view focuses on the applications running in your cluster, helping you identify optimization opportunities at the workload level:
* **Namespace Organization**: View workloads grouped by namespace for logical organization
* **Replica Count**: Track the number of replicas for each workload
***
## Nodes screen
Overview
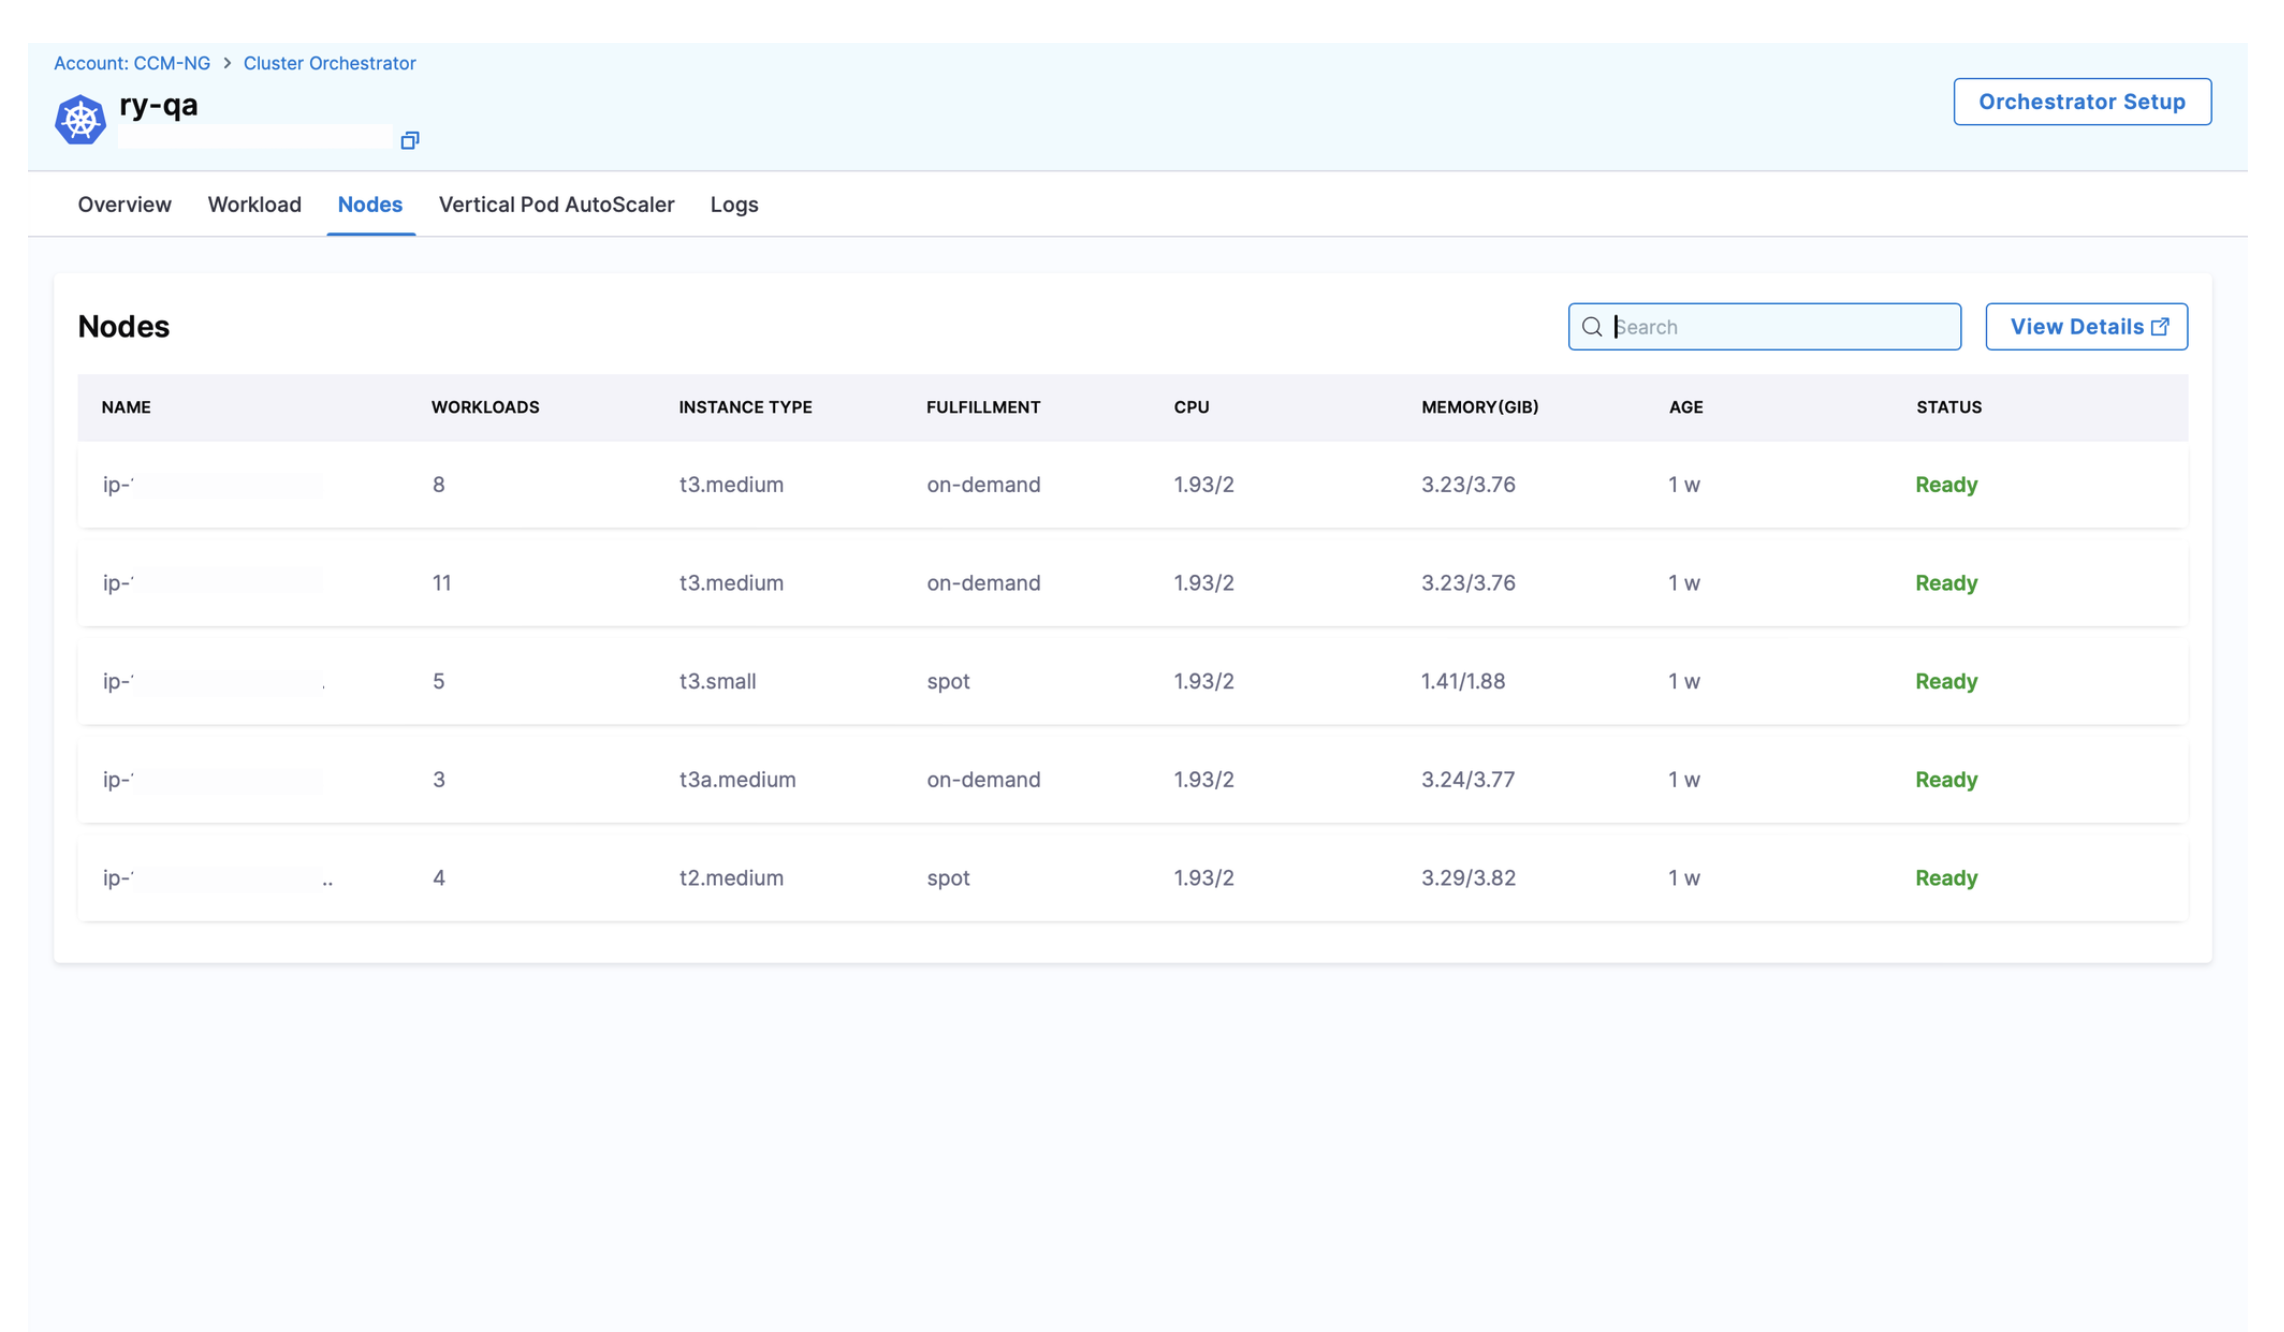
This view provides insights into your cluster's infrastructure. The table displays the following information for each node:
| Column | Description |
| ----------------- | ----------------------------------------------------------- |
| **Node Name** | The full hostname of the node |
| **Workloads** | Number of workloads running on the node (e.g., 11) |
| **Instance Type** | The AWS instance type (e.g., m5.2xlarge) |
| **Fulfillment** | Whether the node is running as spot or on-demand |
| **CPU** | Current CPU usage and total capacity (e.g., 7.91/8) |
| **Memory (GiB)** | Current memory usage and total capacity (e.g., 29.92/30.89) |
| **Age** | How long the node has been running (e.g., 2h) |
| **Status** | Current node status (e.g., Ready or not ) |
***
## Vertical Pod Autoscaler (VPA)
The Vertical Pod Autoscaler (VPA) is a Kubernetes component that automatically adjusts CPU and memory resource requests for your pods based on their actual usage patterns. Unlike Horizontal Pod Autoscaler (HPA) which scales the number of pod replicas, VPA focuses on right-sizing the resource requests and limits of individual pods.
VPA
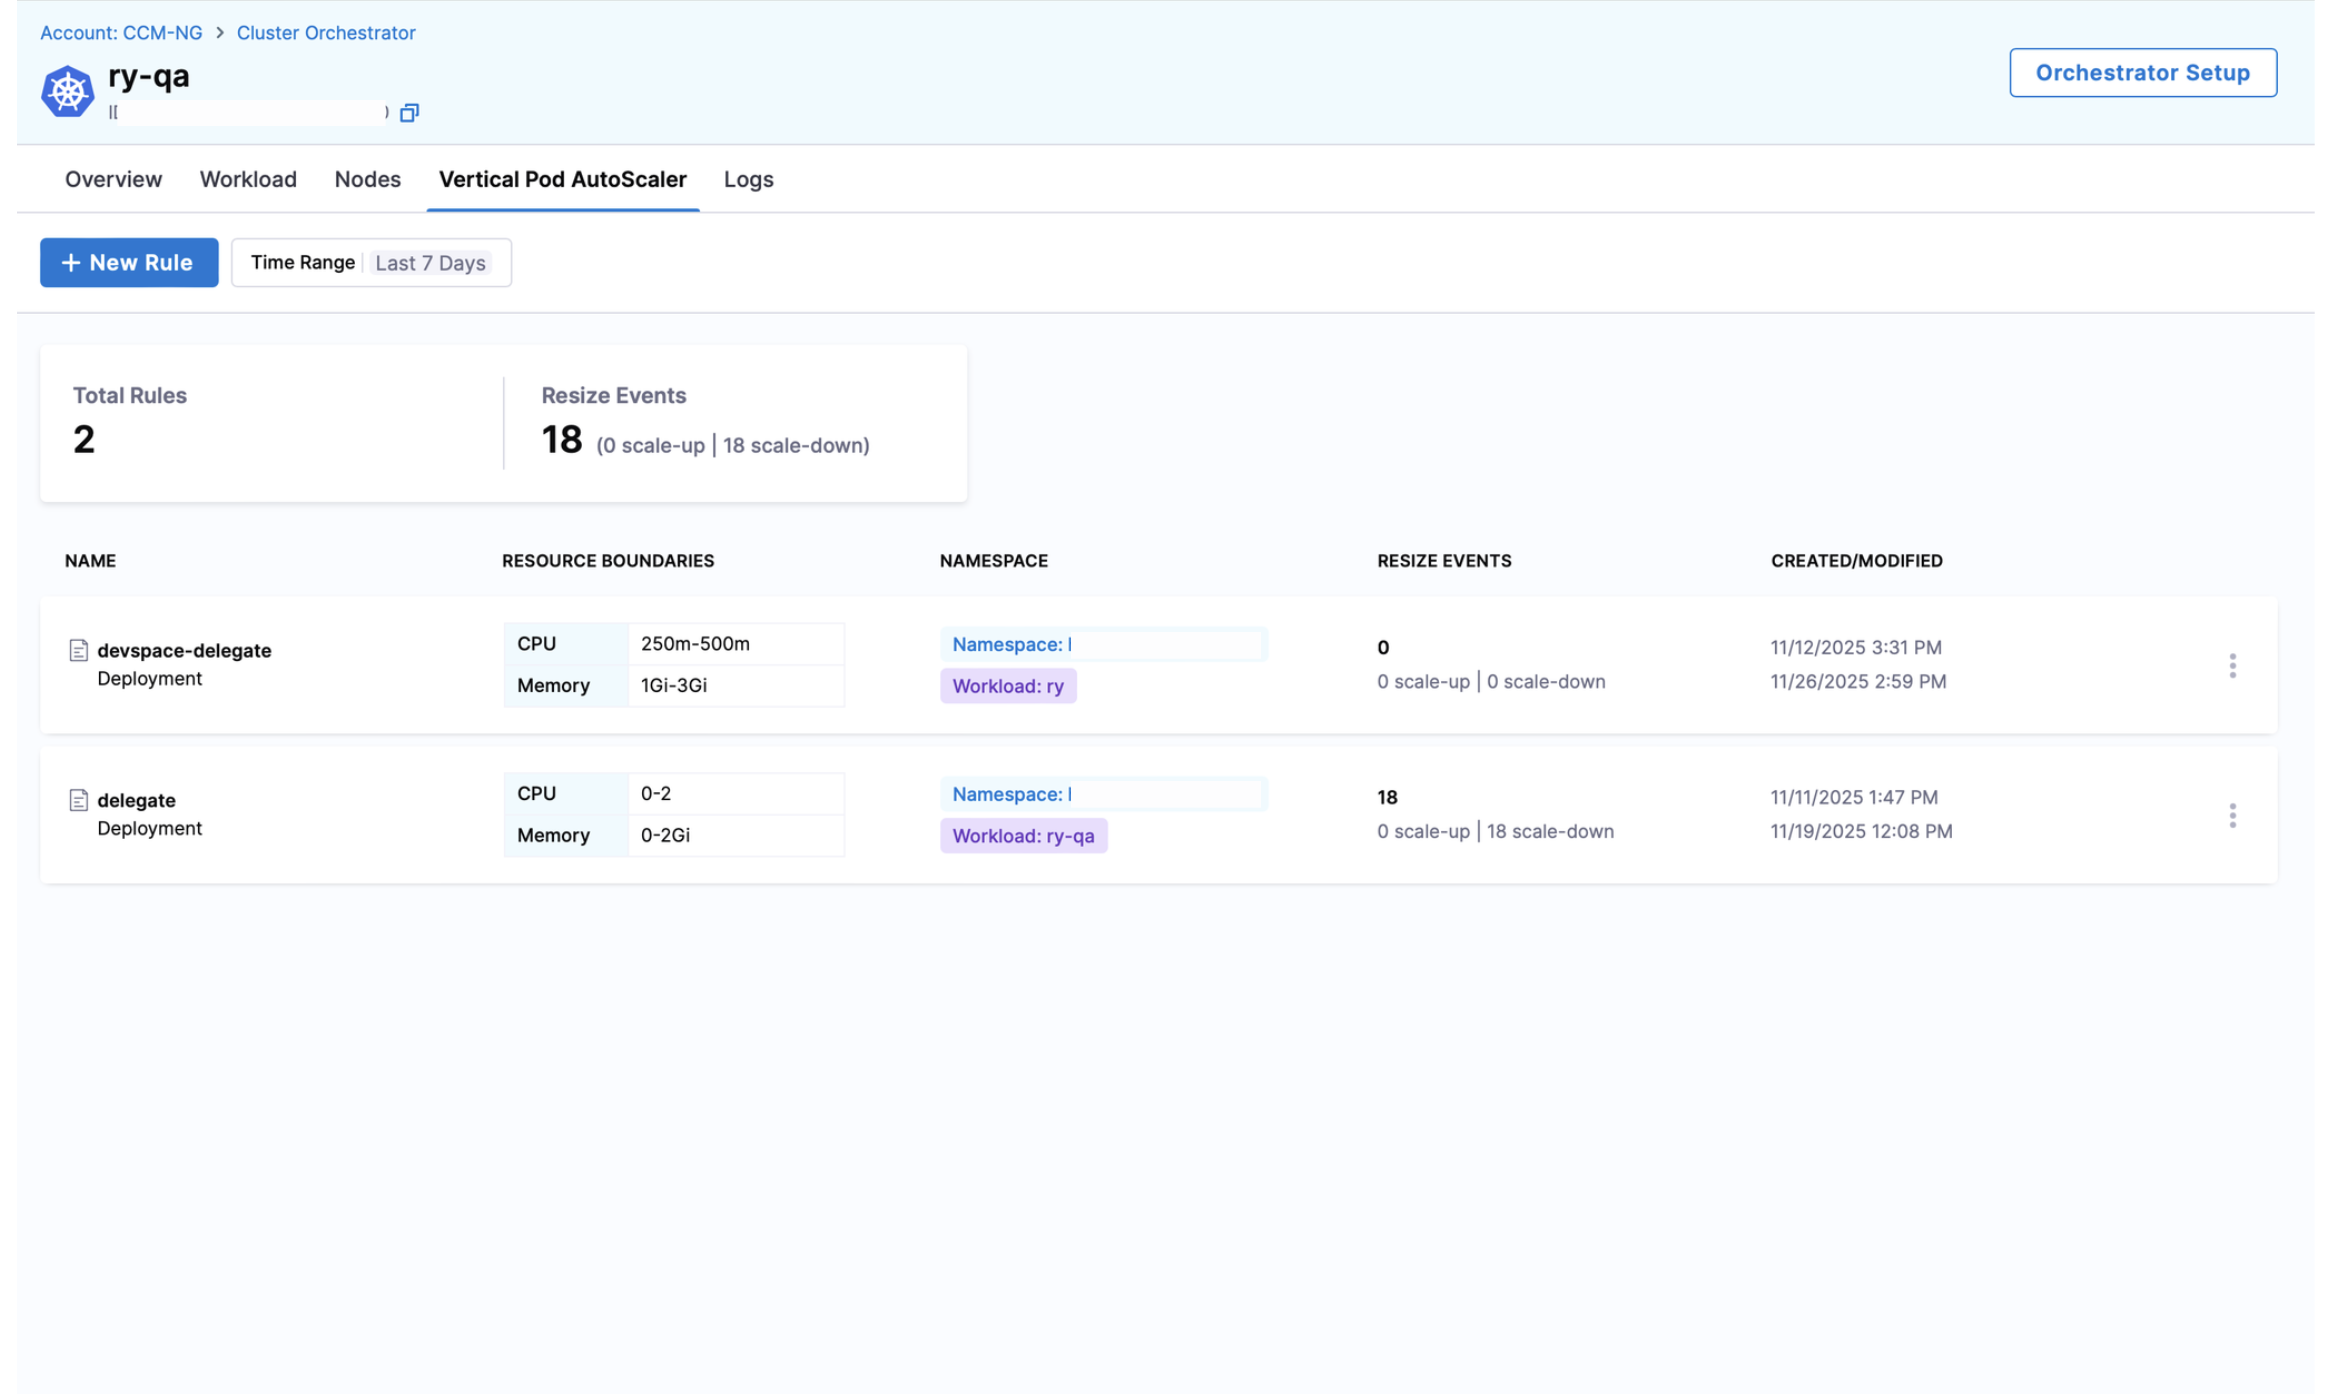
The VPA dashboard displays the following metrics at the top:
* **Time Range**: The period for which data is displayed (default: Last 7 Days)
* **Total Rules**: Number of active VPA rules in your cluster
* **Resize Events**: Total number of pod resize events triggered by VPA rules
Below the metrics, you'll find a table listing all your VPA rules with the following columns:
* **Name**: The name of the VPA rule
* **Resource Boundaries**: Min/max CPU and memory limits configured for the rule
* **Namespace**: Kubernetes namespace where the rule applies
* **Resize Events**: Number of resize events triggered by this specific rule
* **Created/Modified**: Timestamp when the rule was created or last modified
### Creating a New VPA Rule
VPA
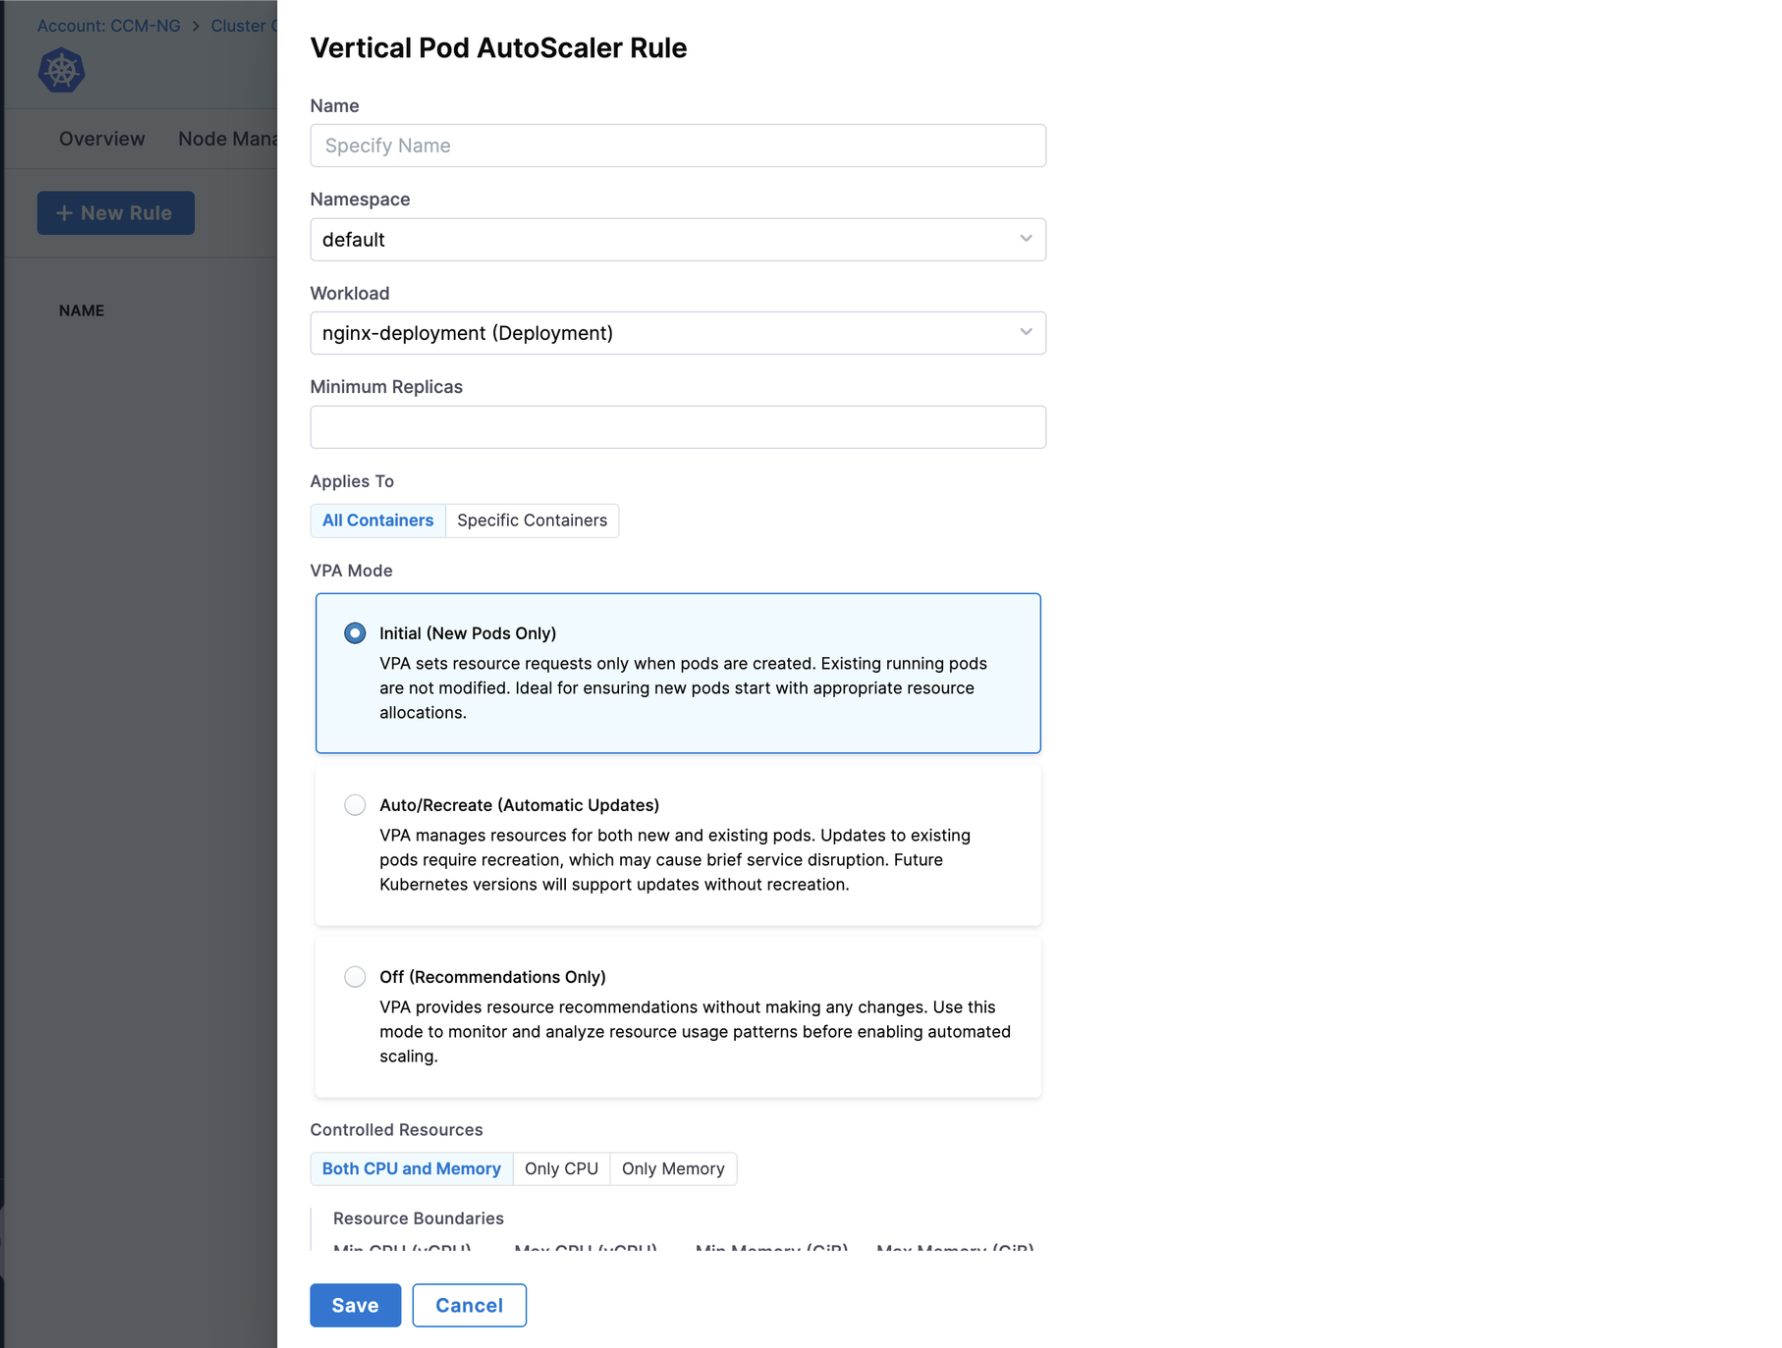
To create a new VPA rule, click the **+ New Rule** button and configure the following settings:
* **Name**: Enter a unique name for your VPA rule
* **Namespace**: Select the Kubernetes namespace where this rule will apply
* **Workload**: Choose the specific deployment, statefulset, or other workload to target
* **Minimum Replicas** (optional): Set the minimum number of replicas to maintain
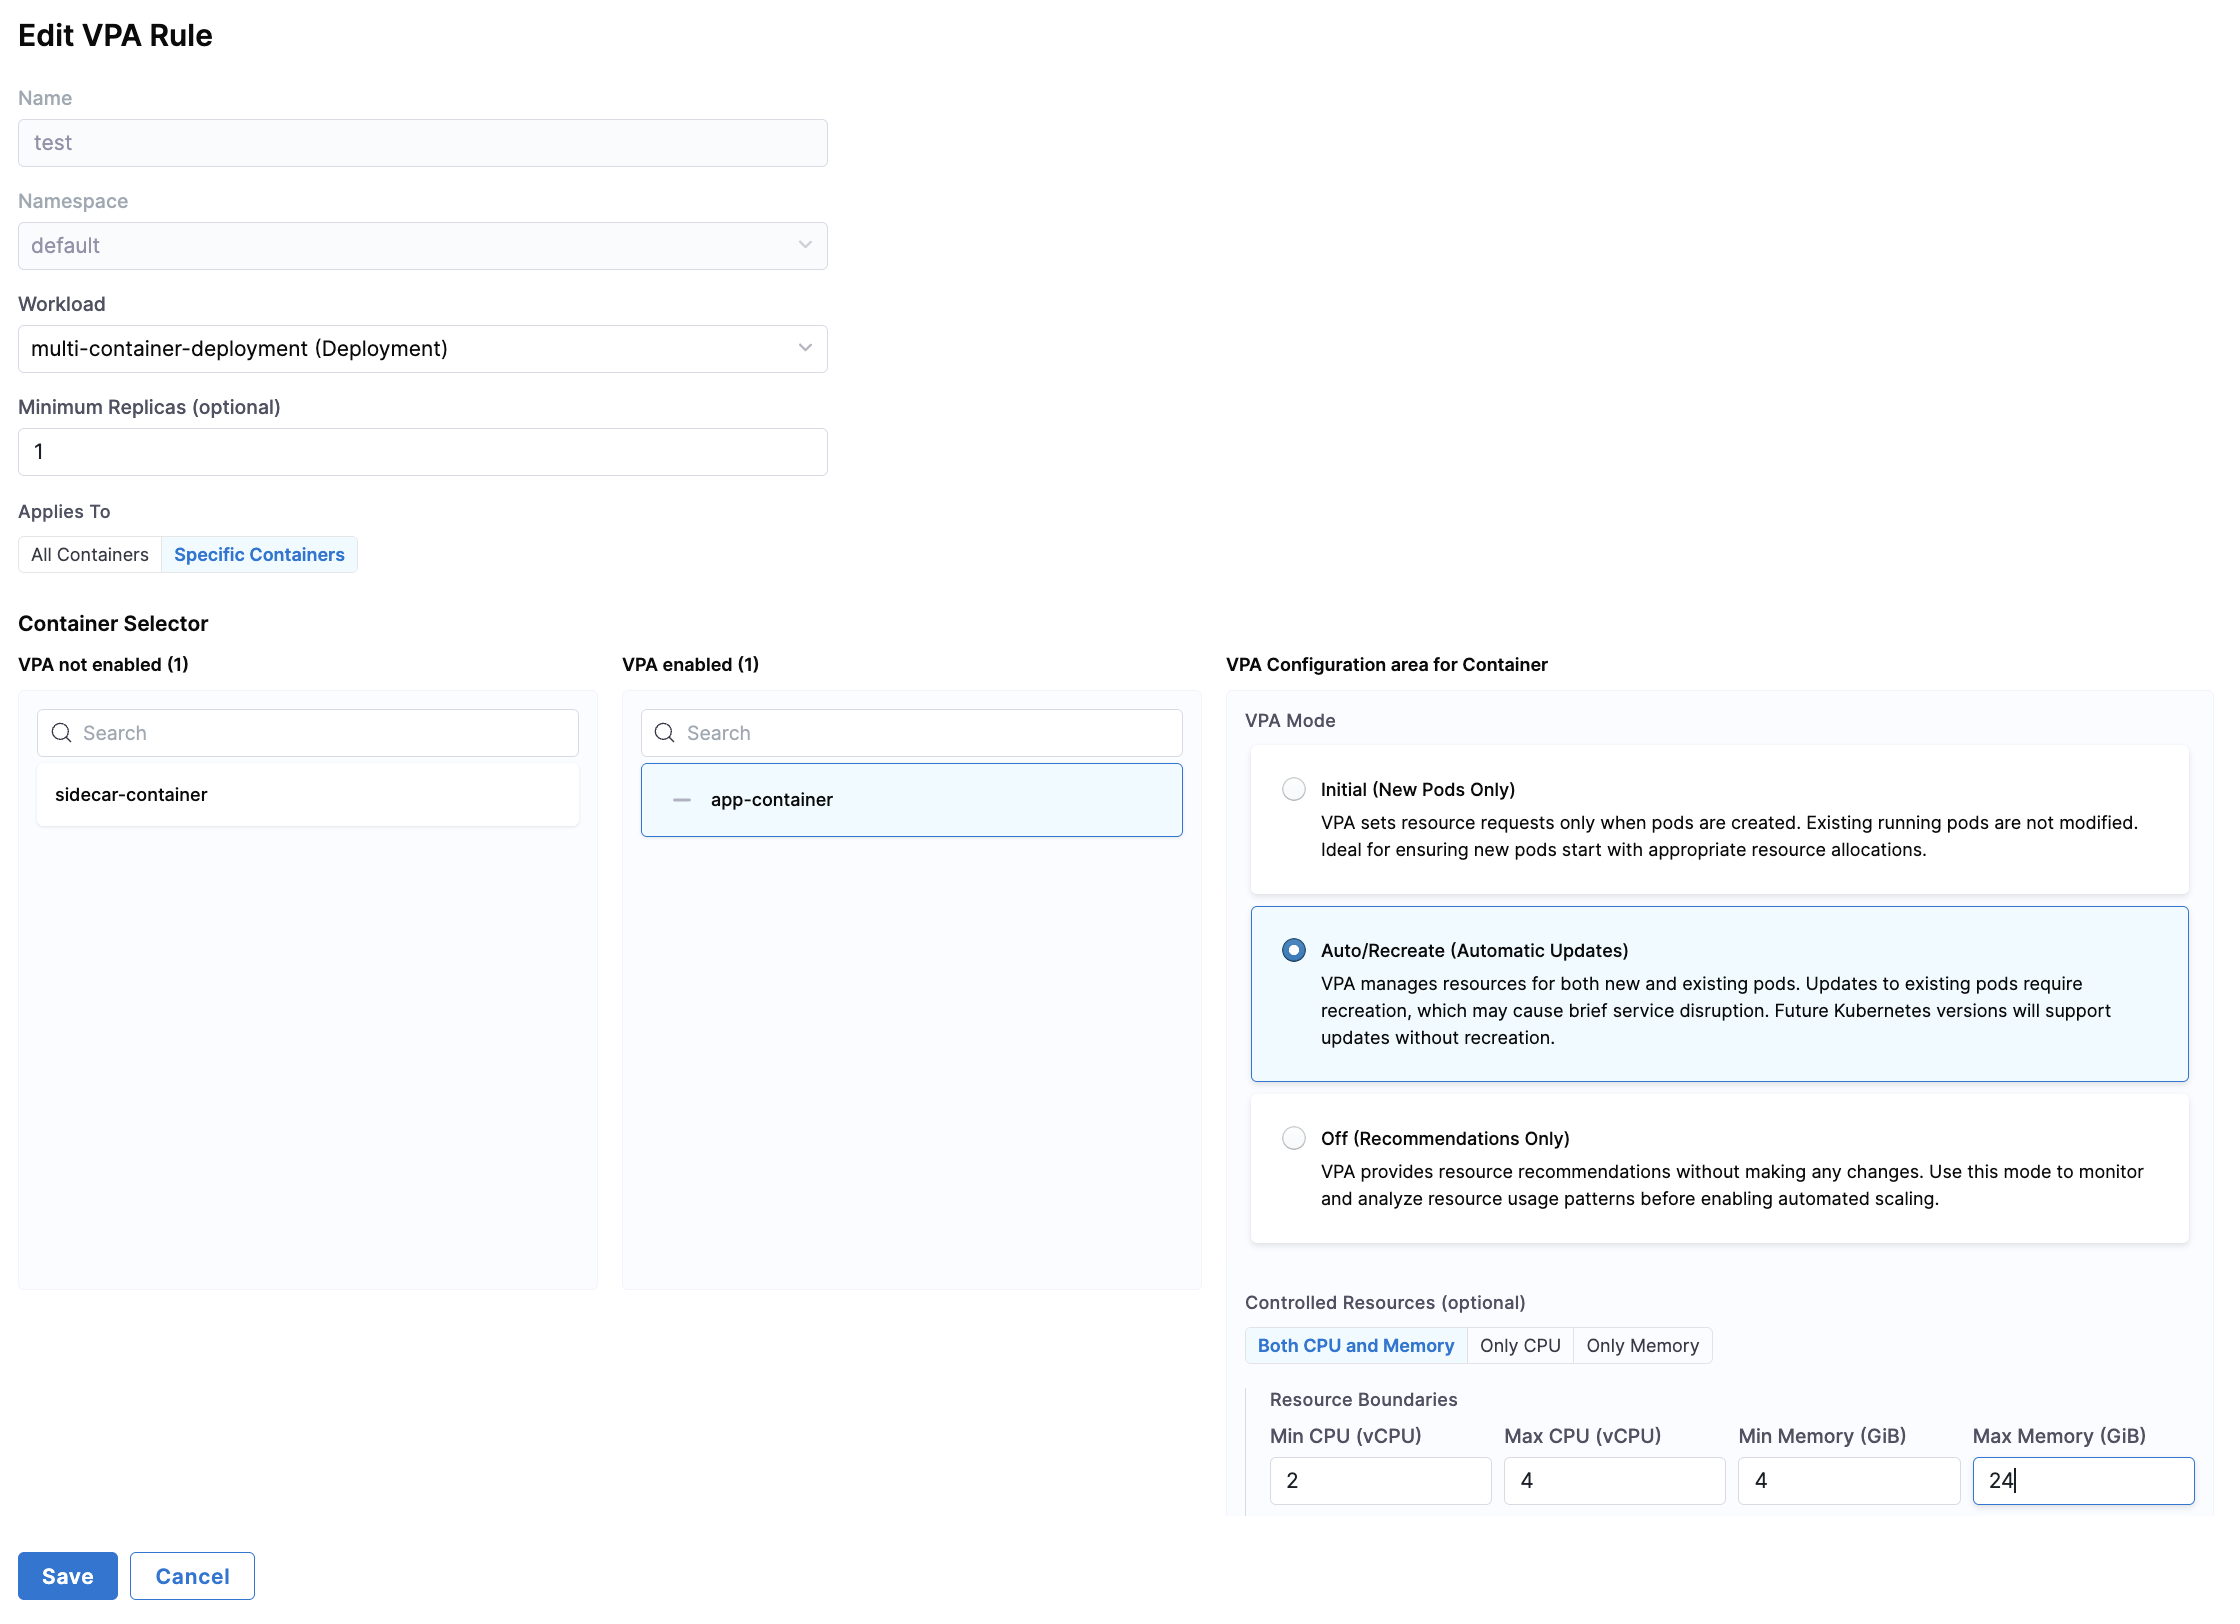
* **Container Selection**: Choose between "All Containers" or select specific containers. If choosing specific containers, select the containers from the list.
VPA
* **VPA Mode**: Choose one of the following operating modes:
* **Initial (New Pods Only)**: VPA sets resource requests only when pods are created. Existing running pods are not modified. Ideal for ensuring new pods start with appropriate resource allocations.
* **Auto/Recreate (Automatic Updates)**: VPA manages resources for both new and existing pods. Updates to existing pods require recreation, which may cause brief service disruption. Future Kubernetes versions will support updates without recreation.
* **Off (Recommendations Only)**: VPA provides resource recommendations without making any changes. Use this mode to monitor and analyze resource usage patterns before enabling automated scaling.
* **Controlled Resources** (optional):
* **Both CPU and Memory**: VPA will manage both resource types
* **Only CPU**: VPA will only manage CPU resources
* **Only Memory**: VPA will only manage memory resources
* **Resource Boundaries**:
* **Min CPU**: Minimum CPU request (e.g., 100m)
* **Max CPU**: Maximum CPU request (e.g., 1000m)
* **Min Memory**: Minimum memory request (e.g., 128Mi)
* **Max Memory**: Maximum memory request (e.g., 1Gi)
After configuring all settings, click **Save** to implement your VPA configuration.
***
## Logs
Overview
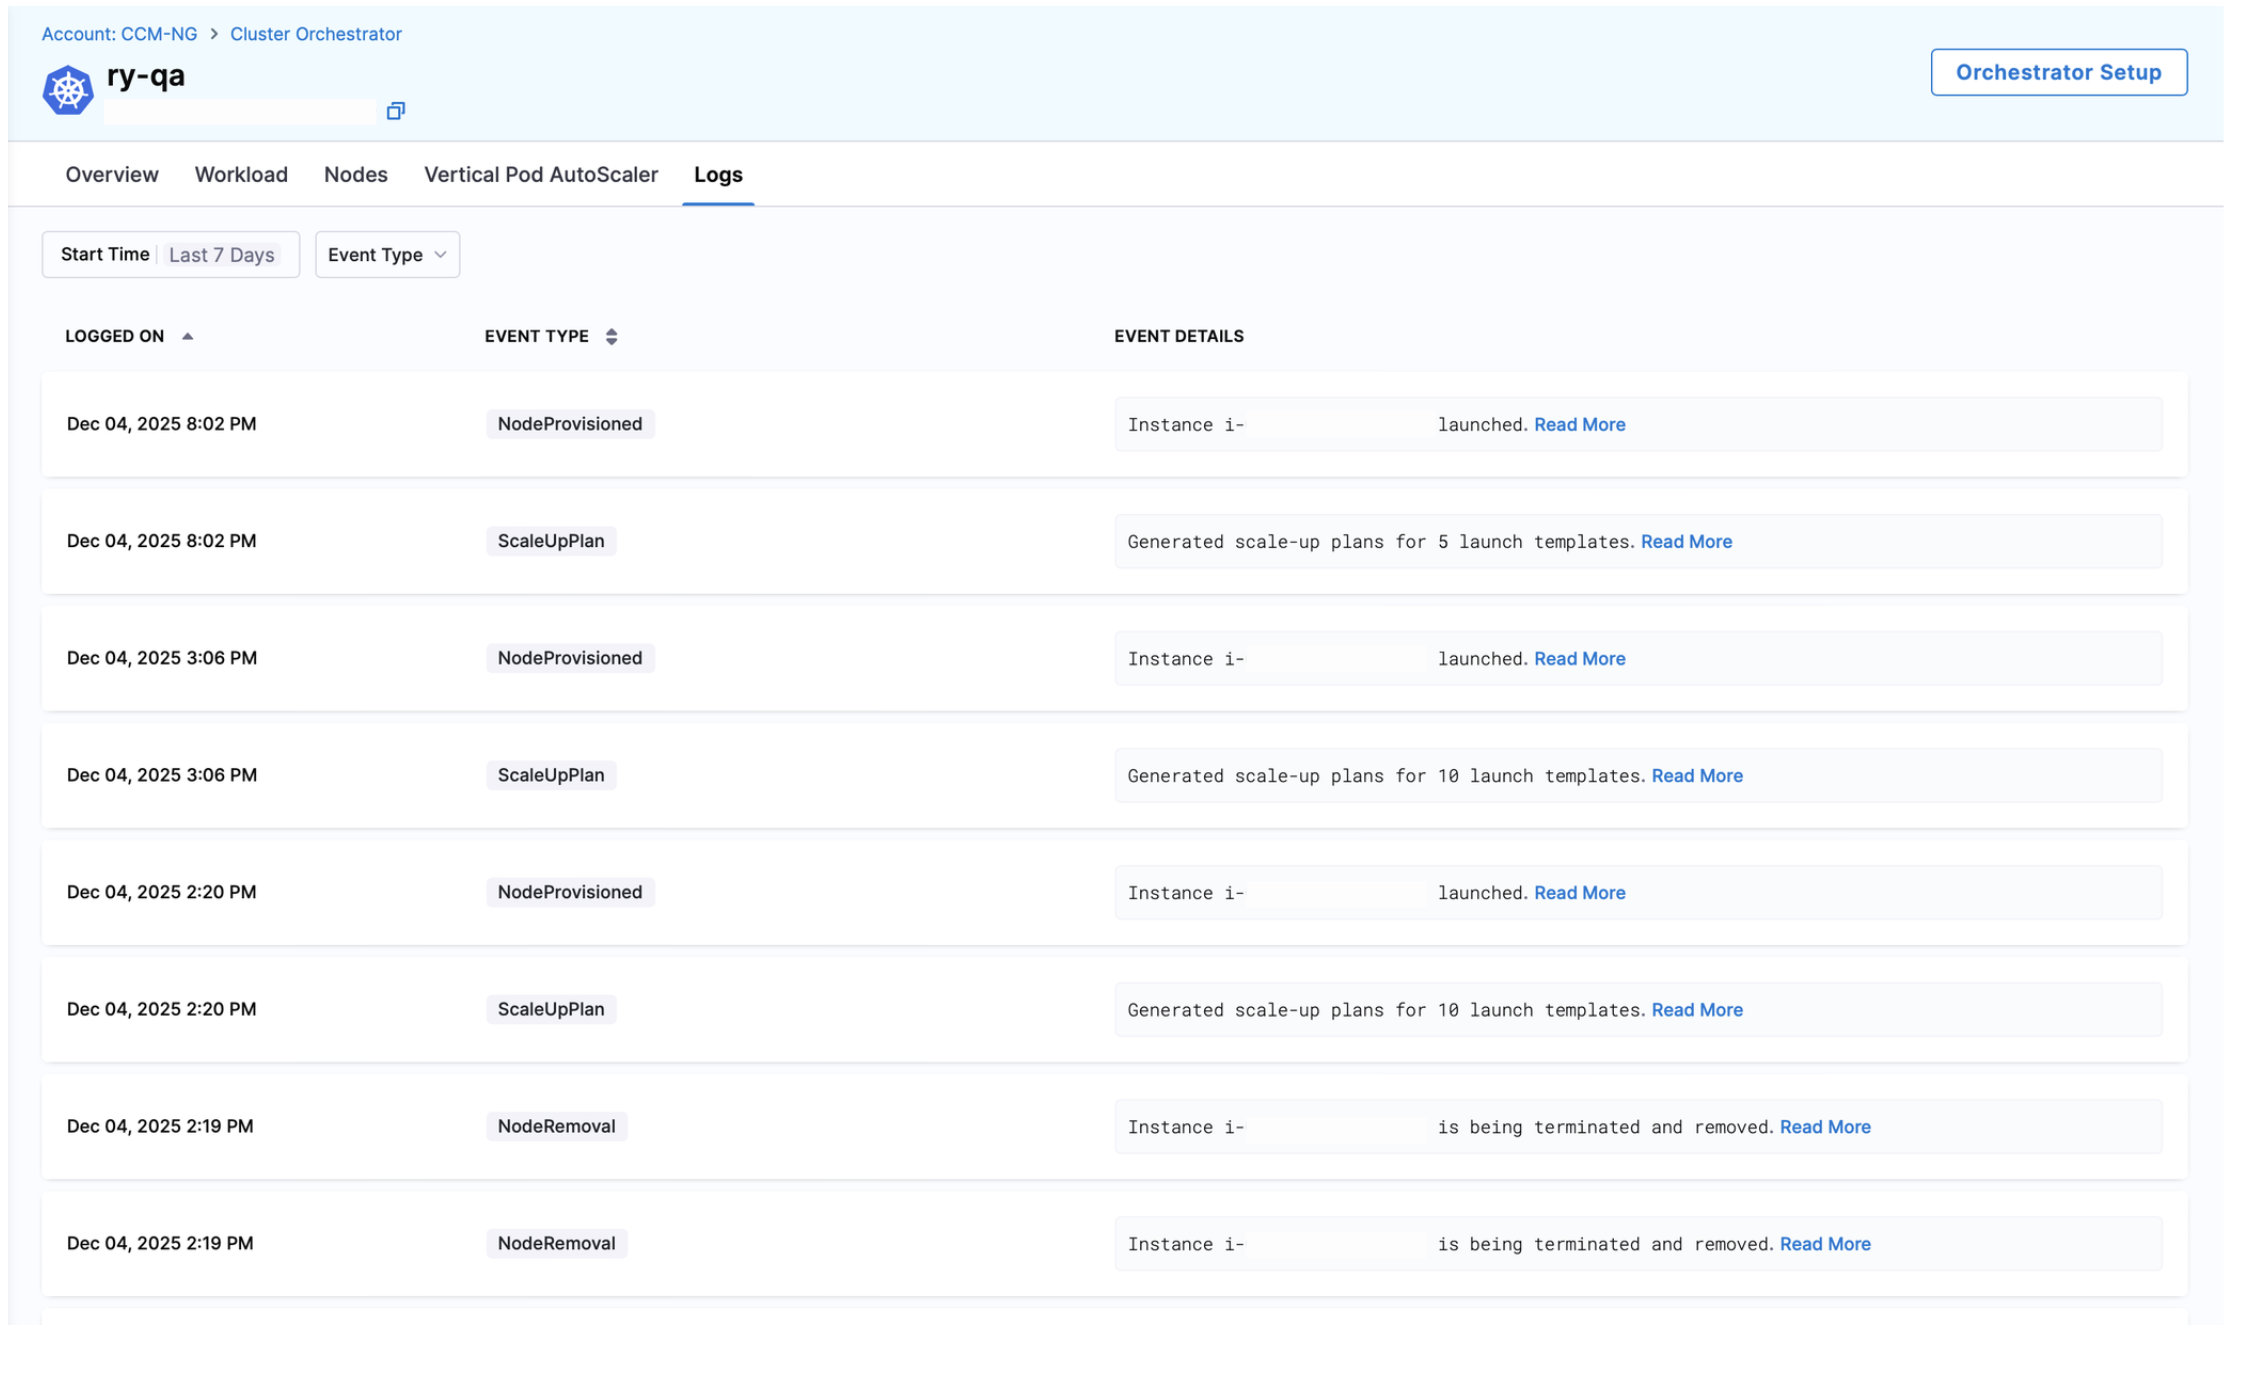
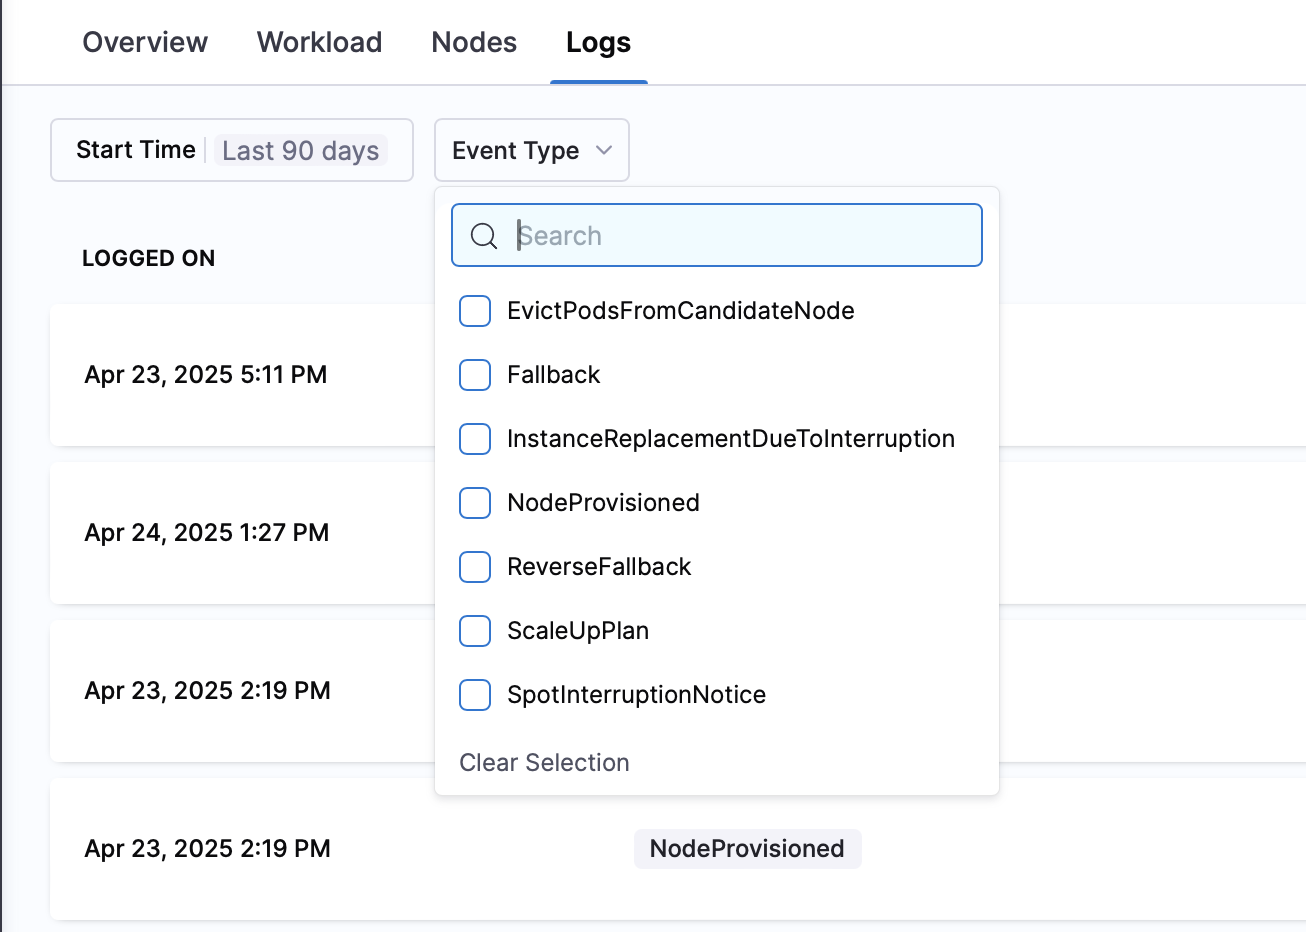
The Logs screen provides a chronological record of all cluster events and optimization activities. You can filter events by time period (e.g., Last 90 days) and event type.
| Column | Description |
| ----------------- | -------------------------------------------------------------- |
| **Logged On** | Timestamp when the event occurred (e.g., Apr 23, 2025 5:11 PM) |
| **Event Type** | Category of the event (see types below) |
| **Event Details** | Description of what happened |
### Event Types
Overview
The logs track several types of events that help you understand cluster activity:
* **NodeProvisioned**: When new instances are launched (e.g., "Instance i-0138fc81dc9c82e31 launched")
* **ScaleUpPlan**: When the system generates plans to scale up resources (e.g., "Generated scale-up plans for 5 launch templates")
* **EvictPodsFromCandidateNode**: When pods are evicted as part of optimization activities
* **Fallback**: When workloads transition from spot to on-demand instances due to unavailability
* **ReverseFallback**: When workloads transition back from on-demand to spot instances
* **InstanceReplacementDueToInterruption**: When instances are replaced due to spot interruptions
* **SpotInterruptionNotice**: When AWS sends a notification that a spot instance will be interrupted
{% @harness-feedback/feedback %}