Detect Anomalies using Harness CACM
Harness Cloud & AI Cost Management (CACM) detects cost anomalies for your Kubernetes clusters and cloud accounts. Cloud cost anomaly detection can be used as a tool to keep cloud costs under control.
Introduction
Infrastructure changes, new services, or inefficient resource utilization can lead to unexpected fluctuations in cloud expenses. Harness Cloud & AI Cost Management (CACM) anomaly detection identifies unusually high cost spikes and promptly notifies users, ensuring better cost control and transparency.
Harness CACM leverages advanced detection mechanisms to monitor cost anomalies across your Kubernetes clusters and cloud accounts. This feature acts as a safeguard for managing cloud costs effectively. Additionally, it includes built-in alerting capabilities, sending notifications through notification channels including email and Slack to ensure stakeholders are informed as soon as anomalies are detected.
Get Started
Getting started with CACM anomaly detection is straightforward and requires just a few steps:
Set up a Cloud Cost Connector - Connect your cloud provider accounts (AWS, GCP, Azure) to Harness CACM using the appropriate connectors.
Allow Data Collection - Once connected, Harness will automatically begin collecting cost data from your cloud environments. The system requires approximately 42 days of historical data for optimal anomaly detection.
Automatic Anomaly Detection - After data starts flowing in, the anomaly detection system will automatically begin analyzing your cost patterns and identifying potential anomalies. No additional configuration is required for basic anomaly detection.
Anomaly Detection Process
CACM's anomaly detection process works through four key steps:
Step 1: Data Collection
Harness continuously monitors your cloud spending across AWS, Azure, and GCP
Historical data is analyzed to understand your normal spending patterns
CACM collects 42 days of historical cost data for each cluster and cloud account to establish a baseline for normal spending patterns
Step 2: Anomaly Detection
Our models compare current spending against predicted costs using the Prophet model
The system applies sophisticated time series forecasting to predict expected costs with high precision, considering:
Historical trends and cyclical behaviors
Day-to-day and week-to-week fluctuations
Multiple validation checks ensure accuracy
Only statistically significant deviations are flagged
The Prophet model creates a "normal spending corridor" with confidence intervals based on your historical patterns
When actual costs fall outside this predicted confidence interval, the system flags them as anomalies
Step 3: Severity Classification
Detected anomalies are automatically classified by severity:
🔴 CRITICAL
Cost impact ≥ $5,000 OR ≥100% increase
🟡 MEDIUM
Cost impact ≥ $1,000 OR ≥50% increase
🟢 LOW
Smaller but notable cost changes
Step 4: Smart Filtering
You can customize detection thresholds to match your needs
Set minimum cost impact levels to focus on what matters
Filter out noise and focus on actionable anomalies
Configure anomaly preferences to control which anomalies are surfaced
Step 5: Notification
When anomalies are detected, alerts are sent through configured channels (email and Slack)
Anomaly Lookback Support
[Released: Feb 2026]
Anomaly Lookback Support in Harness Cloud & AI Cost Management automatically keeps your anomaly data accurate and up-to-date with the latest cloud provider billing information.
Cloud providers (AWS, GCP, Azure) frequently update their billing data days or even weeks after initial reporting. Previously, when Harness detected a cost anomaly, the cost value was stored at detection time and not updated when cloud providers corrected their billing data.
With Anomaly Lookback Support we now have:
Automatic Cost Recalculation
Anomaly costs are automatically recalculated daily based on the latest billing data
Lookback window: Last 30 days of active anomalies are reprocessed
Scheduled execution: Runs daily
Intelligent Auto-Archival: Anomalies that no longer meet threshold criteria are automatically archived.
Multi-Cost Type Support
AWS Cost Types:
Unblended Cost
Blended Cost
Amortized Cost
Net Amortized Cost
Effective Cost
Azure Cost Types:
Actual Cost
Amortized Cost All cost types are recalculated and stored, respecting your preferred cost type settings.
Dynamic Criticality Updates
Anomaly severity (Critical/High/Medium) is automatically recalculated
Example: A "Critical" anomaly might be downgraded to "Medium" after billing corrections
Anomalies Overview Page
The Anomalies Overview page provides a comprehensive view of all detected anomalies across your cloud infrastructure.

On Overview page:
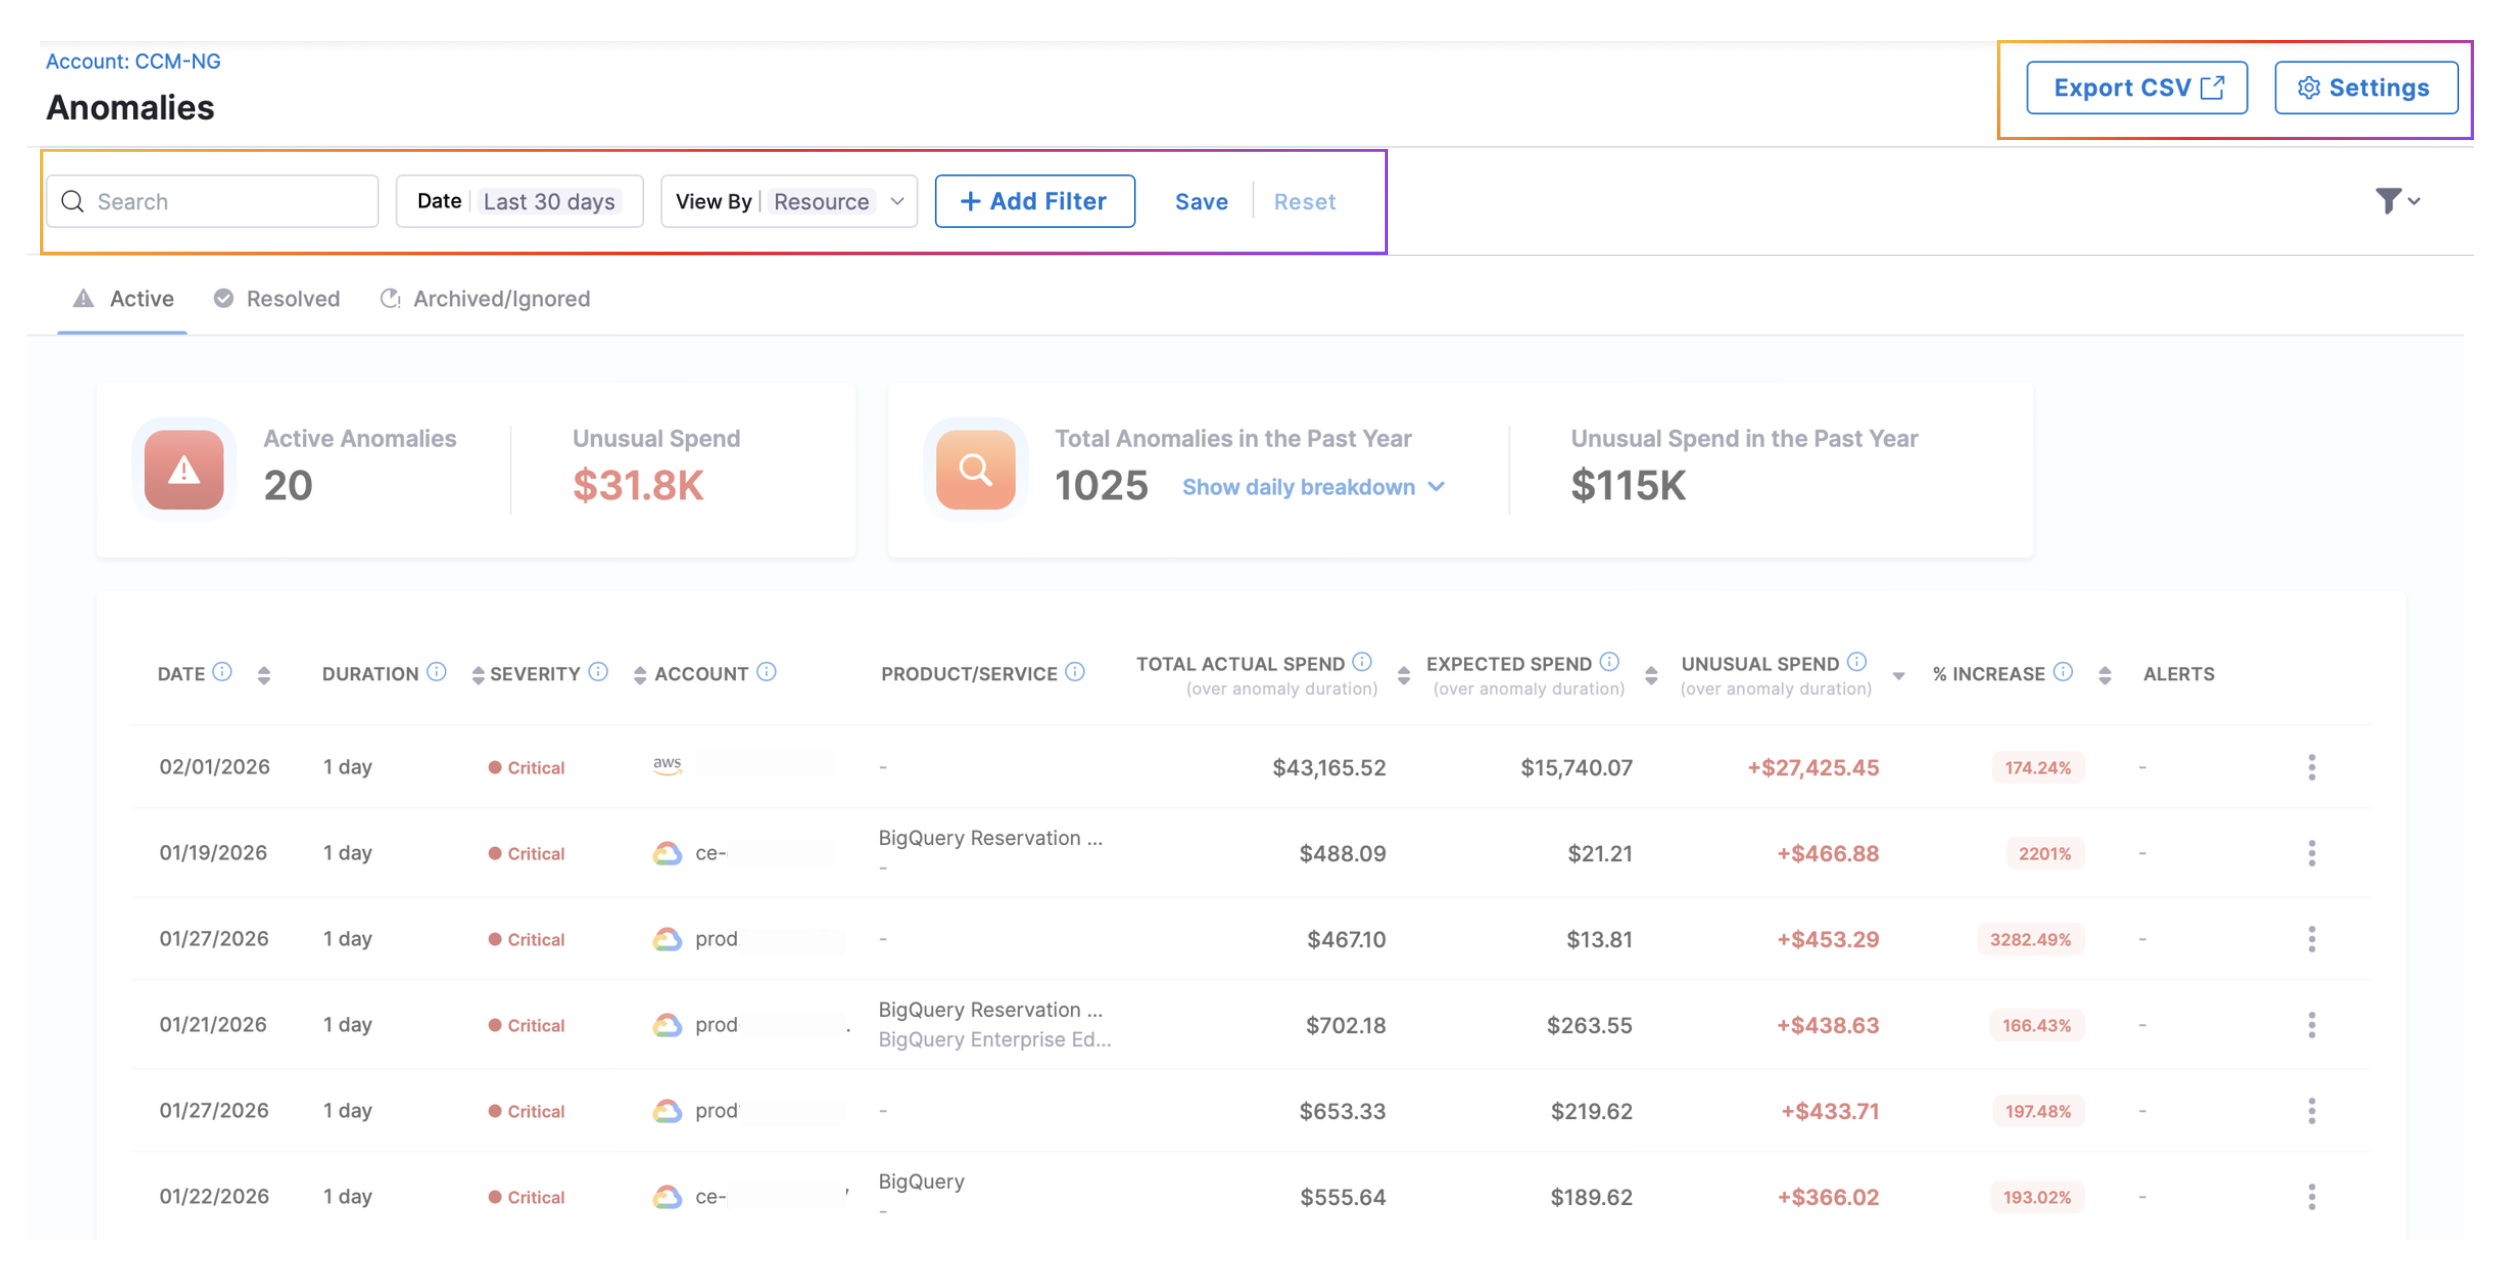
Time Range Selection: Quick select options include 7, 30, or 90 days, or you can pick a custom date range with specific start and end dates.
View By: This option allows you to organize and view anomalies in two different ways:
Resource: Displays anomalies grouped by individual cloud resources. This view helps you identify which specific resources are experiencing unusual cost patterns.
Cost Buckets: Displays anomalies organized by specific Cost Buckets in your Cost Categories. When you select this option, an additional Cost Category Name filter appears, allowing you to narrow down anomalies to a specific Cost Bucket. This view is useful for understanding cost anomalies at a higher organizational level rather than at the individual resource level.

Click to view full size image Filters: You can filter anomalies by multiple dimensions:
Generic Filters: Total Actual Spend, Unusual Spend, Cost Category
Cluster Filters (for Kubernetes): Cluster Name, Namespace, Workload, Service
GCP Filters: GCP Project, GCP Product, GCP SKU Description
AWS Filters: AWS Account, AWS Service, AWS Usage Type
Azure Filters: Azure Subscription, Azure Meter Categories, Azure Resource
Export CSV: Export filtered anomalies to CSV for further analysis, reporting, or integration with other tools.
Export Scope Options:
All filtered results: Export all anomalies matching your current filters
Current page only: Export only the anomalies visible on the current page
Filters Applied: Choose which filters to apply to the export, such as:
Time Range: Specific date range (e.g., 12/30/2025 - 01/29/2026)
Status: Anomaly status (e.g., Active, Resolved, Archived/Ignored)
Settings: Configure anomaly detection behavior through :
Alerts (set up notifications)
Preferences (customize detection thresholds)
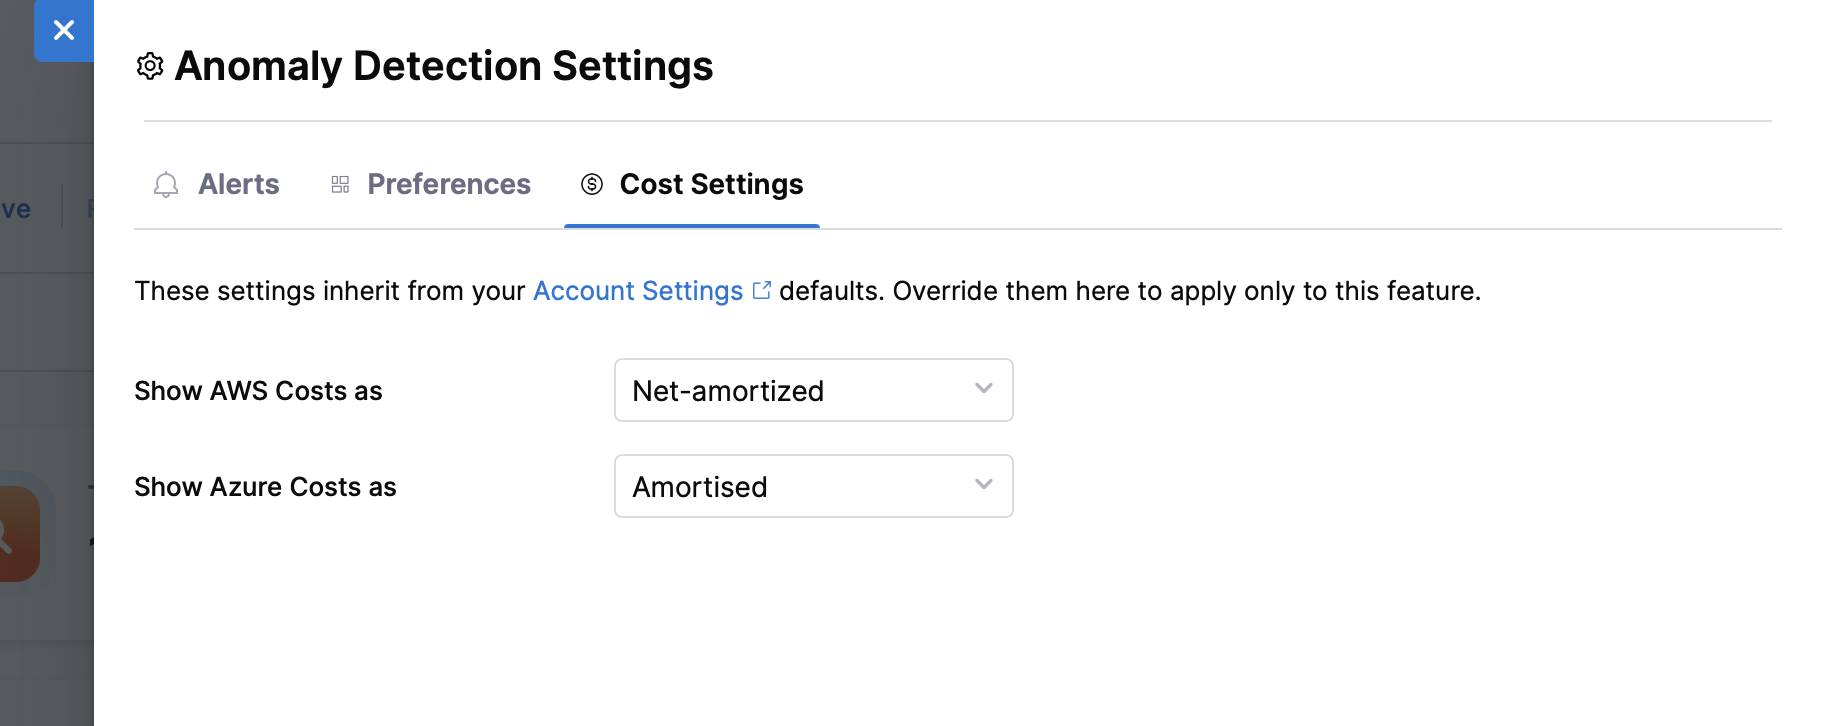
Cost Settings (configure how costs are displayed for AWS and Azure).
Anomaly Tabs
The page is organized into three main tabs to help you manage and track anomalies effectively.
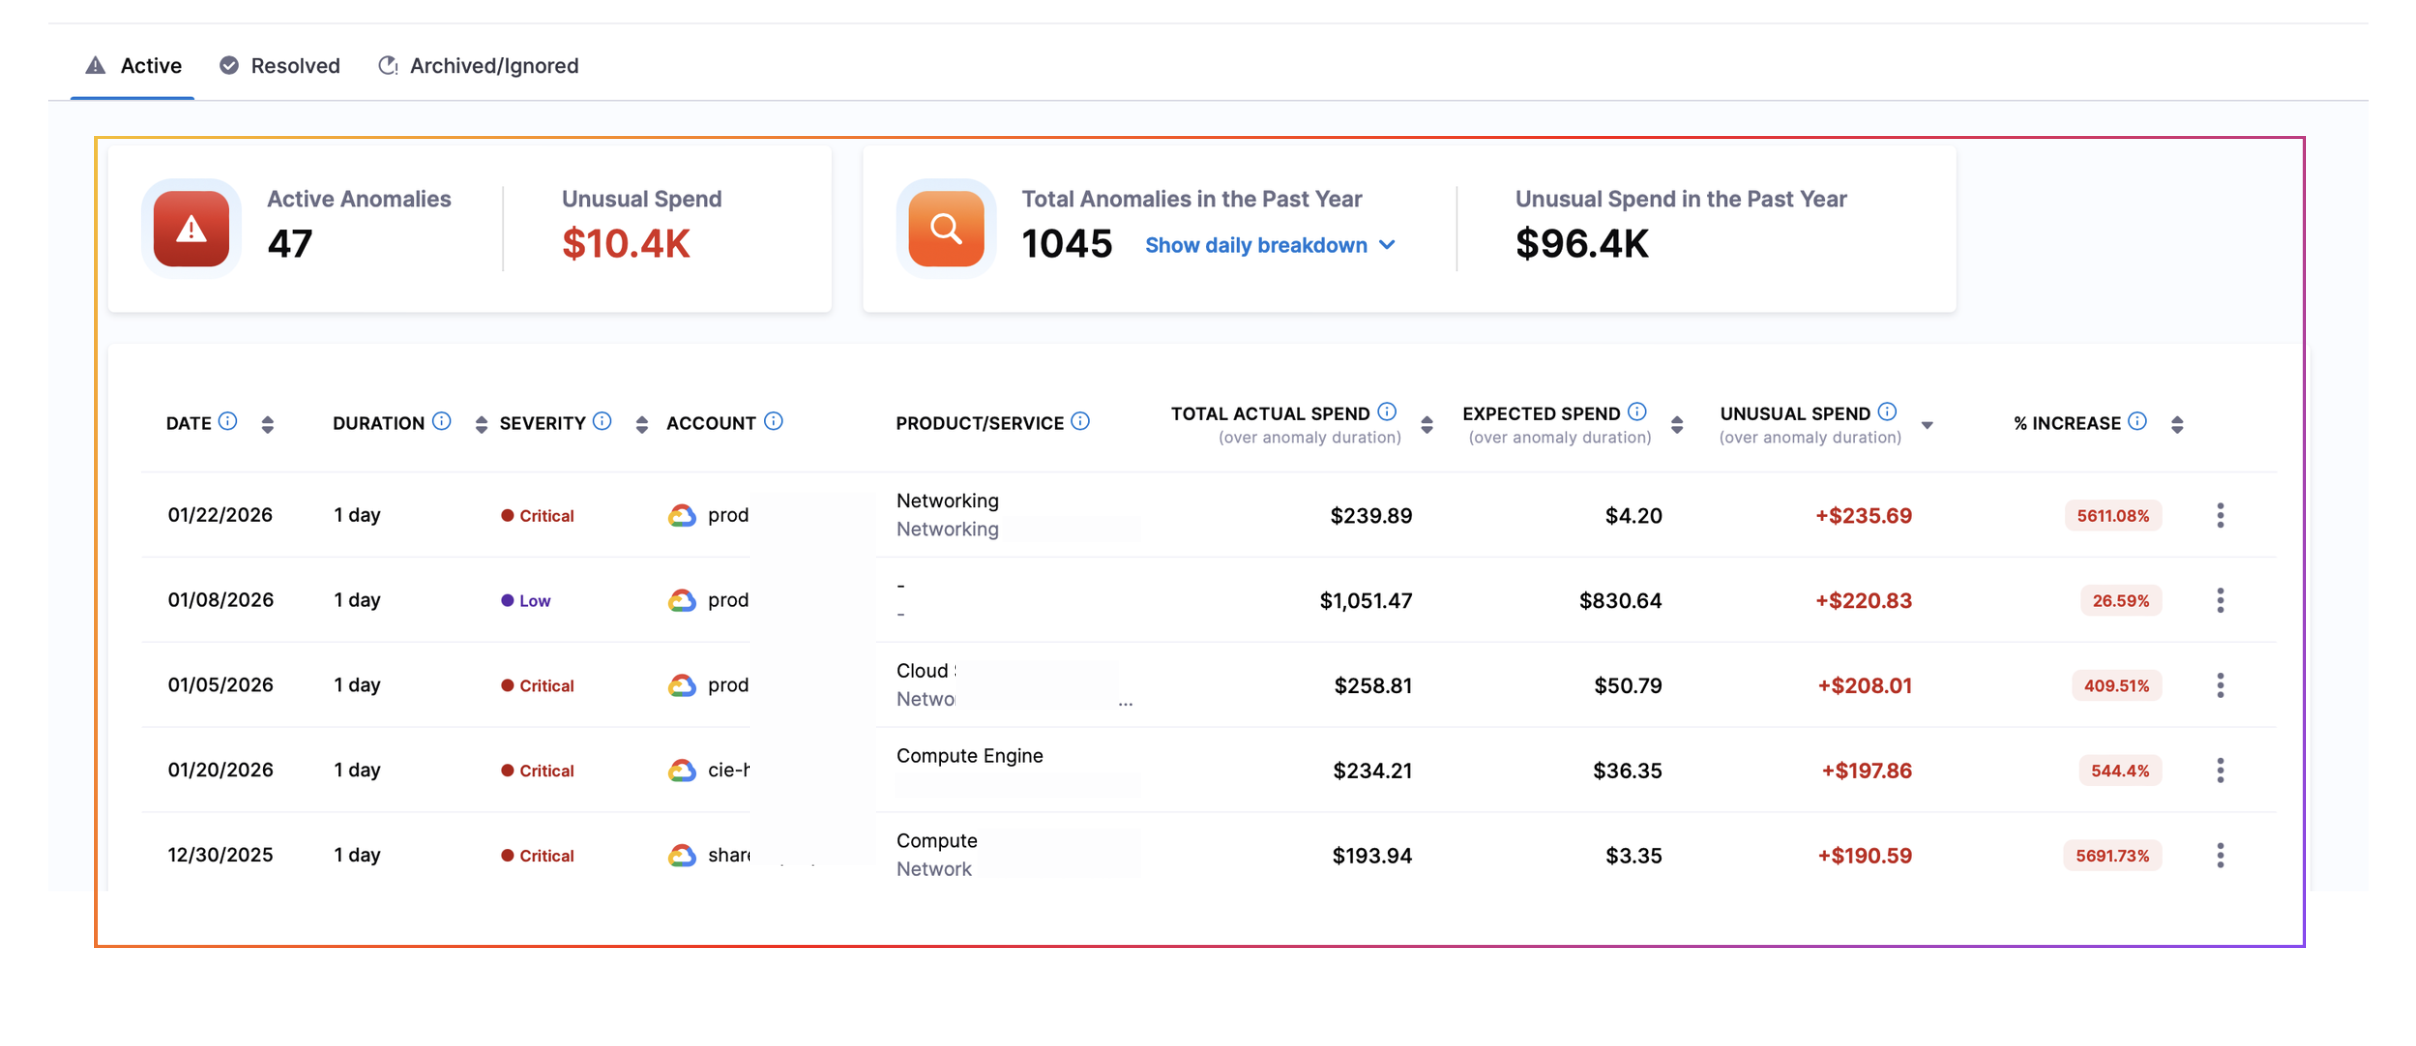
Active Anomalies

The Active tab displays newly detected anomalies that require attention and haven't been addressed yet.
When you navigate to the Active tab, you'll see key metrics that provide insights into your current anomaly landscape:
Active Anomalies: The total count of currently active anomalies requiring your attention
Unusual Spend: The total additional cost incurred due to active anomalies (difference between actual and expected spend)
Total Anomalies in Past Year: Historical count of all anomalies detected in the last 12 months
Click on "Show Daily Breakdown" to view a detailed heatmap
The heatmap visualizes all detected anomalies over the selected time range, displaying either:
Cost Impact: Shows the financial impact of anomalies
Number of Anomalies: Shows the frequency of anomalies
Unusual Spend in the Past Year: Total additional costs incurred from all anomalies over the last 12 months
Below the summary metrics, you'll find a detailed table listing all active anomalies with the following columns:
Date
The date when the anomaly was detected
Duration
How long the anomalous spending pattern persisted
Severity
The severity level (Low, Medium, Critical) based on cost impact and percentage increase:
• LOW: Minor deviations
• MEDIUM: Noticeable change, warrants review
• CRITICAL: Large cost jumps, requires immediate investigation
Account
The cloud account or cluster where the anomaly occurred
Product/Service
The specific cloud service and product that caused the anomaly
Total Actual Spend
The actual amount spent over anomaly duration
Expected Spend
The predicted cost over anomaly duration
Unusual Spend
The difference between actual and expected spend over anomaly duration
Increase Percentage
The percentage increase over expected spend:
((Total Actual Spend - Expected Spend) / Expected Spend) × 100
You can click on any row in the table to view detailed drilldown information about that specific anomaly.
Available Actions:
For each anomaly in the table, you have the following options:
Mark Anomaly as Resolved: Move the anomaly to the Resolved tab
Ignore Anomaly: Move the anomaly to the Archived/Ignored tab
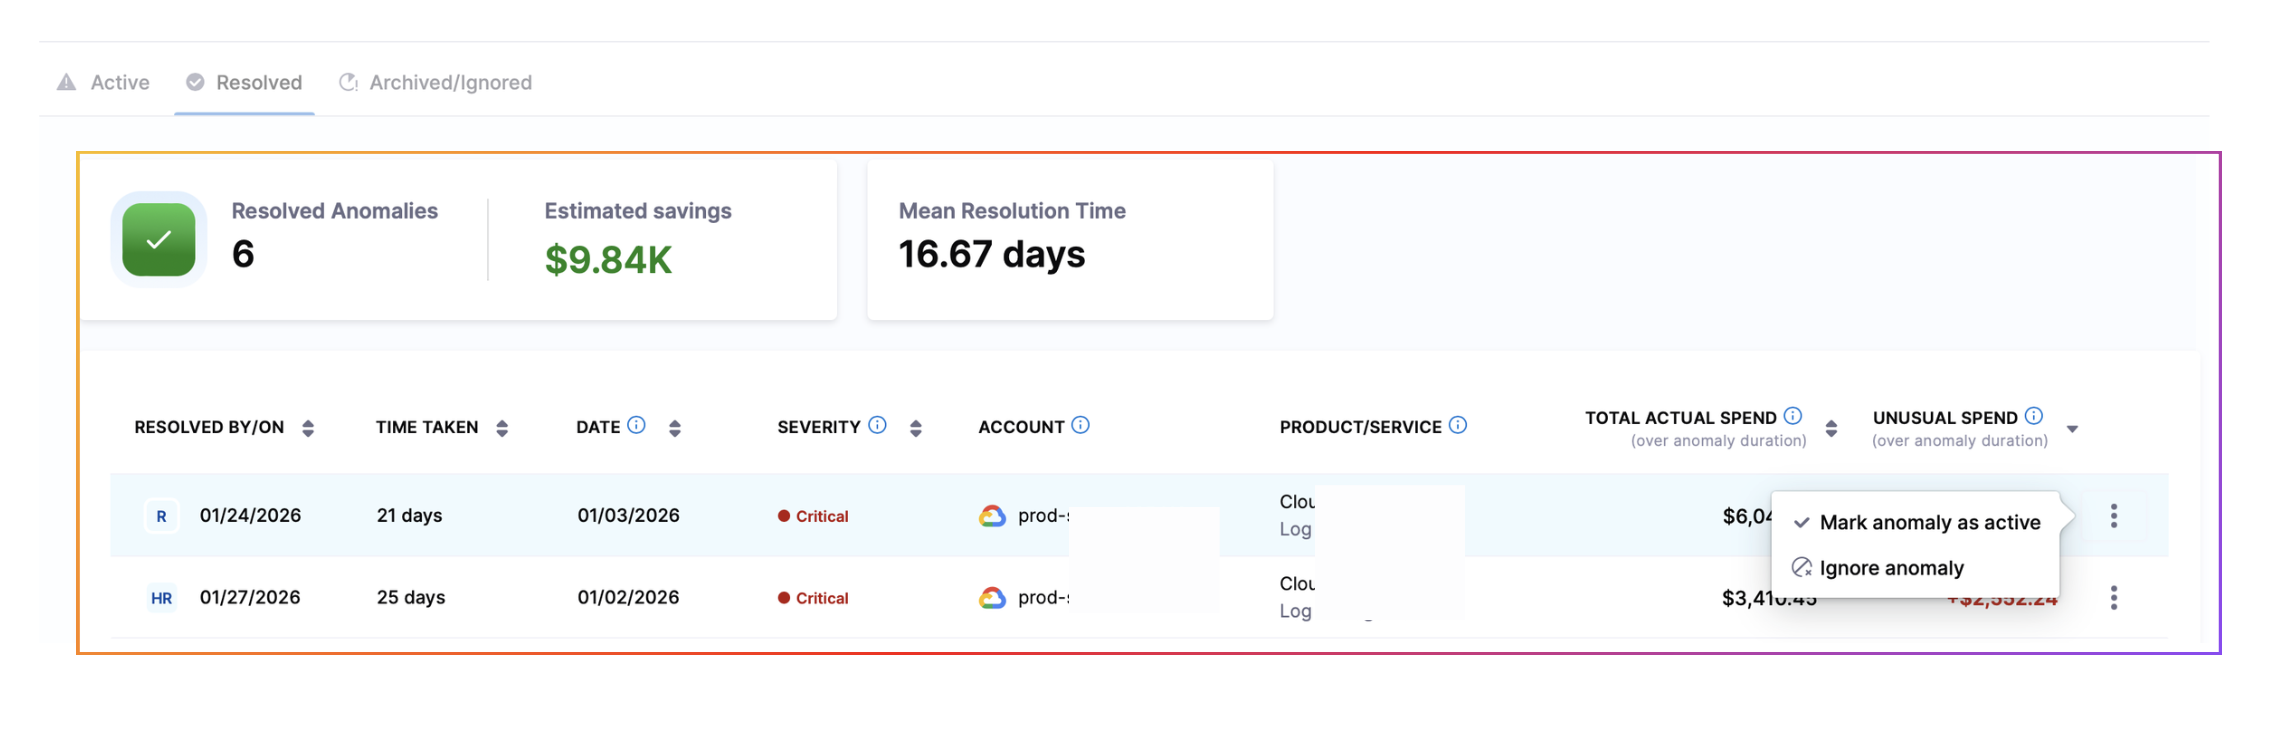
Resolved Anomalies

The Resolved tab shows anomalies that have been reviewed and marked as resolved by your team.
When you navigate to the Resolved tab, you'll see key metrics that provide insights into your resolved anomalies:
Resolved Anomalies: The total count of anomalies that have been marked as resolved
Estimated Savings: The potential cost savings achieved by addressing and resolving these anomalies
Mean Resolution Time: The average time taken to resolve anomalies from detection to resolution
Below the summary metrics, you'll find a detailed table listing all resolved anomalies with the following columns:
Resolved By/On
Shows who resolved the anomaly and when it was resolved
Time Taken
The duration from anomaly detection to resolution
Date
The date when the anomaly was detected
Severity
The severity level of the anomaly (Low, Medium, Critical)
Account
The cloud account or cluster where the anomaly occurred
Product/Service
The specific cloud service and product that caused the anomaly
Total Actual Spend
The actual amount spent over anomaly duration
Unusual Spend
The difference between actual and expected spend over anomaly duration
Resolved anomalies remain in this tab for reference and are automatically archived after 90 days.
Available Actions:
For each anomaly in the table, you have the following options:
Mark Anomaly as Active: Move the anomaly back to the Active tab if it needs further investigation
Ignore Anomaly: Move the anomaly to the Archived/Ignored tab
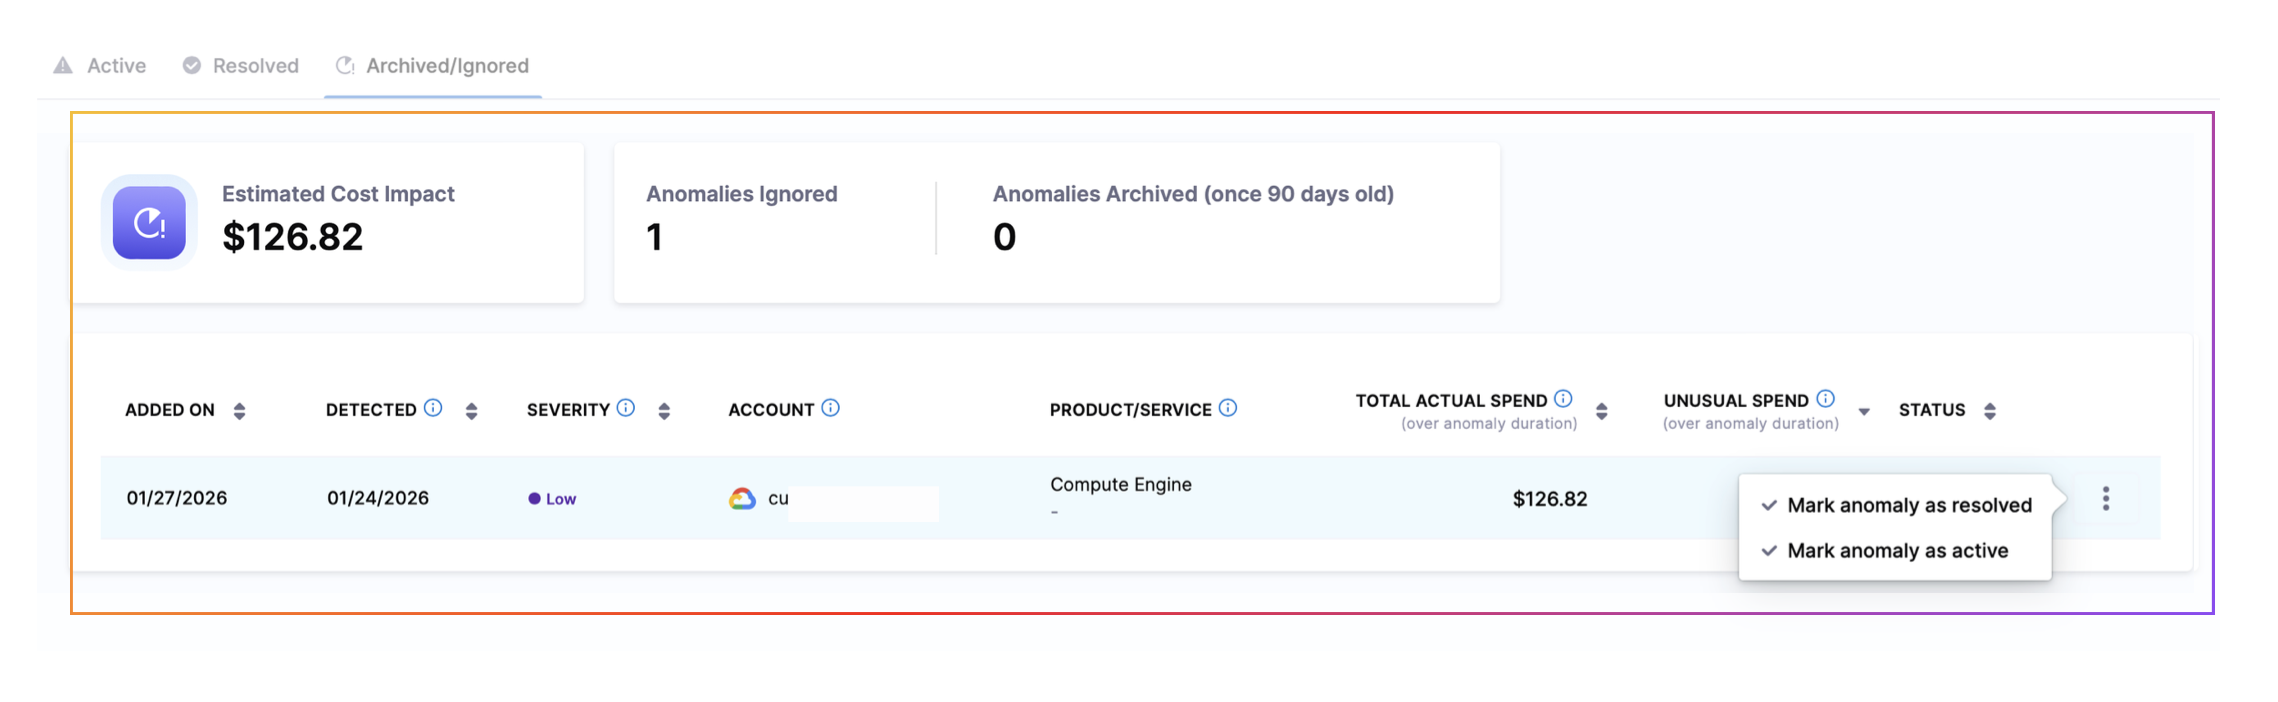
Archived and Ignored Anomalies

The Archived/Ignored tab contains anomalies that have been either manually ignored or automatically archived once they are 90 days old. This tab serves as a long-term repository for anomalies that don't require active attention.
When you navigate to the Archived/Ignored tab, you'll see key metrics:
Estimated Cost Impact: The total financial impact of all archived and ignored anomalies
Anomalies Ignored: The count of anomalies that have been manually marked as ignored
Anomalies Archived: The count of anomalies that have been automatically archived after 90 days
Below the summary metrics, you'll find a detailed table listing all archived and ignored anomalies with the following columns:
Added On
When the anomaly was added to the Archived/Ignored tab (either when it was ignored or when it was archived)
Detected
The date when the anomaly was originally detected
Severity
The severity level of the anomaly (Low, Medium, Critical)
Account
The cloud account or cluster where the anomaly occurred
Product/Service
The specific cloud service and product that caused the anomaly
Total Actual Spend
The actual amount spent over anomaly duration
Unusual Spend
The difference between actual and expected spend over anomaly duration
Status
Indicates whether the anomaly was manually ignored or automatically archived
Available Actions:
For each anomaly in the table, you have the following options:
Mark Anomaly as Resolved: Move the anomaly to the Resolved tab
Mark Anomaly as Active: Move the anomaly back to the Active tab if it needs investigation
Managing Anomalies
Anomaly States
Anomalies exist in one of four states:
Active: Newly detected anomalies that haven't been addressed yet
Resolved: Anomalies that have been reviewed and marked as resolved
Ignored: Anomalies that have been marked as ignored but remain visible for reference
Archived: Anomalies automatically moved to archive after 90 days
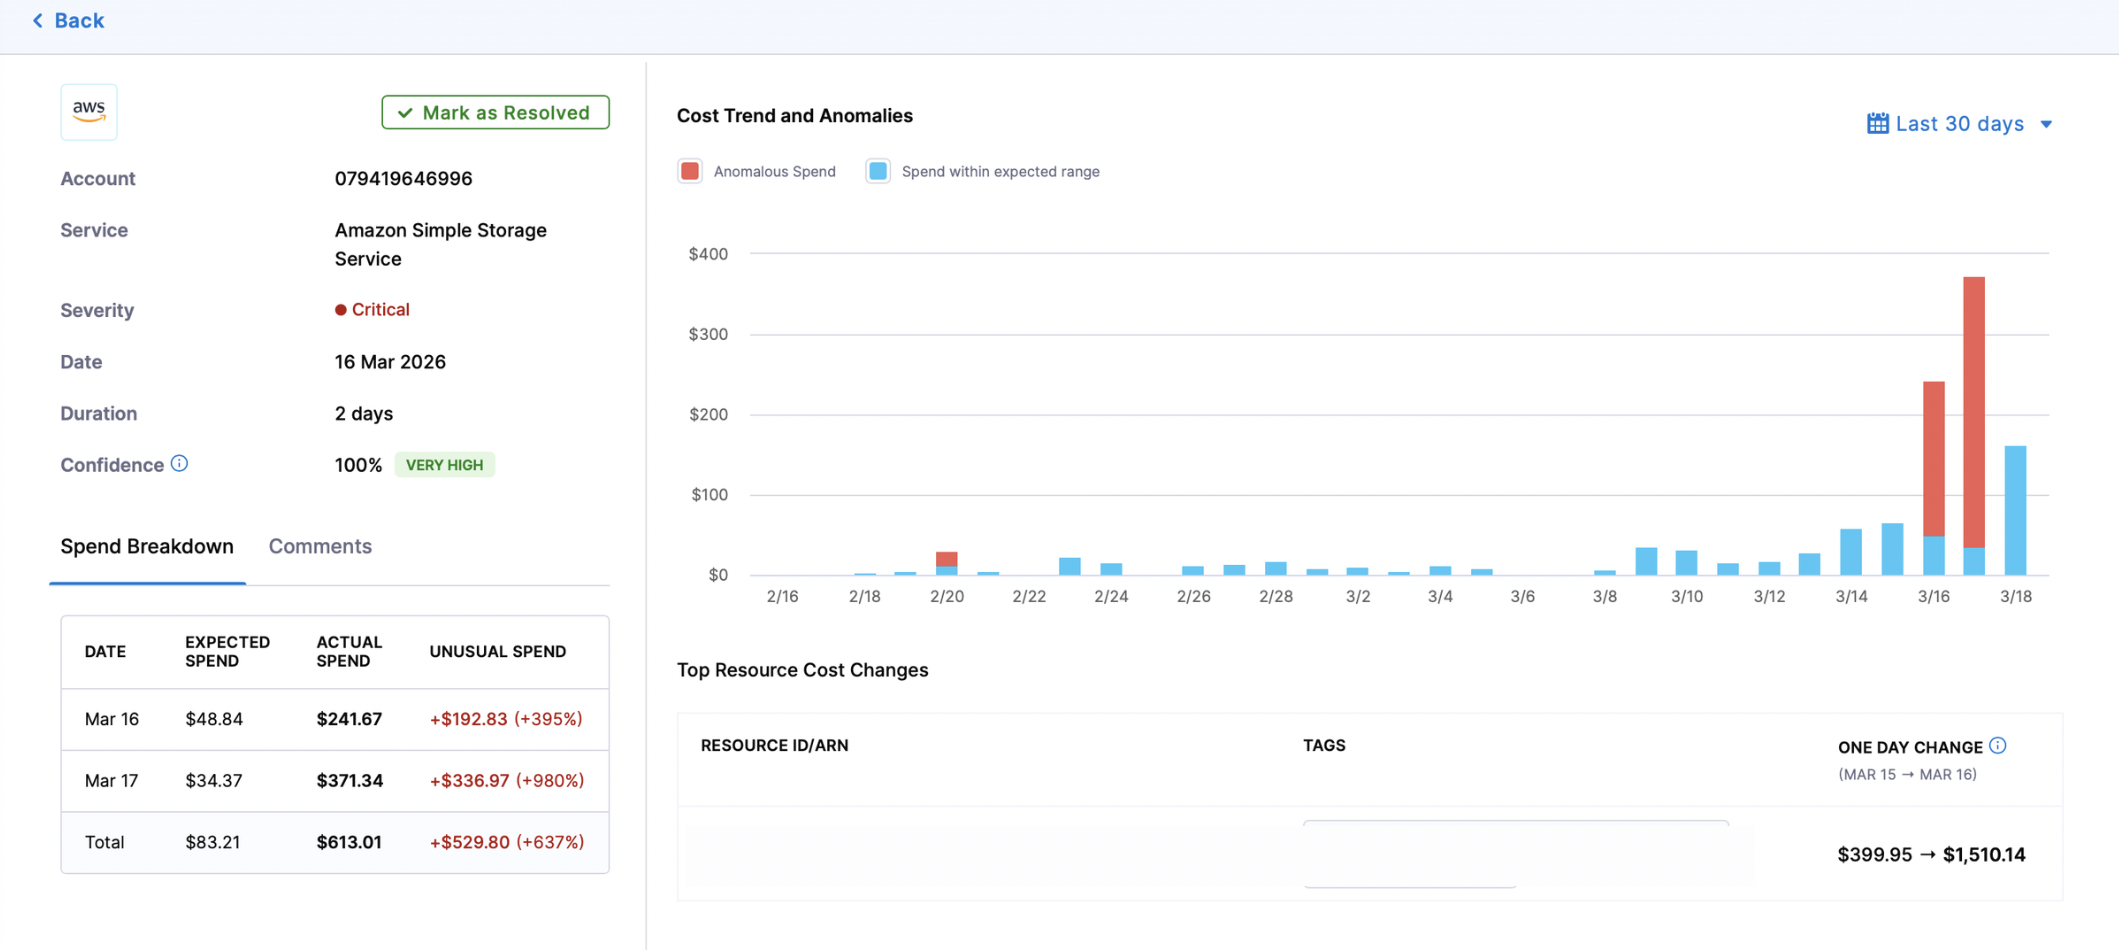
Anomaly Drilldown
Once an anomaly is detected, for each of the anomaly detected, CACM provides insights into what are the resources which might be causing the anomaly.
When you select an anomaly, you'll see detailed information organized into the following sections:
ID: Unique identifier for the anomaly
Severity: The severity level (Low, Medium, Critical) based on cost impact
Date: When the anomaly was detected
Duration: How long the anomalous spending pattern persisted
Confidence Score: When an anomaly is detected, the system assigns an Anomaly Score (0–100%) representing how confident the system is that the cost change is a true anomaly versus normal variance. The score is computed by analyzing how far the actual cost deviates from the expected range, based on historical spending patterns. What the score means:
ScoreConfidenceWhat it tells you1–25%
Low
Small deviation — could be normal day-to-day variance
25–50%
Moderate
Noticeable deviation — likely a real anomaly
50–75%
High
Clear deviation from historical pattern
75–100%
Very High
Unmistakable anomaly — far beyond expected cost range
Spend Breakdown:
Expected Spend: The predicted cost based on historical patterns (e.g., $116.16)
Actual Spend: The actual amount spent during the anomaly period (e.g., $280.52)
Total Unusual Spend: The difference between actual and expected spend, shown as both dollar amount and percentage increase (e.g., +$164.36 (+142%) over 1 day)
Cost Trend and Anomalies Visualization:
A graph displaying historical data (30 or 90 days) that shows:
Anomalous spend that exceeded thresholds
Spend within normal range
Top Resource Cost Changes:
A detailed breakdown of the resources that contributed most to the anomaly, including:
Resource: The specific resource (e.g., EC2 instance, S3 bucket, etc.)
Cost Changes: The change in cost for each resource during the anomaly period
User Actions:
Add Comments: Users can add comments to document their investigation, findings, or actions taken
Feedback Options: Help improve detection accuracy by marking the anomaly as:
True Expected: The cost increase was anticipated
True Unexpected: The cost increase was not anticipated
False: The system incorrectly identified this as an anomaly

Advanced Settings
Anomaly Alerts
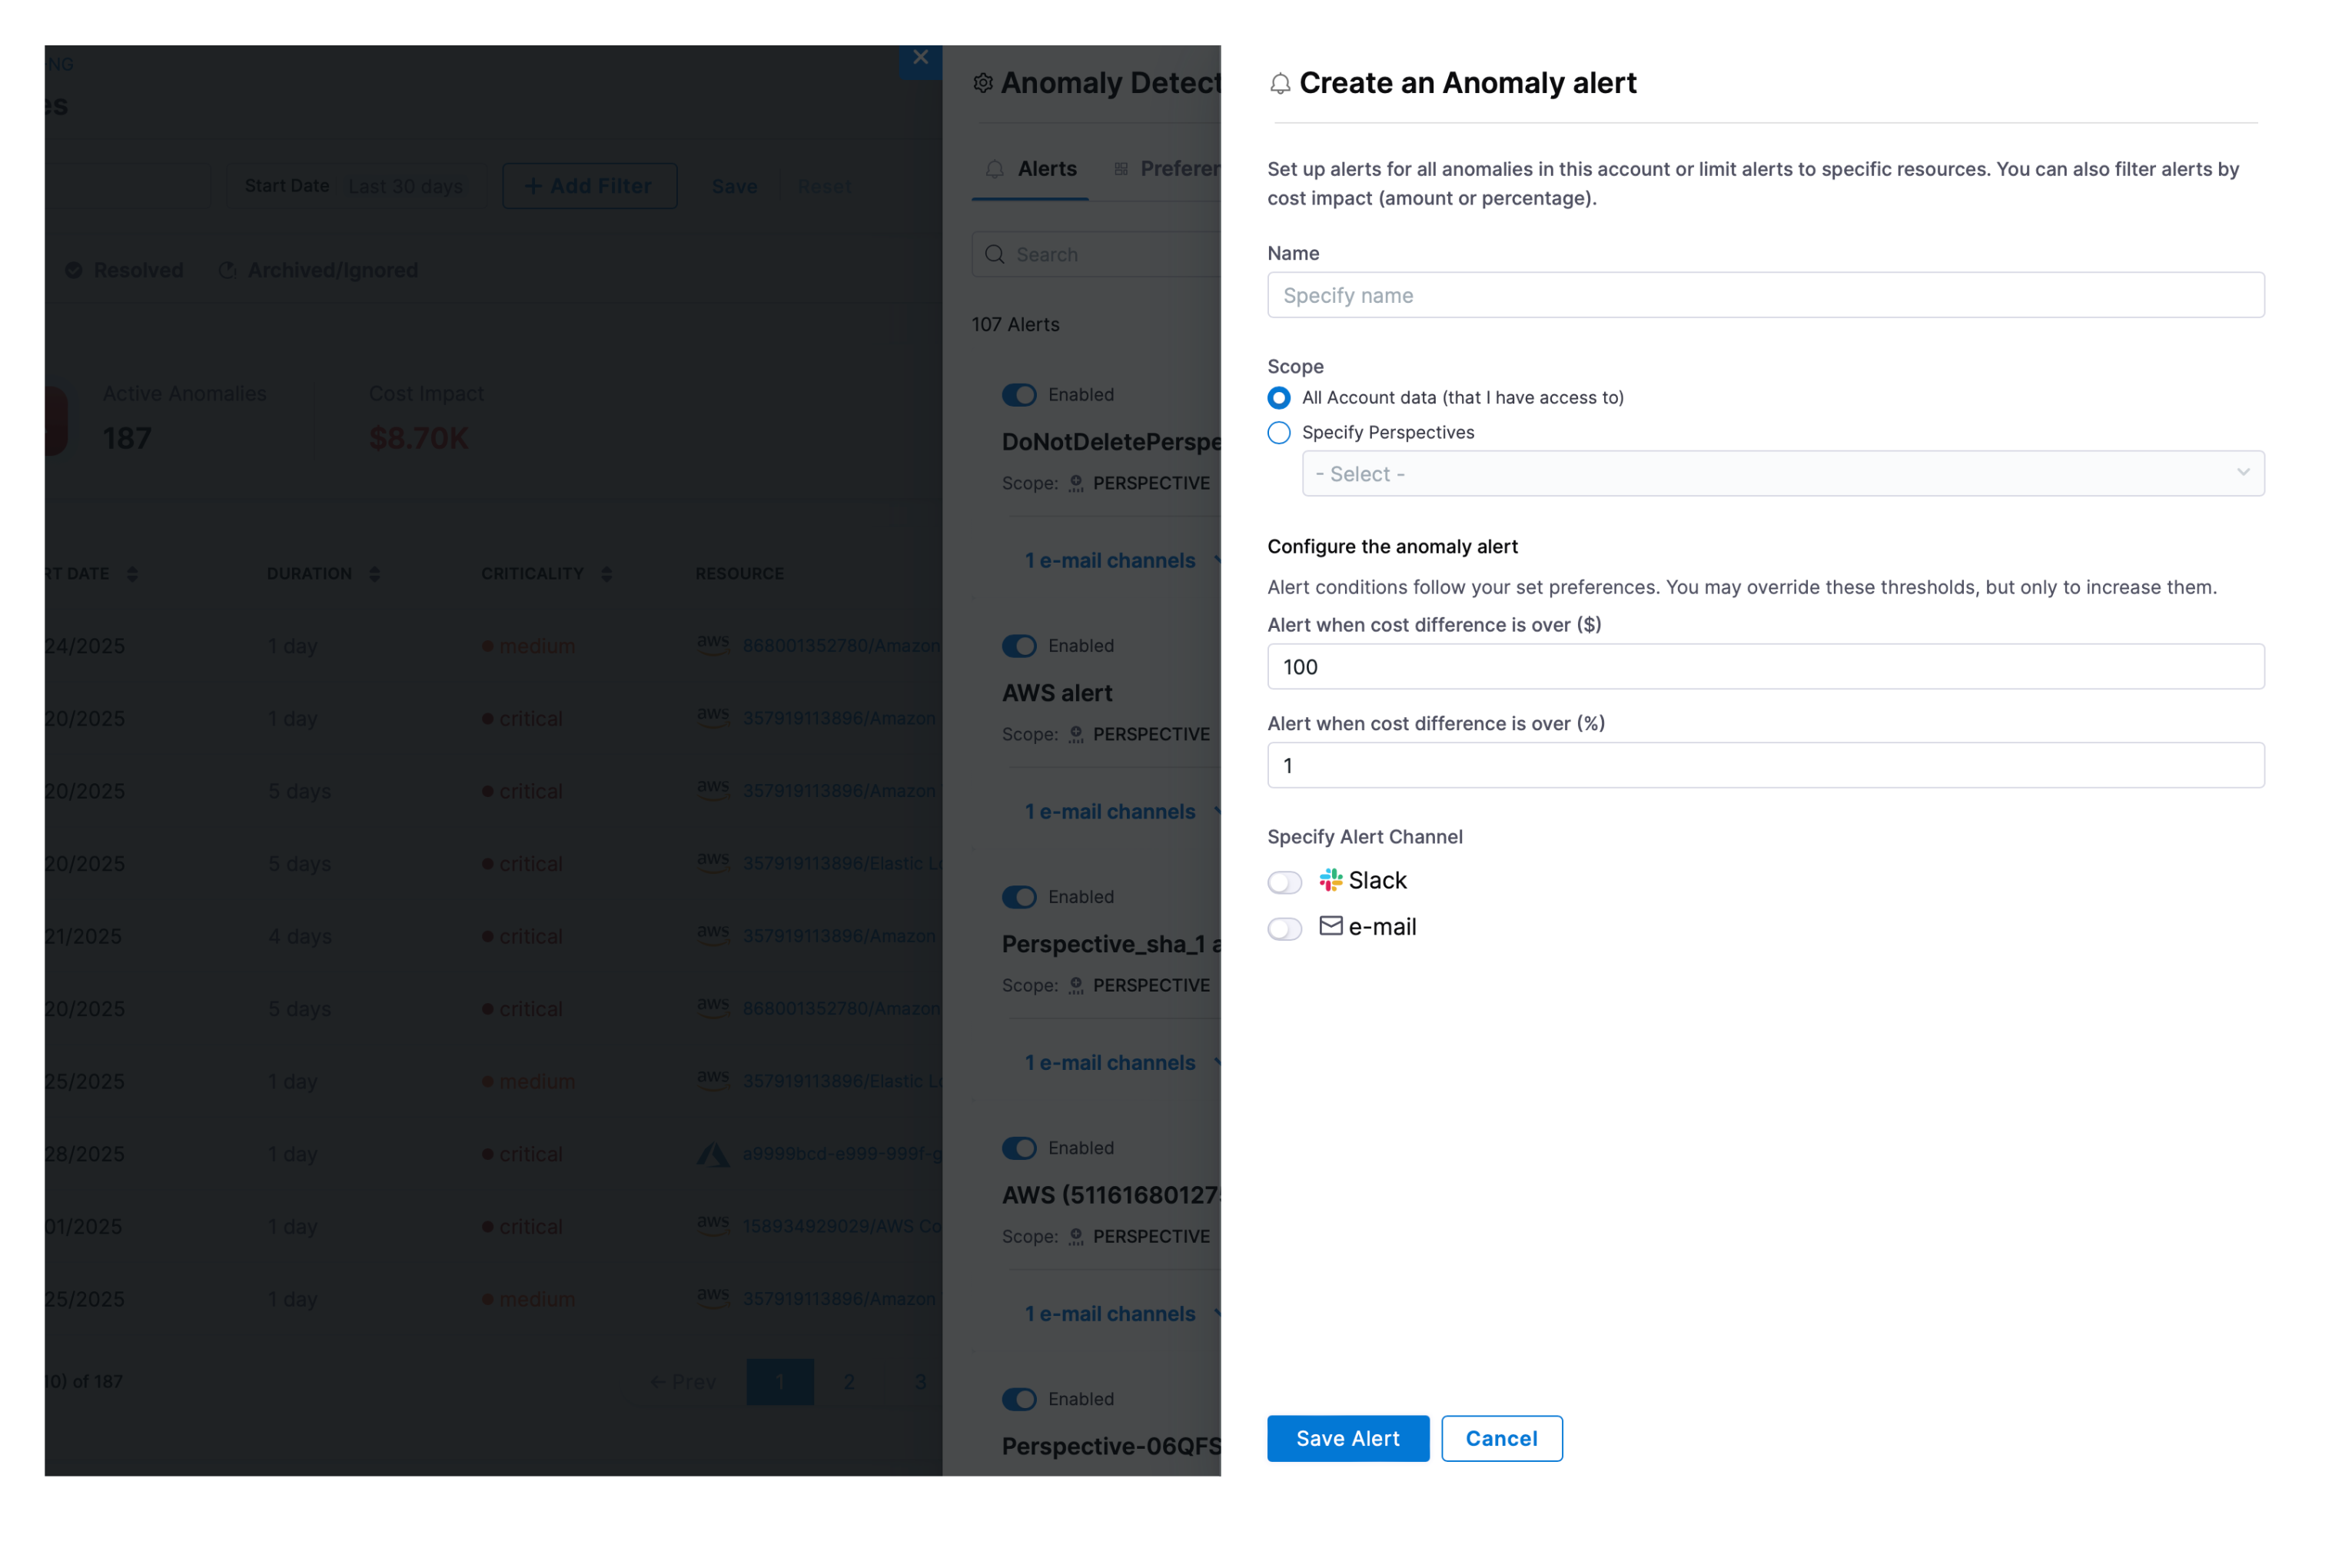
Set up alerts to receive notifications when anomalies are detected without having to check the dashboard. Configuration Options available:
Scope: Select all account data or specific perspectives for anomaly alerts.
Configure the anomaly alert: Alert conditions follow your set preferences. You may override these thresholds, but only to increase them. Currently, the user can set thresholds for “Alert when cost difference is over ($)” and/or “Alert when cost difference is over (%)” depending on whether they want to define a specific cost amount or a cost percentage.
Alert Channel: Currently, Harness CACM supports Slack and/or e-mail as possible methods of sending alerts.

Anomaly Preferences
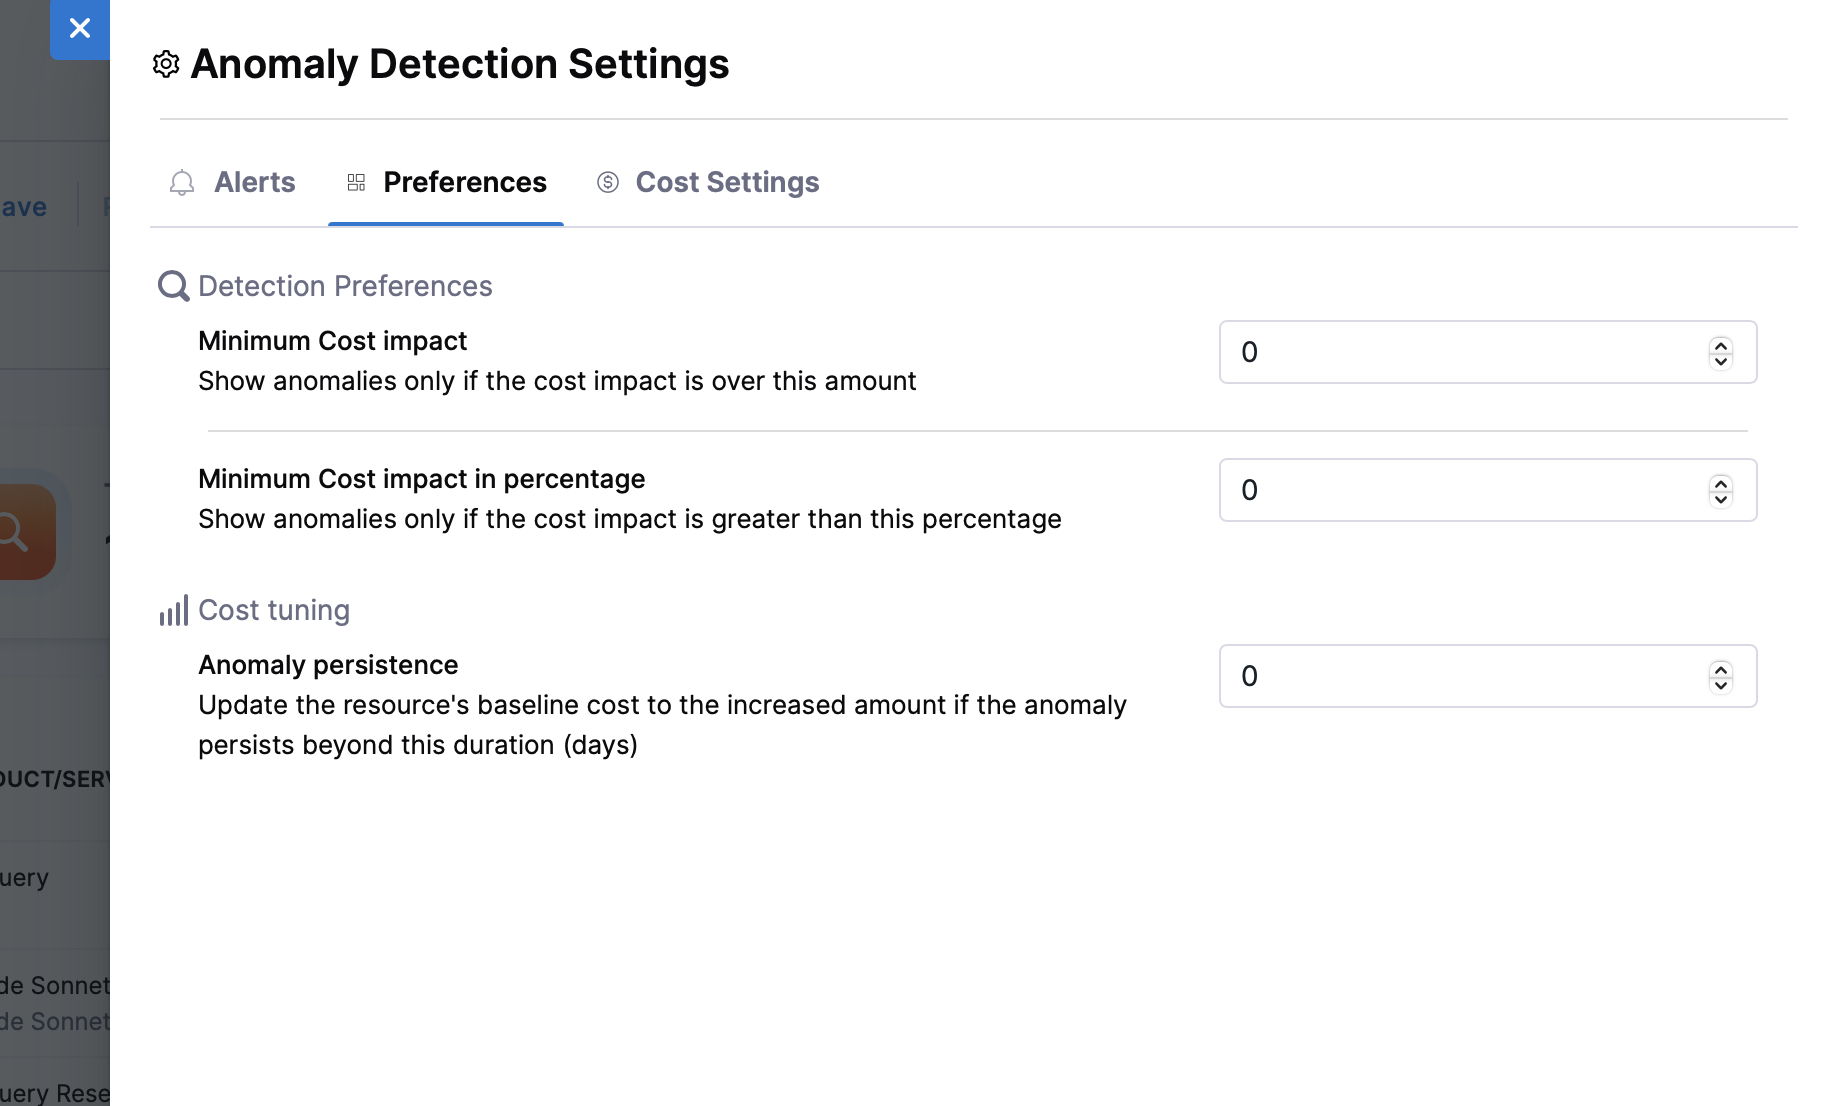
Configure system-wide anomaly detection settings to ensure only significant anomalies are flagged:

Available Settings:
Minimum Cost Impact (Amount): This setting allows you to set a threshold for the cost impact in USD, meaning that anomalies will only be shown if the financial impact exceeds the specified amount.
Minimum Cost Impact (Percentage): Similar to the above, this setting enables you to define a threshold based on the percentage of cost increase. Anomalies will only be flagged if the cost increase exceeds the specified percentage of the baseline cost.
Anomaly Persistence: This setting allows the system to adjust the baseline cost of a resource if an anomaly persists beyond a specified number of days. If an anomaly is not resolved and continues to impact costs for the set duration, the resource's baseline cost is updated to reflect the higher cost. This helps maintain an accurate representation of the resource's true cost over time, ensuring that future anomalies are detected against the adjusted baseline.
Anomaly Ignore List

The Anomaly Ignore List allows you to exclude expected cost patterns from anomaly detection. By creating ignore list rules, you can prevent false positives for known cost behaviors, ensuring your team focuses on genuine anomalies that require attention.
Common use cases include:
Development and test environments – Exclude accounts or resources where cost fluctuations are expected
Scheduled scaling events – Prevent alerts for planned auto-scaling activities
Reserved Instance or Savings Plan purchases – Avoid false anomalies from one-time commitment purchases
Seasonal workloads – Exclude resources with known periodic cost variations
Data processing jobs – Filter out batch processing workloads with variable costs
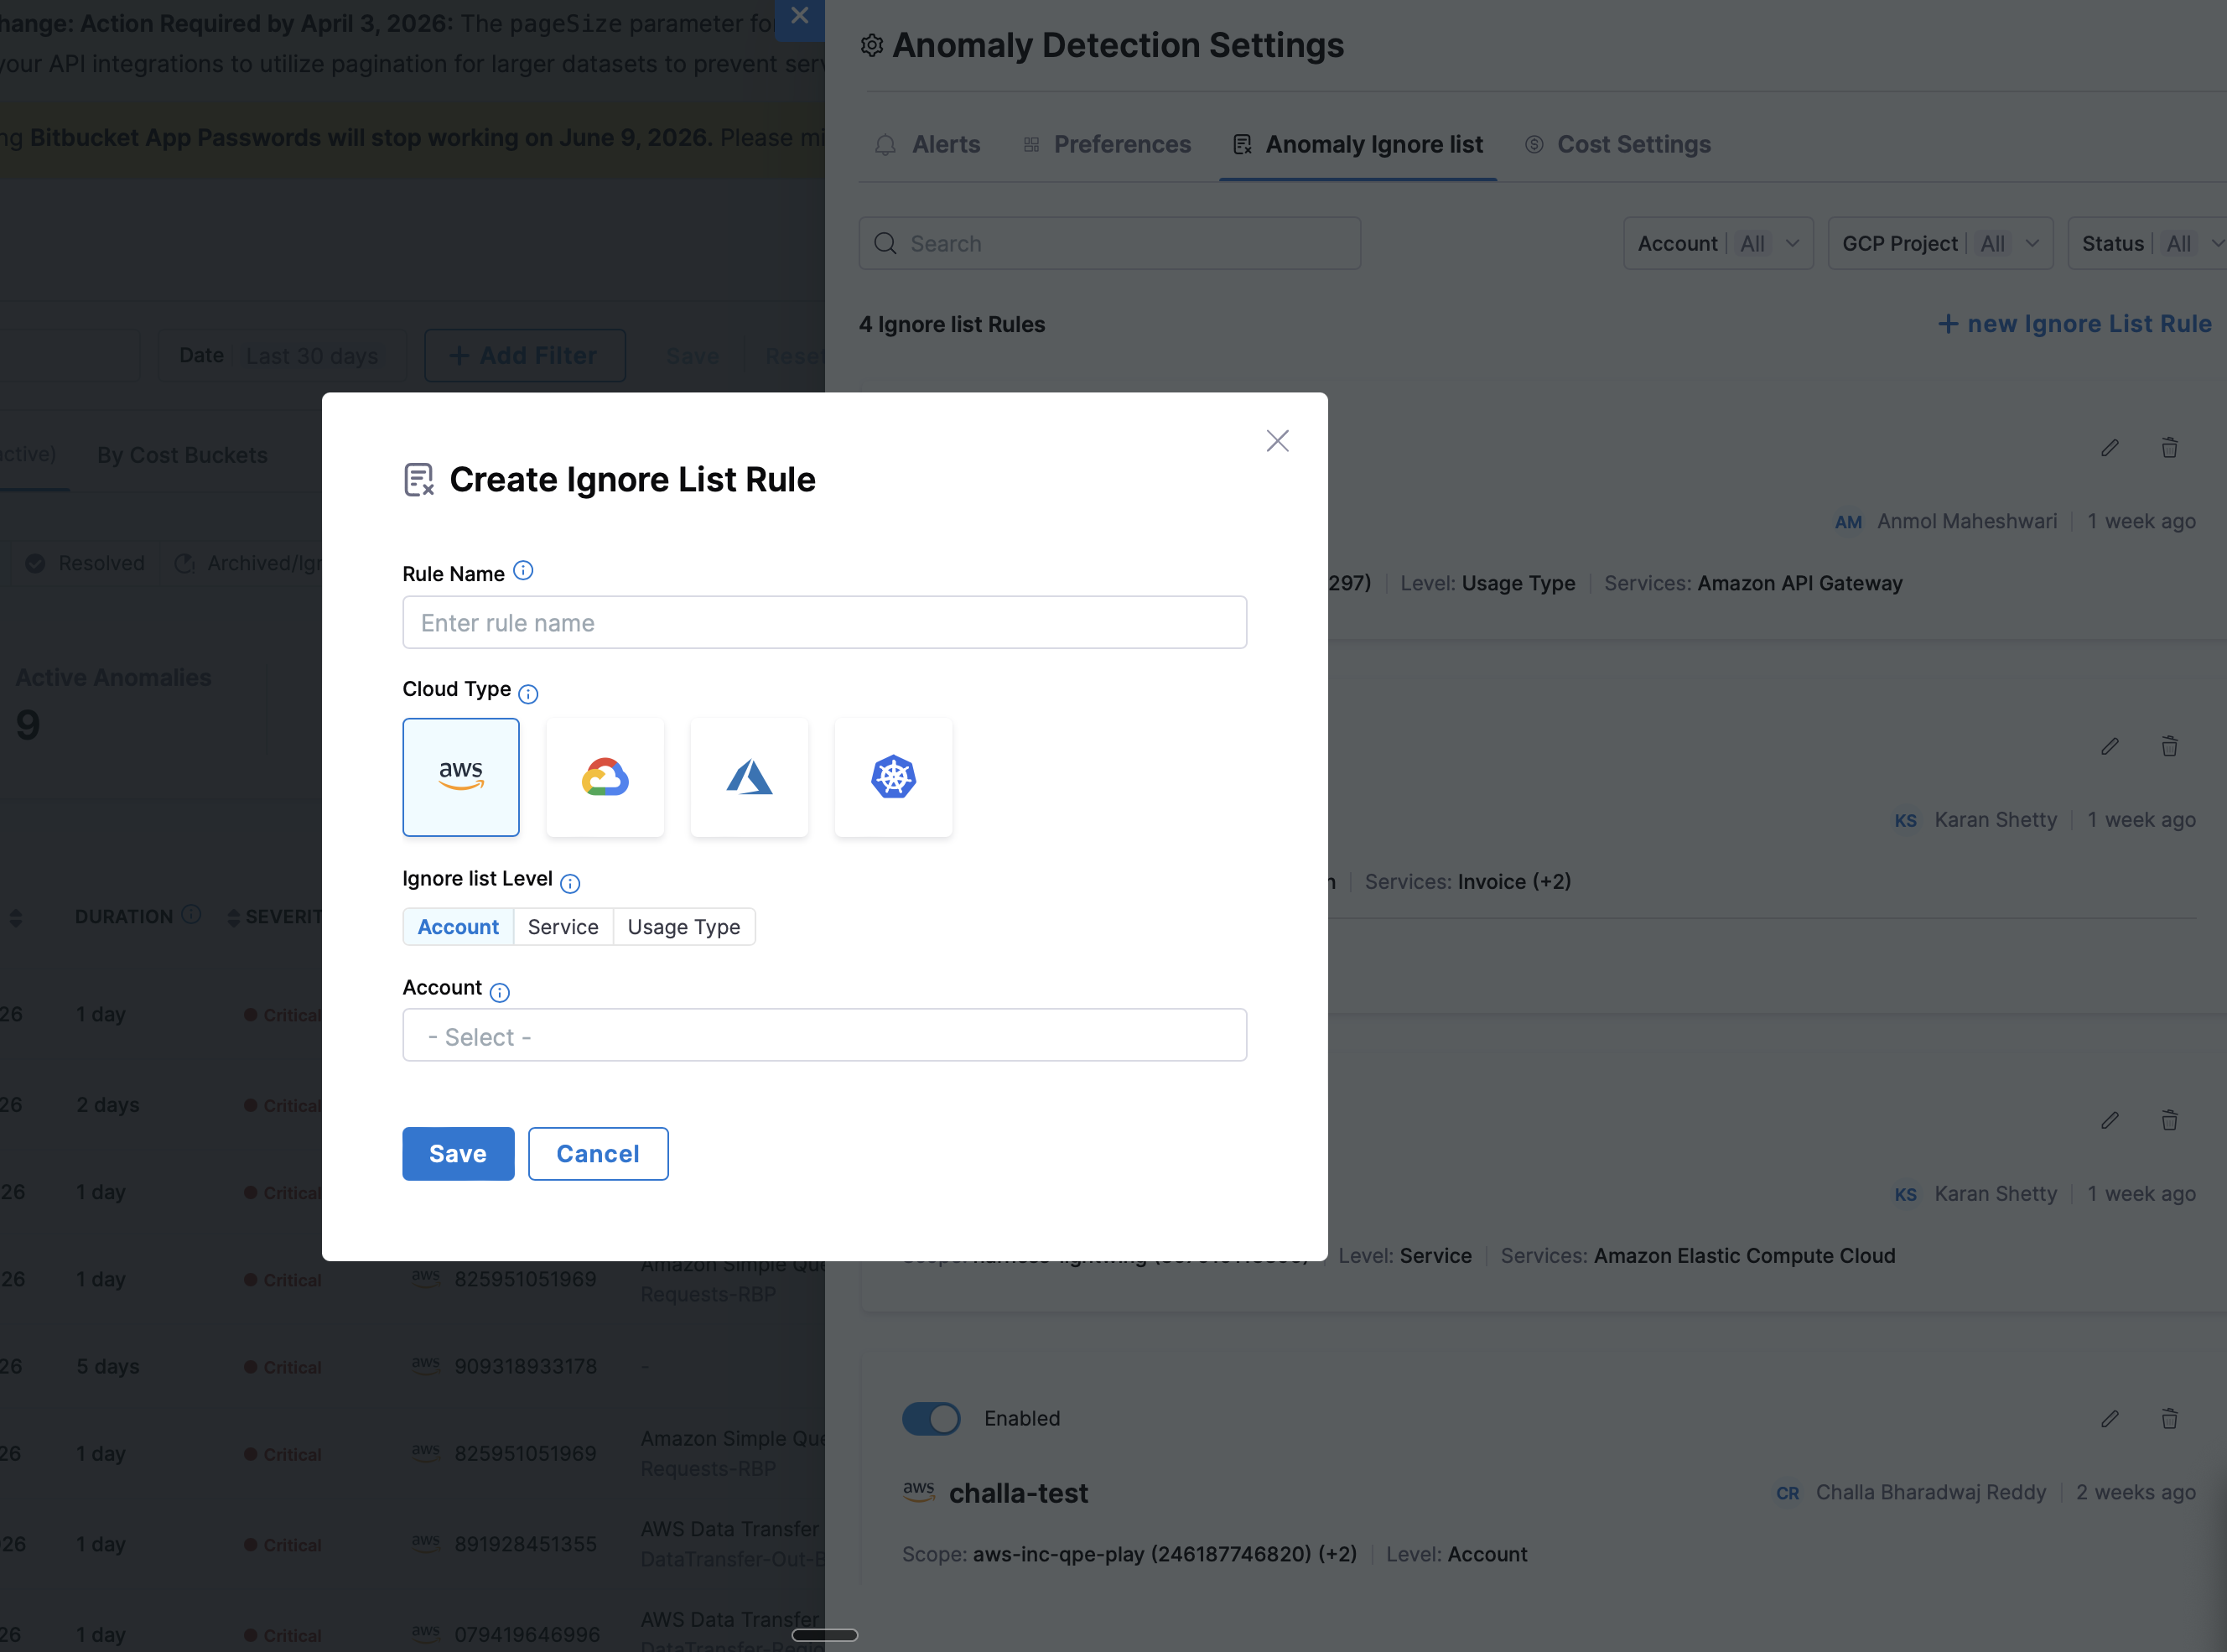
Creating an Ignore List Rule
From the Anomaly Ignore list tab, click + new Ignore List Rule.
Rule Name: Enter a descriptive name for your rule (e.g., "Dev Environment - US East", "Batch Processing Jobs").
Cloud Type: Select the cloud provider for this rule:
AWS
GCP
Azure
Kubernetes Cluster
Ignore List Level: Choose the granularity of the rule. Available levels vary by cloud provider:
AWS
Account, Service, Usage Type
GCP
Project, Product, SKU Description
Azure
Subscription, Meter Category
Kubernetes
Cluster, Namespace, Workload
Level descriptions:
Account/Project/Subscription/Cluster – Ignores all anomalies for the selected accounts
Service/Product/Meter Category/Namespace – Ignores anomalies for specific services within accounts
Usage Type/SKU Description/Workload – Ignores anomalies at the most granular level
Scope Selection: Depending on your selected level, choose the scope:
All Accounts/Projects/Subscriptions/Clusters – Applies the rule across all resources of the selected cloud type
Specific Accounts/Projects/Subscriptions/Clusters – Select individual resources to include in the rule When selecting Service or Usage Type levels, you can further narrow the scope by selecting specific services and usage types.
Save the Rule: Click Save to create the rule. The rule takes effect immediately and applies to future anomaly detection.
Managing Ignore List Rules

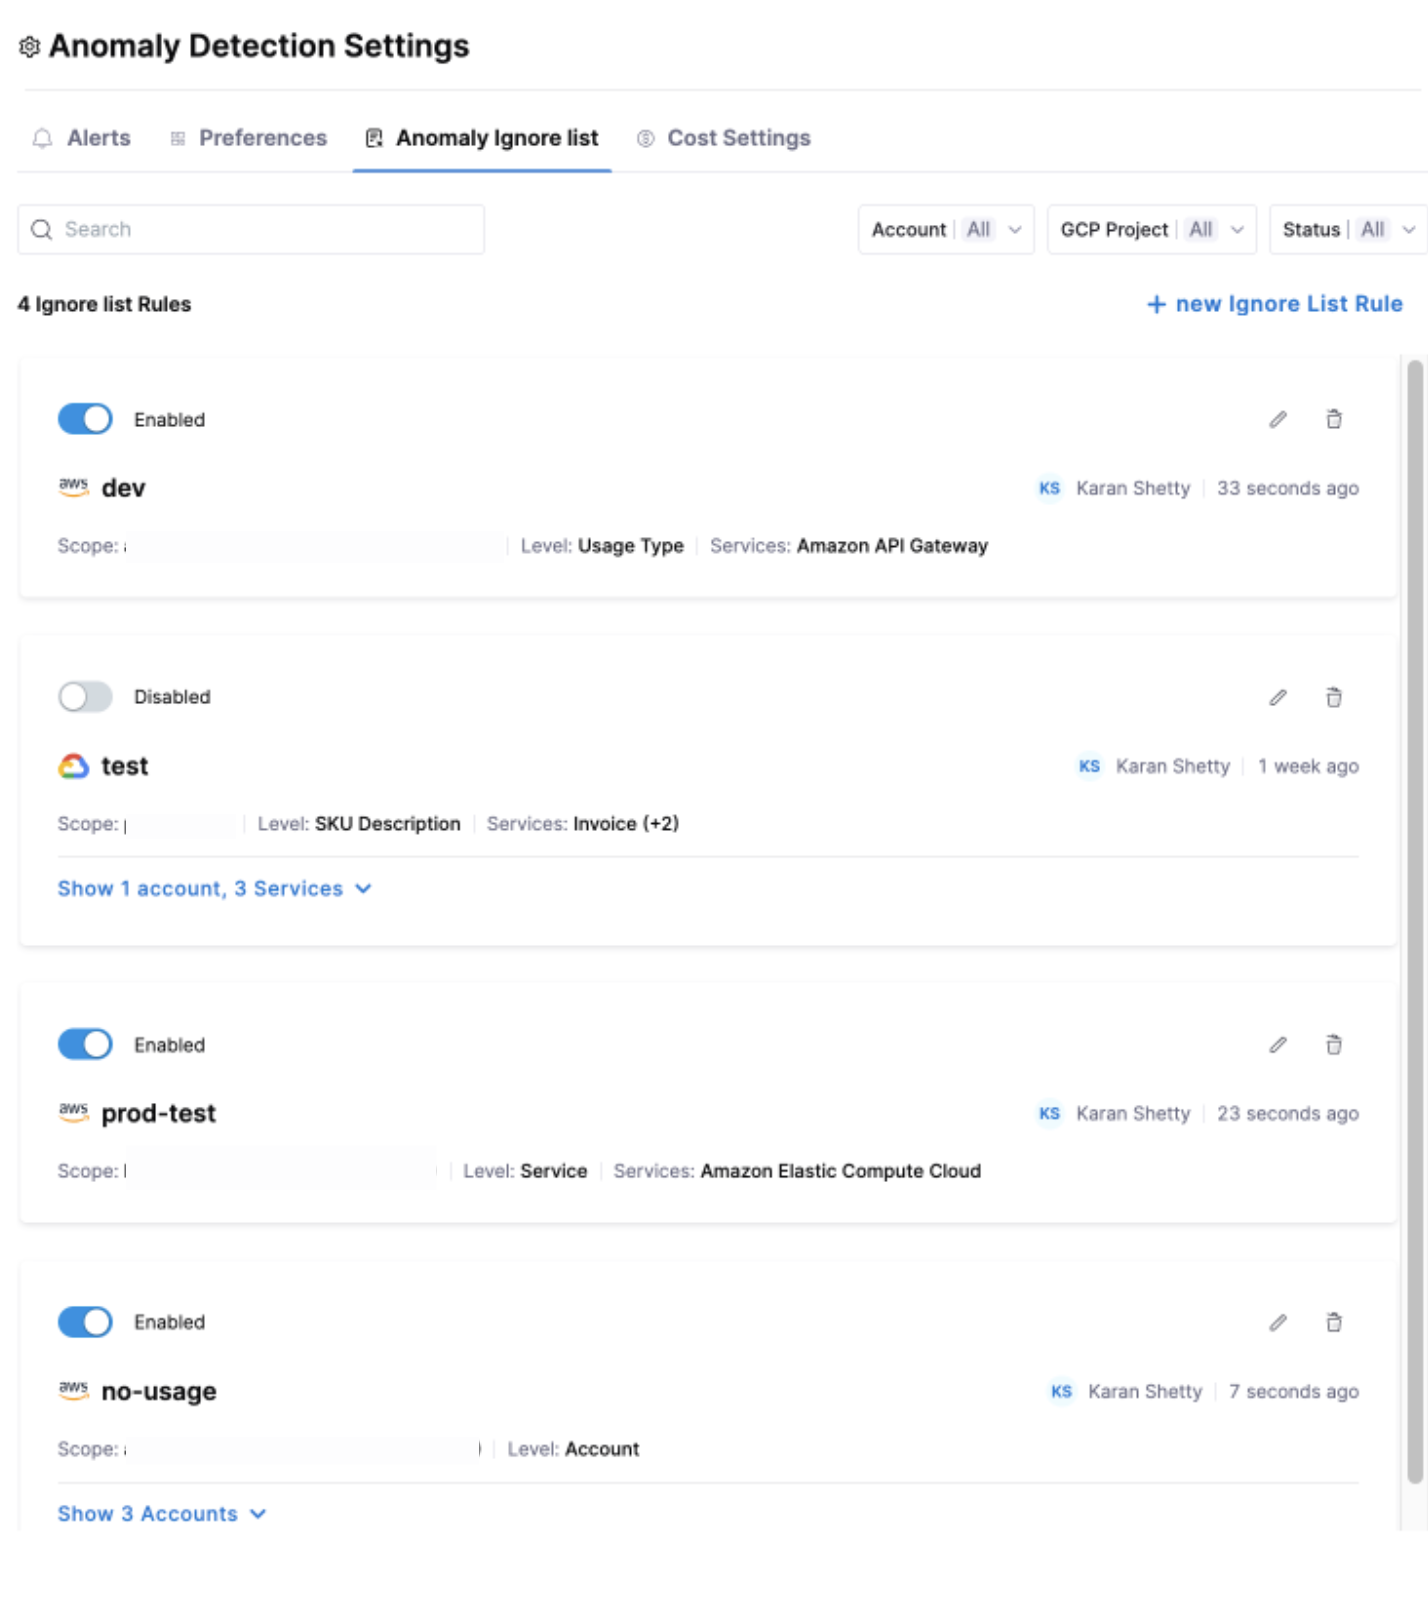
Viewing Rules
The Ignore List tab displays all your rules as cards showing:
Rule name and cloud provider icon
Enabled/Disabled status
Scope (accounts covered)
Level (Account, Service, or Usage Type)
Services included (if applicable)
Last modified by and timestamp
Filtering Rules
Use the filters at the top of the list to find specific rules:
Search – Filter by rule name
Account/Subscription/Project/Cluster – Filter by cloud account (filters appear based on your existing rules)
Status – Show All, Enabled, or Disabled rules
Enabling/Disabling Rules
Toggle the switch on any rule card to enable or disable it. Disabled rules remain saved but do not affect anomaly detection.
Editing Rules
Click the Edit icon (pencil) on a rule card to modify:
Rule name
Account scope (All or Specific)
Selected accounts, services, or usage types
Deleting Rules
Click the Delete icon (trash) on a rule card. Confirm the deletion in the dialog that appears.
Deleting a rule is permanent. Previously ignored anomalies will not be retroactively flagged.
How Ignore List Rules Work
When an ignore list rule is enabled:
CACM's anomaly detection engine evaluates each potential anomaly against your active rules
If an anomaly matches a rule's criteria (cloud provider, account, service, usage type), it is excluded from detection
Excluded cost patterns do not appear in your Active anomalies list
The rule applies to all future anomaly detection cycles
Rule Matching Logic
Rules match based on a hierarchical structure:
Account-level rules ignore all anomalies for the specified accounts
Service-level rules ignore anomalies only for the specified services within the specified accounts (or all accounts if "All" is selected)
Usage Type-level rules provide the most granular control, ignoring only specific usage types within specific services and accounts
Cost Settings

Cost Settings allow you to configure how costs are displayed for anomaly detection. These settings inherit from your Account Settings defaults, but you can override them here to apply only to the anomaly detection feature.
Currently, the following cost settings are available:
Show AWS Costs as: Choose how AWS costs are calculated and displayed:
Amortized: Spreads upfront and recurring reservation costs across the billing period
Net-amortized: Amortized costs after applying discounts and credits
Unblended: Costs as they appear on your AWS bill without any modifications
Blended: Average cost across all accounts in a consolidated billing family
Effective: Actual costs after applying all discounts, credits, and savings plans
Show Azure Costs as: Choose how Azure costs are calculated and displayed:
Actual: The actual costs incurred without any adjustments
Amortized: Spreads reservation costs across the usage period
FAQs
Last updated
Was this helpful?