> For the complete documentation index, see [llms.txt](https://developer.harness.io/llms.txt). Markdown versions of documentation pages are available by appending `.md` to page URLs; this page is available as [Markdown](https://developer.harness.io/cloud-cost-management/cost-optimization/cluster-orchestrator-for-aws-eks-clusters/getting-started.md).
# Get Started
Learn how to enable and configure Cluster Orchestrator for your EKS clusters
{% hint style="info" %}
**Behind a Feature Flag**
Cluster Orchestrator is behind a feature flag. Contact [Harness Support](mailto:support@harness.io) to have the `CCM_CLUSTER_ORCH` flag enabled for your account.
{% endhint %}
Cluster Orchestrator is designed for quick implementation with minimal configuration. You can be up and running in just three simple steps:
1. **Connect** your AWS EKS cluster
2. **Configure** your optimization preferences
3. **Activate** the orchestration
## Compatibility matrix
| Cluster Orchestrator Version | Kubernetes | Karpenter |
| ---------------------------- | ---------- | --------- |
| Till `0.6.0` | 1.32 | 1.2.4 |
| `0.7.0` | 1.33 | 1.7.3 |
| `beta-0.7.0` | 1.34 | 1.8.0 |
| `0.9.0` | 1.34 | 1.8.2 |
## Prerequisites
* [Harness Kubernetes connector](https://developer.harness.io/harness-ai/use-harness-platform/connectors/cloud-providers/add-a-kubernetes-cluster-connector)
* AWS CLI: 2.15.0 or higher (for [kubectl](/cloud-cost-management/cost-optimization/cluster-orchestrator-for-aws-eks-clusters/enablement-methods/kubectl.md))
***
## Quick start
{% hint style="info" %}
**IMPORTANT**
Cluster Orchestrator does not automatically manage DaemonSet scheduling. You must add tolerations to your DaemonSets manually.Go to [DaemonSet troubleshooting](/cloud-cost-management/cost-optimization/cluster-orchestrator-for-aws-eks-clusters/troubleshooting.md) to add tolerations manually.
{% endhint %}
1. Log in to [Harness](https://app.harness.io) and go to **Cloud Costs** → **Cluster Orchestrator**
2. If you do not have a Kubernetes connector, click on "Add New Cluster" else follow step 5.
3. Click on "New Cluster/Cloud Account", then select "Kubernetes". You can create a Kubernetes Connector through two methods:
* [Quick Create](/cloud-cost-management/new-to-cacm/quickstart.md)
* [Advanced](/cloud-cost-management/new-to-cacm/quickstart.md)
4. After this, your created connector will show up on the home page of Cluster Orchestrator.
5. Choose an enablement method and follow the steps listed on the respective pages:
* **Onboard with a single command via kubectl**: [Details](/cloud-cost-management/cost-optimization/cluster-orchestrator-for-aws-eks-clusters/enablement-methods/kubectl.md)
* **Terraform and Helm installation for advanced installation options**: [Details](/cloud-cost-management/cost-optimization/cluster-orchestrator-for-aws-eks-clusters/enablement-methods/setting-up-co-helm.md)
***
## Cluster Orchestrator homepage
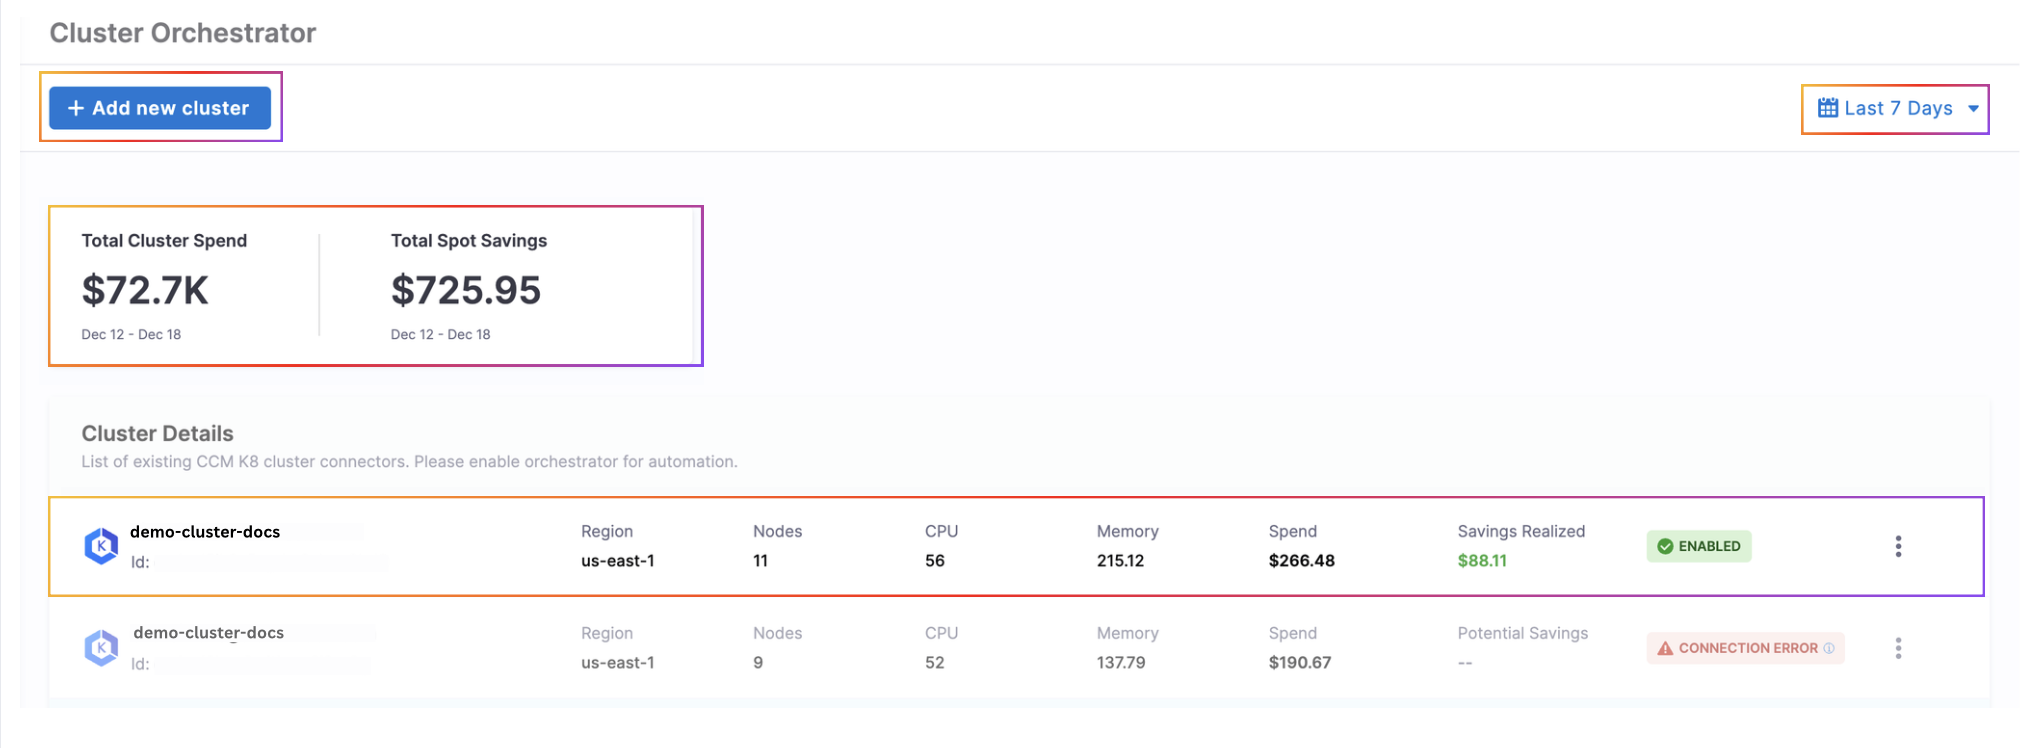
The Cluster Orchestrator homepage provides a comprehensive dashboard of your Kubernetes infrastructure costs, savings, and cluster status. This centralized view helps you monitor the financial impact and operational status of your optimization efforts across all managed clusters.
Cluster Orchestrator Homepage
The homepage displays the following key information:
* **Total Cluster Spend**: The aggregate cost of all your Kubernetes clusters over the selected time period. This includes all compute resources (instances/nodes) used by your clusters, giving you visibility into your overall cloud spending for this infrastructure. This metric serves as your baseline for measuring cost optimization success.
* **Total Spot Savings**: The amount of money saved by using spot instances instead of on-demand instances. Spot instances typically cost 70-90% less than on-demand instances, and this metric quantifies those savings, helping you understand the ROI of the Cluster Orchestrator's optimization strategies. It is calculated as the difference between what you would have paid using only on-demand instances versus your actual costs with spot instances.
* **Time Period Selector**: A dropdown menu that allows you to filter the displayed metrics for specific periods (e.g., last 7 days, last 30 days, custom date range).
* **Cluster Details Table**: A comprehensive view of all your managed clusters with the following information for each:
* **Name**: The user-defined name of the cluster
* **ID**: The unique identifier for the cluster
* **Region**: The cloud region where the cluster is deployed
* **Nodes**: The total number of nodes currently running in the cluster
* **CPU**: Total CPU resources available in the cluster
* **Memory**: Total memory resources available in the cluster
* **Spend**: The cost associated with this specific cluster during the selected time period
* **Savings Realized**: The amount saved through optimization for this cluster
* **State**: Whether cluster orchestrator is currently enabled or disabled for this cluster or if there is a configuration error. Usually configuration error is due to error in successfully establishing connection with the cluster while setting up cluster Orchestrator.
* **Actions**: Buttons to reconfigure orchestrator settings, delete the orchestrator, or disable/enable orchestrator
{% @harness-feedback/feedback %}