For the complete documentation index, see llms.txt. This page is also available as Markdown.

Cost Explorer

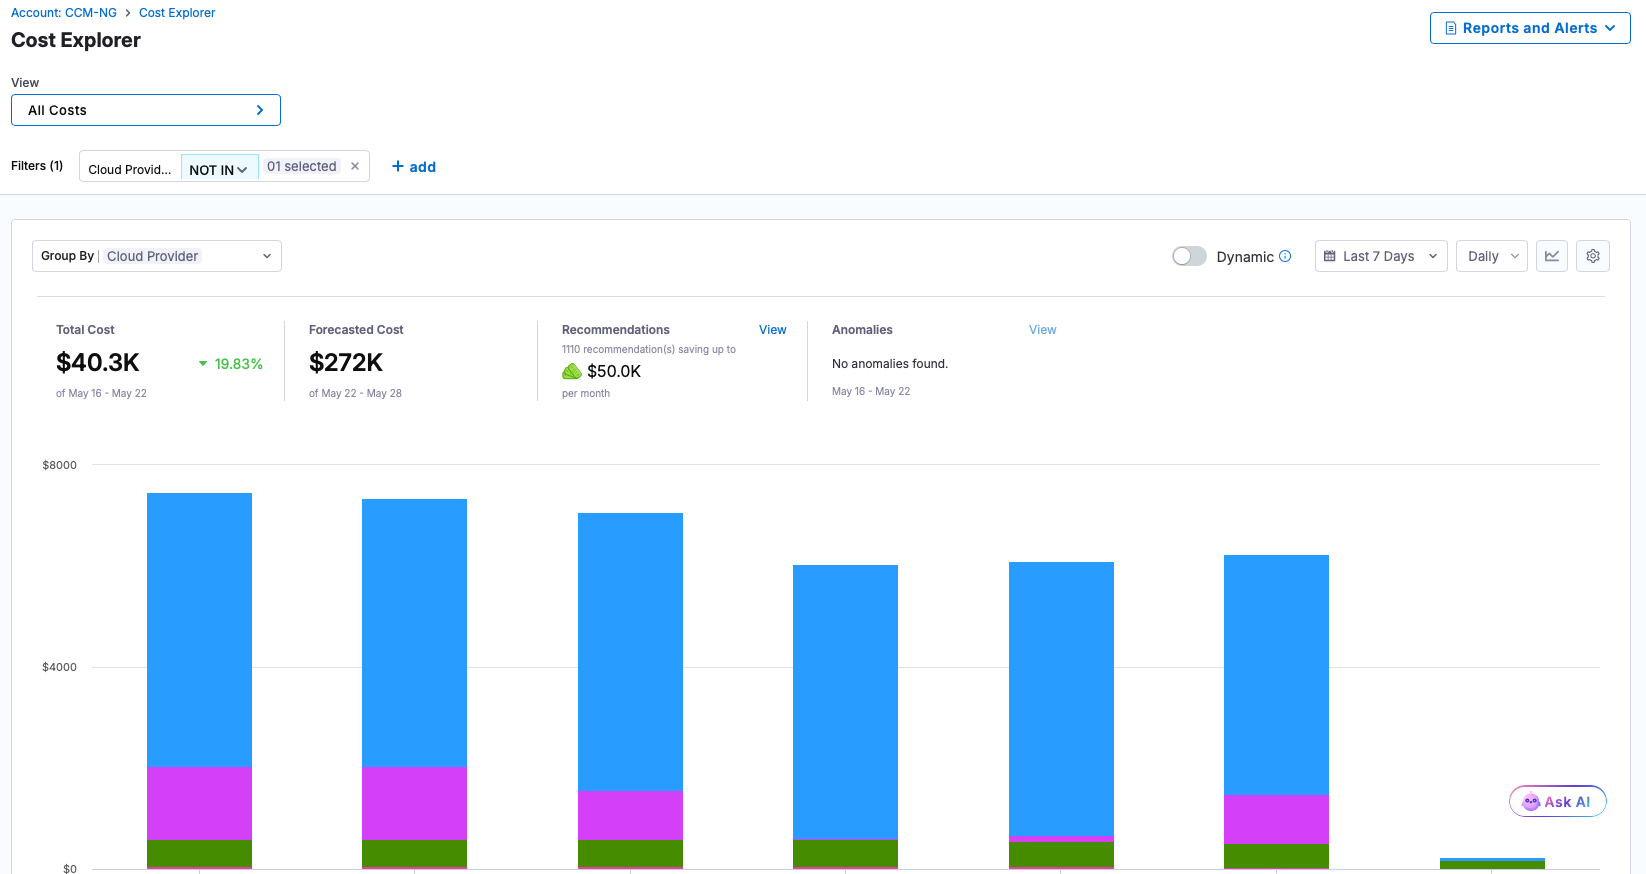
Cost Explorer allows you to group your resources in ways that are more meaningful to your business needs.

Cost Explorer is the next-generation cost analysis interface in Harness Cloud & AI Cost Management (CACM). It provides a streamlined, modern experience for exploring and analyzing your multi-cloud spending through customizable views, advanced filtering, and flexible data visualization.

Cost Explorer is built on top of the existing Perspectives infrastructure but offers a redesigned user experience focused on faster exploration and easier view management.

To switch and use, jump directly to Switching between Cost Explorer and Perspectives.

Drilldown

View-Based Navigation

Cost Explorer introduces a view-centric approach to cost analysis:

  • Views replace the traditional perspective concept with a more intuitive interface

  • Select any saved view from the View Selector dropdown

  • Quick access to recently used views

  • Seamless switching between views without page reloads

Click to view full size image

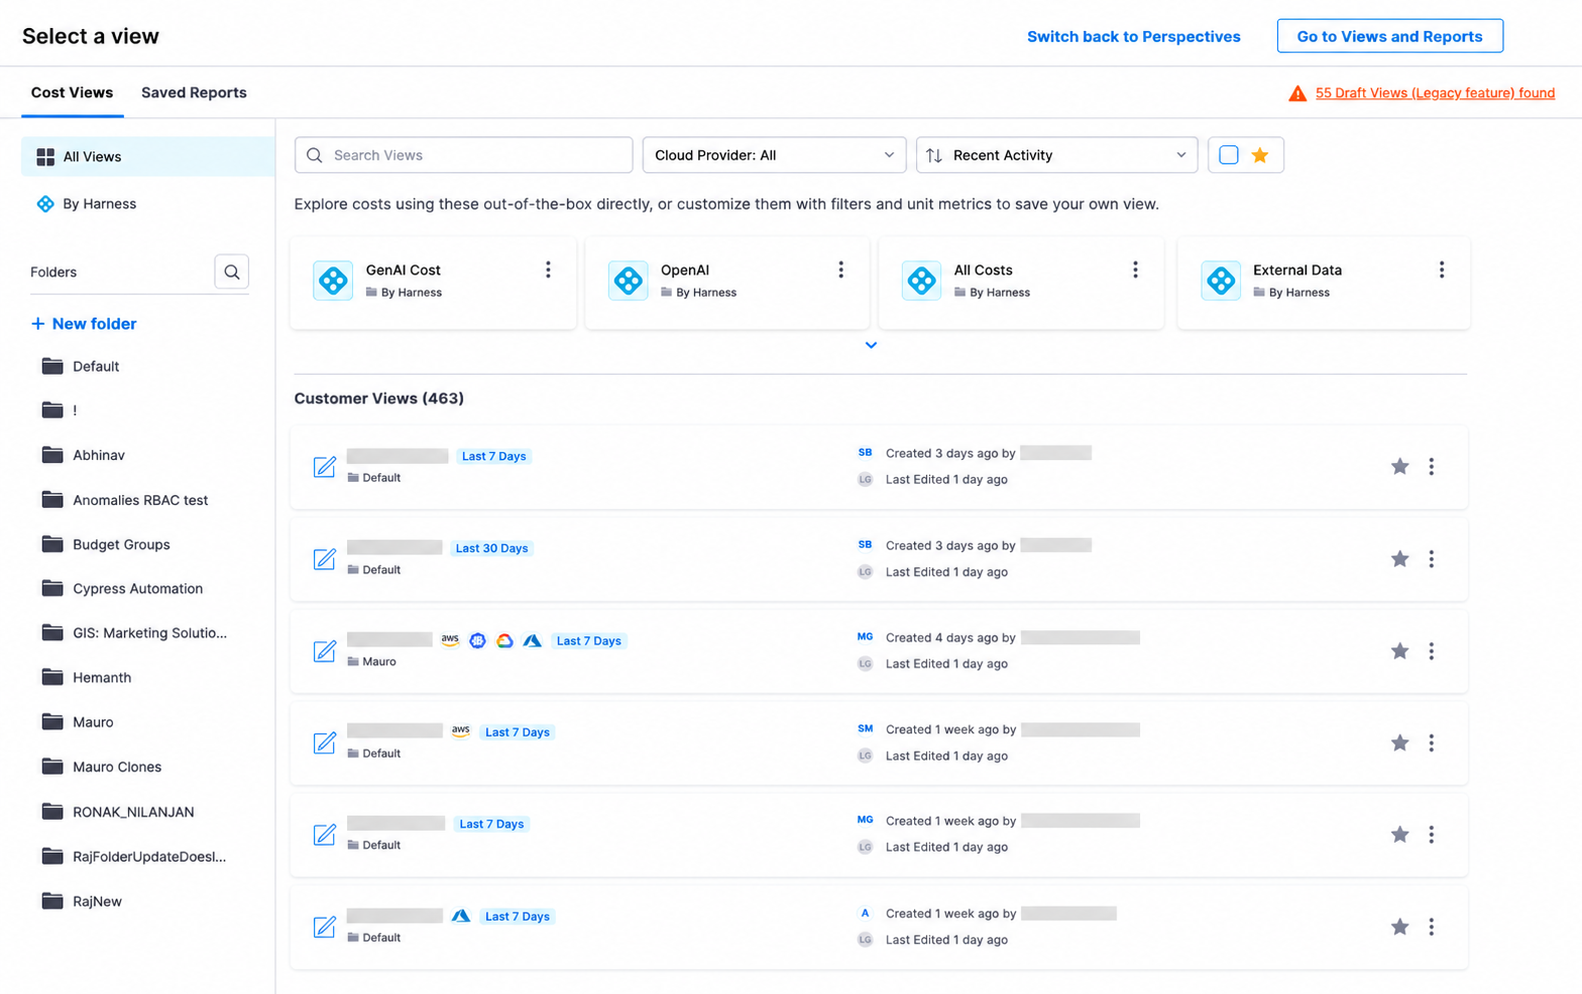
Views Explorer Drawer

Access all your views through the Views Explorer Drawer:

  • Cost Views Tab: Browse all available views organized by folders

  • Saved Reports Tab: Access previously saved reports

  • Quick Search: Find views by name across all folders

  • Folder Navigation: Browse views organized in folder structure

Click to view full size image

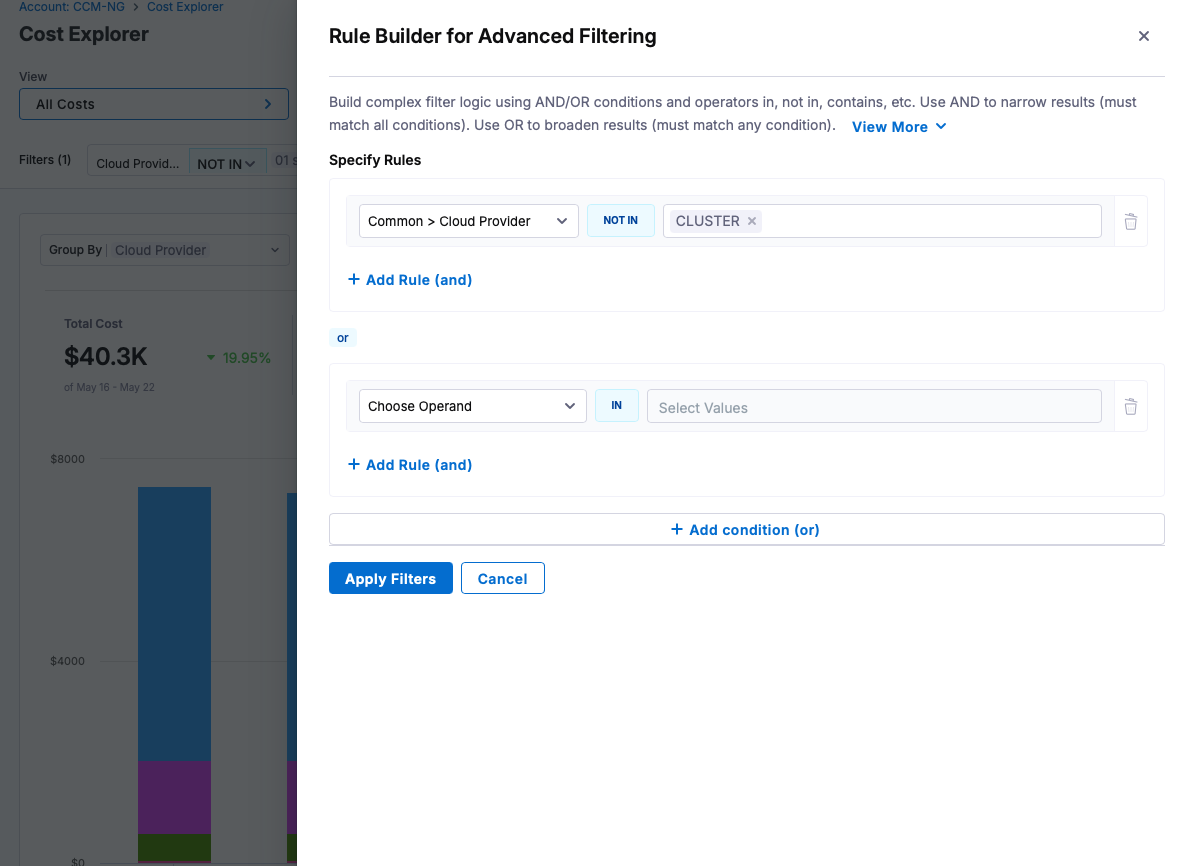
Advanced Filter Rule Builder

Click to view full size image

Create complex filter logic using the Advanced Filter Drawer:

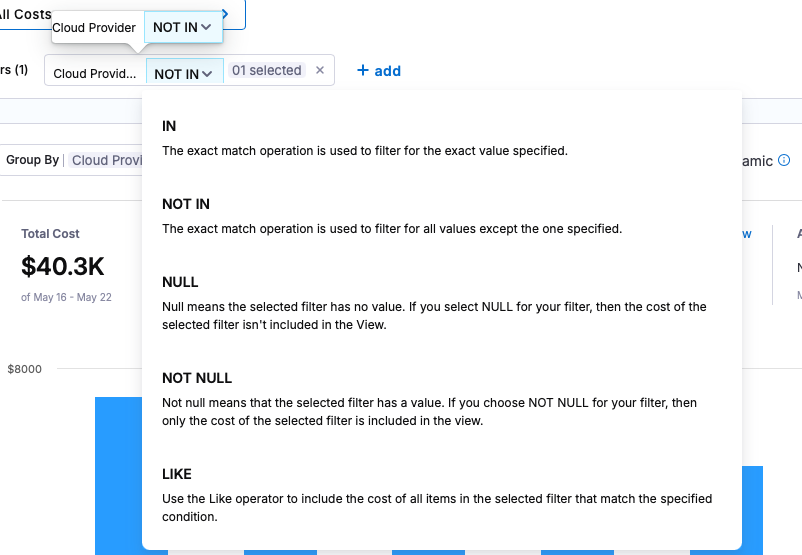
Filter Operators

  • IN: Include only resources that exactly match the specified value

  • NOT IN: Include all resources except those that match the specified value

  • NULL: Include only resources where this field has no value (excludes resources with this field)

  • NOT NULL: Include only resources where this field has a value

  • LIKE: Include resources where the field partially matches a pattern (uses regular expressions)

    • For exact pattern matching, use ^pattern$ syntax

Click to view full size image

Using the Rule Builder

  1. Click "add advanced filter" o the filter chip to open the drawer

  2. Add conditions using the field selector and operator dropdown

  3. Add multiple conditions within a rule (AND logic)

  4. Add multiple rules (OR logic between rules)

  5. Click "Apply Filters" to execute

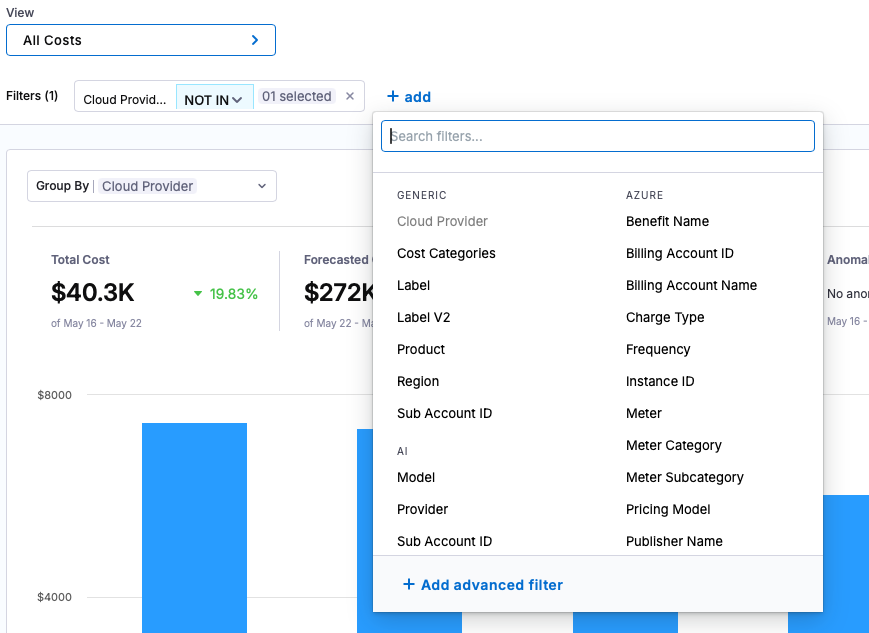
Inline Filter Chips

For simple filtering, use the inline filter chips:

  • Click "add" to add a new filter

  • Select field, operator, and values

  • Multiple filters are combined with AND logic

  • Click the chip to modify or remove

  • Switch to Advanced Filter for complex OR logic

Click to view full size image

Unit Costs

Track cloud cost per unit of business value - cost per customer, per transaction, per GB processed, or as a percentage of revenue. Unit Cost Metrics layer your business KPIs on top of Harness Cloud Cost Management so engineering, finance, and product teams can measure efficiency, not just spend.

A Unit Cost Metric is a saved, reusable computation that combines:

  • Your cloud and AI cost data (already in Harness CCM, sliced by any Perspective filter).

  • Custom business metrics that you ingest into Harness (e.g., active users, API calls, GB processed, revenue).

The result is rendered inside Cost Explorer as:

  • A summary card above the chart with the aggregate value for the current time range.

  • A chart overlay series plotted alongside the cost columns/lines, with its own axis formatted for currency or percentage.

Check Unit Cost Metrics documentation for more details.

Adding a Unit Cost Metric in Cost Explorer

  1. Open a Perspective in Cost Explorer.

  2. In the toolbar, look for the Unit Costs (N) picker next to filters.

  3. Click + Add Unit Cost and configure the metric:

    • Give it a display name.

    • Choose a result type — Cost or Percentage.

    • Configure the numerator (and optionally the denominator).

  4. Apply the metric. It appears immediately as a chart overlay and summary card.

  5. Click Save view to persist the metric set with the Perspective.

Up to 5 unit metrics can be attached to a single Perspective.

Configuring Operands

For each operand (numerator and denominator), choose one of:

  • Cost — Optionally add filters (cloud provider, account, service, label, etc.) to scope which cost goes into this side of the calculation. With no filters, the operand uses the Perspective's cost total. This kind tells Harness to use cloud or AI cost as the operand value, scoped to the current Perspective.

  • Metric — Select a registered business metric from the list. The metric's default aggregation is used unless overridden. This kind references a business metric you've already registered under Cloud Integrations → Unit Cost. (See the separate setup guide; Cost Explorer can only consume metrics that already exist.)

  • Formula — Combine multiple cost and/or metric inputs (see Formula Rules. Use this when no single Cost or Metric value is enough — e.g., chargeback splits, weighted blends, or "subtract one slice from another". Each input is itself an operand row and can be Cost or Metric but not another Formula

    In the Formula bar you can input single-line text input where you write the expression using the input letters. Allowed syntax

    • Operators: +, - between inputs.

    • Multiplier: * followed by a positive numeric literal (e.g., * 1.5, * 0.25), applied to a single input.

    • Parentheses: allowed for grouping.

    • Each input must appear exactly once and in declaration order (a before b before c).

The cost portion of every metric in this drawer is automatically scoped to the current Perspective. Filters you add are applied on top of the Perspective's filters, not instead of them.

Without a denominator, the metric simply plots the numerator's value (useful when you want to track a filtered slice of cost alongside the main Perspective).

  • The ÷ Divided by divider appears between numerator and denominator when a denominator exists.

  • An × icon next to the denominator removes it, collapsing the card back to a single operand.

  • Division-by-zero / empty data is handled by the denominator's empty-value rule (for Metric kind) or simply skipped at that data point (for Cost kind).

Formula Rules

When you build a Formula operand, the expression is restricted to keep results deterministic and efficient:

  • Allowed operators: +, -, and * between an input and a numeric multiplier (e.g., a * 1.5).

  • Not allowed: division (/), or multiplying two inputs together (a * b).

  • Every declared input must appear in the formula exactly once, in declaration order.

  • Parentheses are allowed for grouping (e.g., (a * 2) + b - c).

Valid examples

Invalid examples

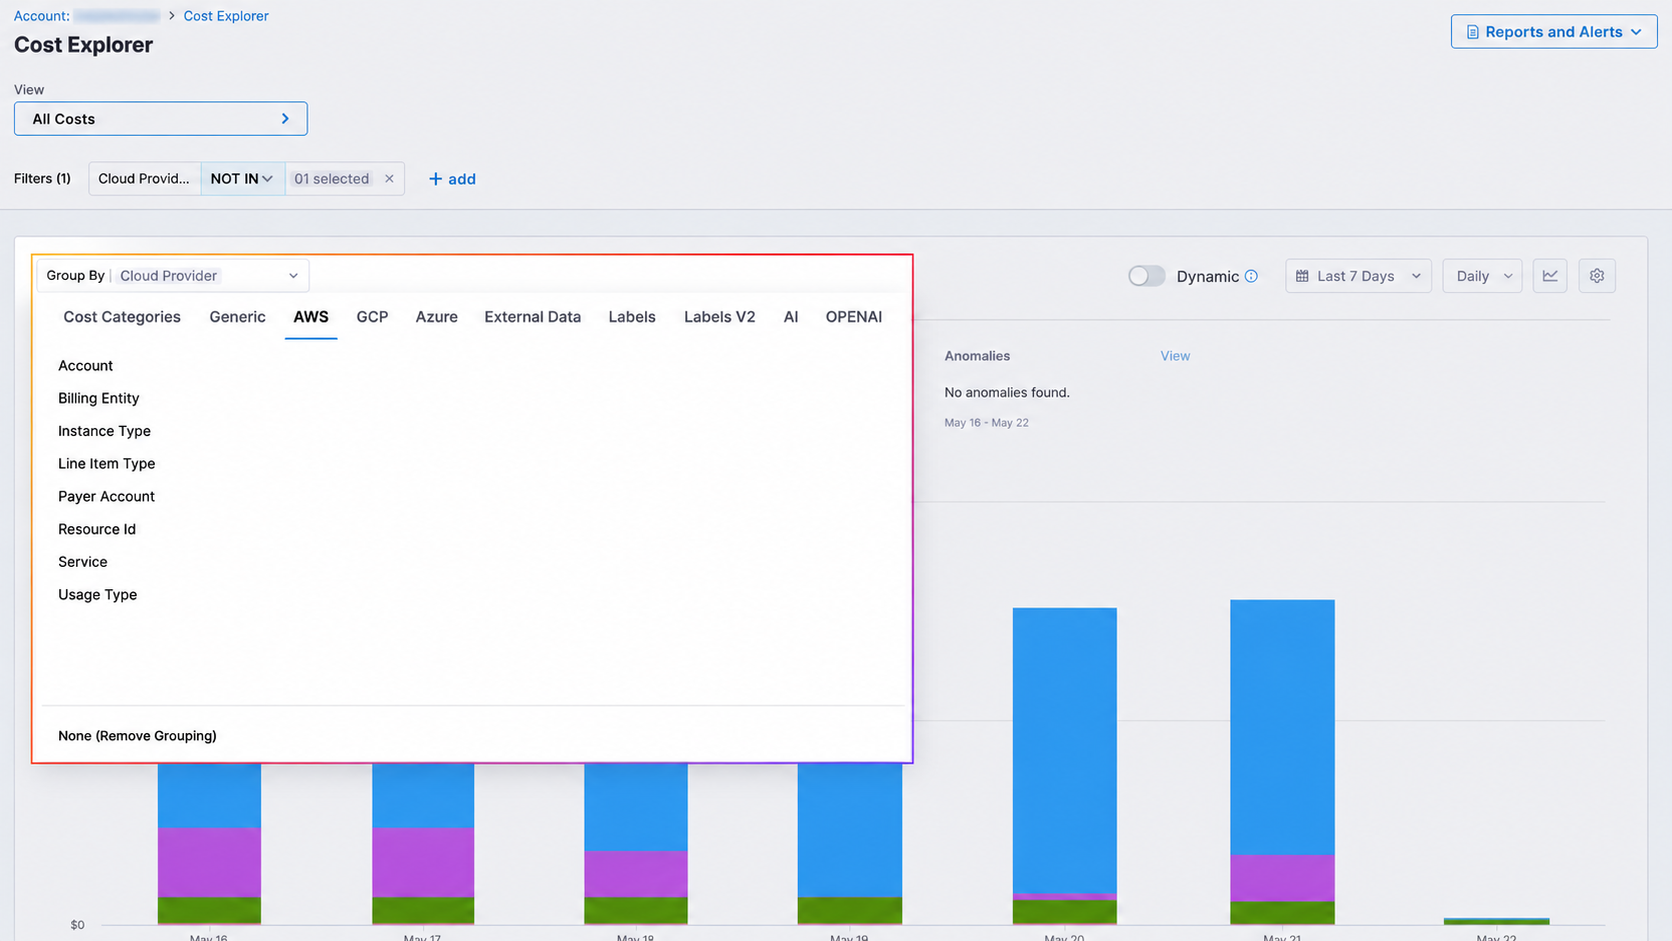
Group By Options

Click to view full size image

You can create a Perspective for your resources using rules and filters. The filters are used to group the resources. The following are the supported filters:

  • Cost Categories: You can create a perspective by filtering based on the cost categories you have created. To create cost categories, see Use Cost Categories.

  • Generic:

    • Region: Each AWS, GCP, or Azure region you're currently running services in.

    • Product: Each of your active products with its cloud costs.

    • Cloud Provider: Filter and group costs by the cloud service provider (AWS, GCP, Azure, or Kubernetes clusters) to analyze spending across different cloud platforms.

    • Sub Account Id:

  • AWS: CACM allows you to view your AWS costs at a glance, understand what is costing the most, and analyze cost trends across all your Amazon Web Services:

    Grouping Option
    Description

    Account

    Cost by AWS account connected via Harness AWS Cloud Provider, showing account name and ID

    Billing Entity

    Distinguishes between AWS Marketplace transactions and other AWS service purchases (Learn more)

    Instance Type

    Cost by Amazon EC2 instance type (e.g., t2.micro, m5.large)

    Line Item Type

    Cost by charge type (Usage, Tax, Credit, etc.) (Learn more)

    Payer Account

    Cost by AWS account that pays for member accounts in an AWS Organization

    Resource Id

    Cost by unique AWS resource identifier (ARN), enabling granular tracking of individual resources like specific EC2 instances, S3 buckets, or RDS databases

    Service

    Cost by AWS service (EC2, S3, RDS, etc.)

    Usage Type

    Cost by specific resource usage measurement (e.g., BoxUsage:t2.micro(Hrs) for EC2 t2.micro instance hours)

  • GCP: Analyze your Google Cloud Platform costs across products, projects, and other dimensions:

    Grouping Option
    Description

    Billing Account

    Cost by billing account, allowing tracking across multiple linked projects

    Product

    Cost by GCP product (Compute Engine, Cloud Storage, BigQuery, etc.)

    Project

    Cost by GCP project

    Resource Global Name

    Cost by unique GCP resource identifier, enabling granular tracking of individual resources across your Google Cloud environment

    SKU

    Cost by specific SKU, representing the billable unit for GCP services

  • Azure: Analyze your Microsoft Azure costs across services, resource groups, and other dimensions:

    Grouping Option
    Description

    Benefit Name

    Cost by benefit applied to resources (Enterprise Agreement discounts, Azure Hybrid Benefit, etc.)

    Billing Account ID

    Cost by unique billing account identifier

    Billing Account Name

    Cost by billing account name

    Charge Type

    Cost by charge type (Usage, Purchase, Refund, etc.)

    Frequency

    Cost by charge frequency (OneTime, Recurring, UsageBased)

    Instance ID

    Cost by specific resource instance identifier

    Meter

    Cost by usage meter (Compute Hours, IP Address Hours, Data Transfer, etc.)

    Meter Category

    Cost by meter category (Cloud Services, Networking, etc.)

    Meter Subcategory

    Cost by meter subcategory (A6 Cloud Services, ExpressRoute, etc.)

    Pricing Model

    Cost by pricing structure (Pay-as-you-go, Reserved Instance, etc.)

    Publisher Name

    Cost by Marketplace service publisher

    Publisher Type

    Cost by publisher type (Microsoft/Azure, Marketplace, AWS)

    Reservation ID

    Cost by reservation instance identifier

    Reservation Name

    Cost by reservation instance name

    Resource

    Cost by specific Azure resource

    Resource GUID

    Cost by resource unique identifier

    Resource Group Name

    Cost by resource group

    Resource Name

    Cost by resource name

    Resource Type

    Cost by resource type (Virtual Machine, Storage Account, App Service, etc.)

    Service Name

    Cost by Azure service (Virtual Machines, App Service, DNS, etc.)

    Service Tier

    Cost by service tier (VMs, Dv3, Dsv3, etc.)

    Subscription ID

    Cost by subscription identifier

    Subscription Name

    Cost by subscription name

    Tenant ID

    Cost by Azure Active Directory tenant identifier, useful for organizations with multiple tenants

  • External Data Grouping Options: Analyze costs from external data sources that you've integrated with CACM:

    Grouping Option
    Description

    Account ID

    Cost by account identifier from external data sources

    Account Name

    Cost by account name from external data sources

    Billing Account ID

    Cost by billing account identifier from external systems

    Billing Account Name

    Cost by billing account name from external systems

    Provider Name

    Cost by provider or vendor name from external data

    Resource

    Cost by specific resource from external data sources

    SKU

    Cost by SKU or product identifier from external systems

  • Label: Each label that you assign to your AWS resources. You can select a label name to get more granular details of your label. For more information, go to Tagging your AWS resources. For tags to appear in the Perspective, you must activate the user-defined cost allocation tags in the AWS Billing and Cost Management console. For more information, go to Activating User-Defined Cost Allocation Tags. CACM updates the tag keys as follows:

    • For the user-defined tags, user_ prefix is added.

    • For the AWS system tags, aws_ prefix is added.

    • The characters that do not follow regex [a-zA-Z0-9_] are changed to _.

    • The tags are case-sensitive. If the tags are specified as UserName and username, then the number suffix _<Number>is added to the tag. For example, UserName and username_1.

  • Label V2: Preserves the original structure from AWS similar to how GCP, Azure and Cluster tags are stored. See Understanding the Difference: Label vs. Label V2 and Migrate from Label to Label V2.

  • [NEW] AI: Analyze costs for AI and machine learning workloads across providers:

    Grouping Option
    Description

    Model

    Cost by AI/ML model used (e.g., GPT-4, Claude, Llama)

    Provider

    Cost by AI service provider (OpenAI, Anthropic, Google, etc.)

    Sub Account ID

    Cost by sub-account identifier for multi-tenant AI deployments

    Sub Provider

    Cost by sub-provider or specific API endpoint

    Token Type

    Cost by token type (input tokens, output tokens, training tokens)

  • [NEW] OpenAI: Analyze costs specifically for OpenAI API usage:

    Grouping Option
    Description

    Model

    Cost by OpenAI model (GPT-4, GPT-3.5-turbo, DALL-E, Whisper, etc.)

    Project Id

    Cost by OpenAI project identifier

    Token Type

    Cost by token type (prompt tokens, completion tokens, embedding tokens)

  • [NEW] Anthropic: Analyze costs specifically for Anthropic API usage:

    Grouping Option
    Description

    Model

    Cost by Anthropic model (Claude Opus, Claude Sonnet, Claude Haiku, etc.)

    Organization ID

    Cost by Anthropic organization identifier

    Organization Name

    Cost by Anthropic organization name

    Project Id

    Cost by Anthropic project identifier

    Project Name

    Cost by Anthropic project name

    Token Type

    Cost by token type (input tokens, output tokens, cache tokens)

Time Period & Granularity

Click to view full size image

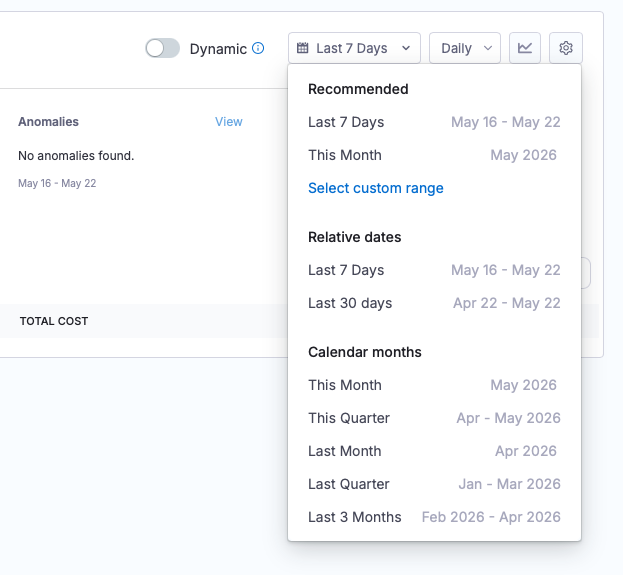
Time Period Options

  • Last 7 Days

  • Last 30 Days

  • This Month

  • Last Month

  • Custom date range

Granularity Options

  • Daily: Day-by-day breakdown

  • Weekly: Week-over-week view

  • Monthly: Month-over-month comparison

  • Hourly: Available for Kubernetes cluster data within last 7 days

Preferences

Click to view full size image

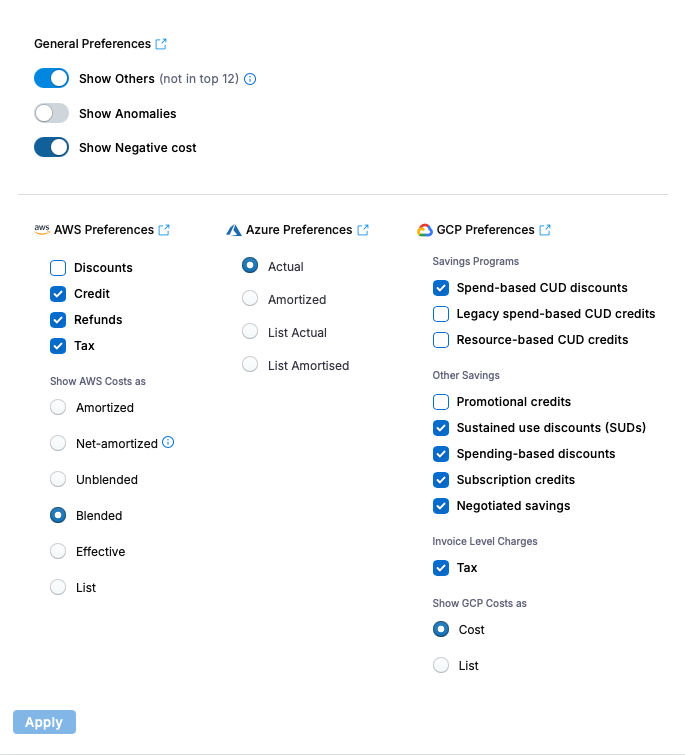
General Preferences

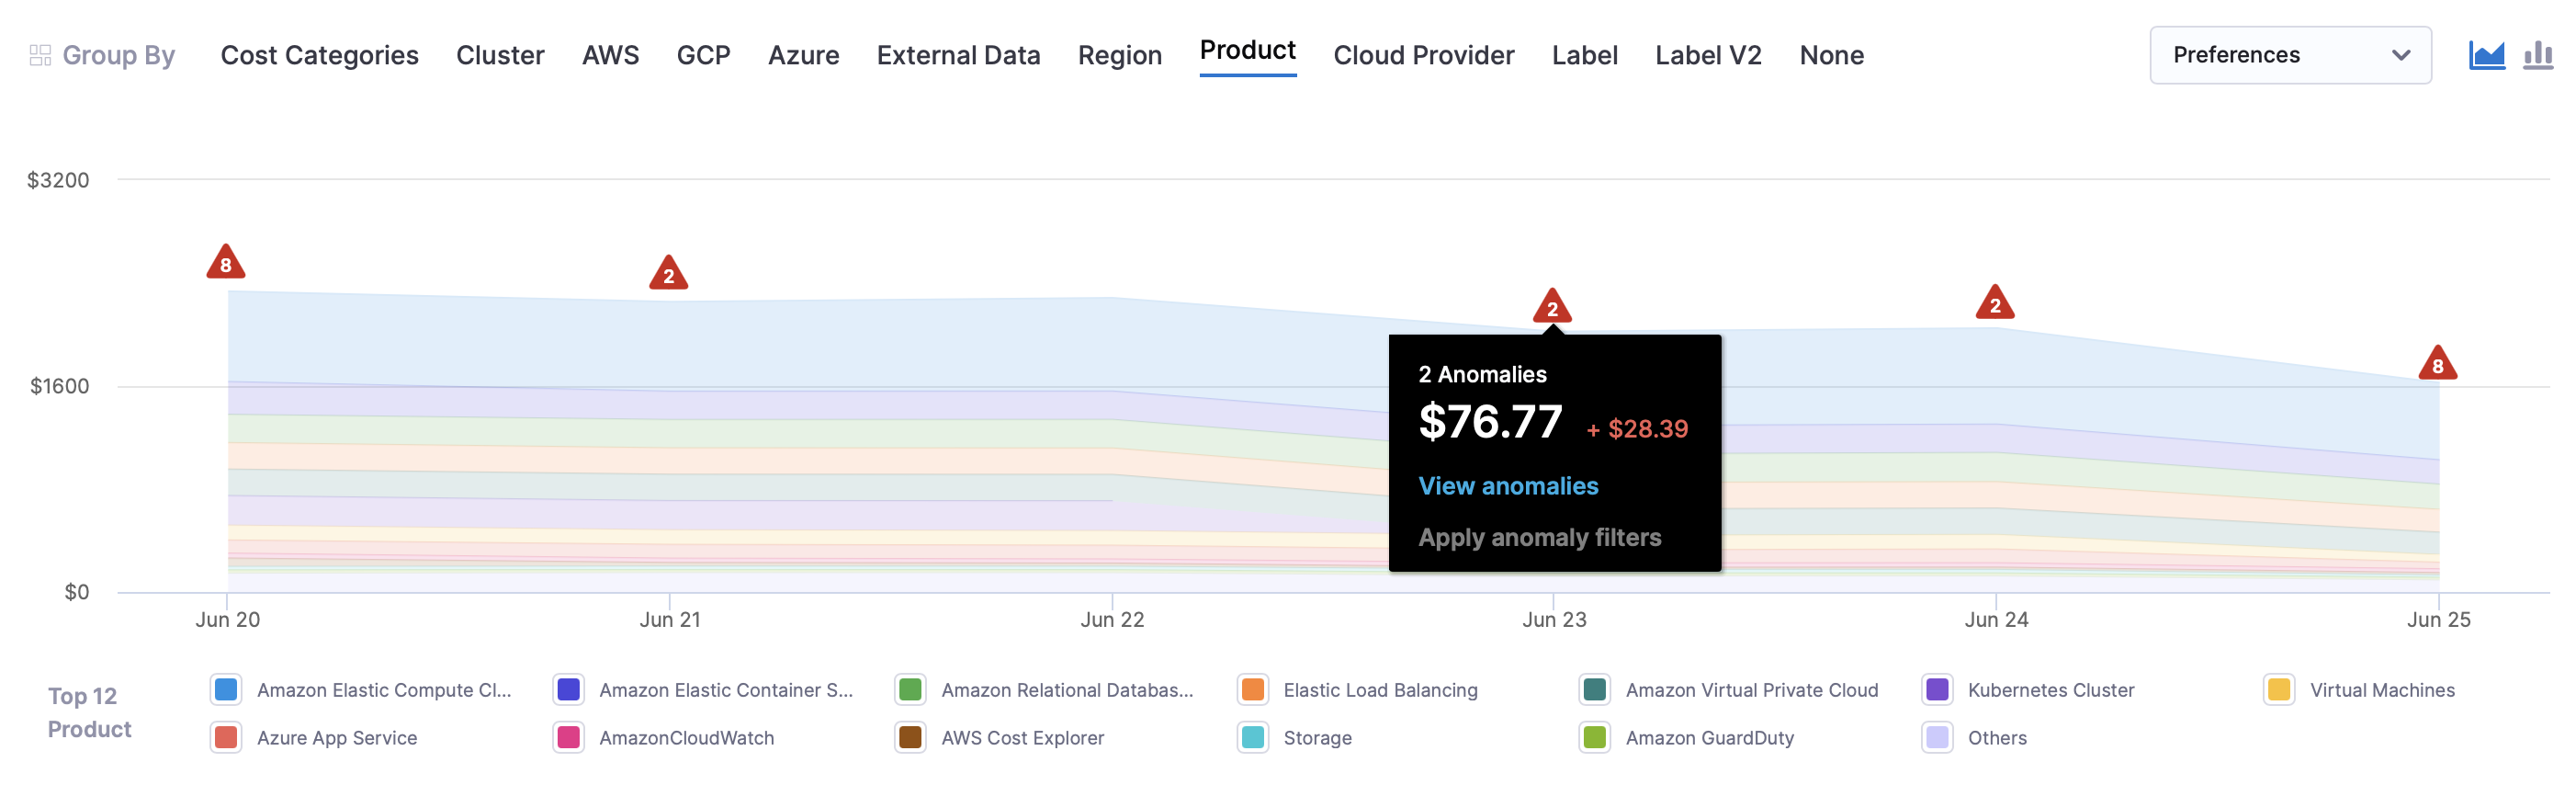
  • Show Others: The default perspective graph displays only the top 12 cost items. Enable this option to group all remaining costs into an "Others" category, ensuring you see your complete spending picture.

  • Show Anomalies: Highlight unusual spending patterns or sudden cost changes in your visualizations. This feature makes it easy to spot potential issues or unexpected charges that may require investigation. The number of anomalies are shown on the Group By graph in a red triangle.

Click to view full size image
  • Show Negative Cost: Displays instances where discounts exceed the actual billing amount, resulting in negative cost values in your reports. Displays the negative cost with a dotted red bar and labels it as NegativeCost in the legend. To view it, please select "Group By" as None because in other Group Bys, it might not appear in the top 12 entries.

Cloud Provider Preferences

Configure cost calculation preferences per cloud provider:

AWS Preferences

  • Cost Type: Amortized, Net Amortized, Unblended, Blended, Effective, Lisy

  • Include Discounts: Toggle discount visibility

  • Include Credits: Toggle credit visibility

  • Include Refunds: Toggle refund visibility

  • Include Taxes: Toggle tax visibility

Azure Preferences

  • Cost Type: Actual, Amortized, list Actual, List Amortised

GCP Preferences

  • Savings Programs: Spend-based CUD discounts, Legacy spend-based CUD credits, Resource-based CUD credits

  • Other Savings: Promotional credits, Sustained use discounts (SUDs), Spending-based discounts, Subscription credits, Negotiated savings

  • Invoice Level Changes: Tax

  • Show GCP costs as: cost or list

Read More

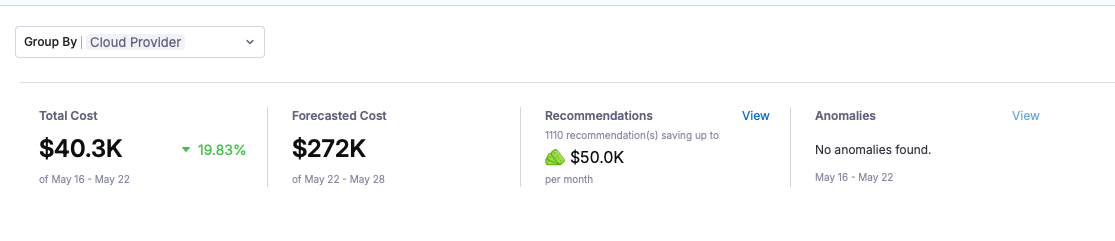
Cost Summary Cards

View key metrics at a glance:

  • Total Cost: Current period spend with trend indicator

  • Forecasted Cost: Projected end-of-period spend

  • Budget Status: Budget utilization (if budget attached)

  • Anomalies: Detected cost anomalies count

  • Recommendations: Available optimization recommendations

Click to view full size image

Save & Manage Views

Save Current Configuration

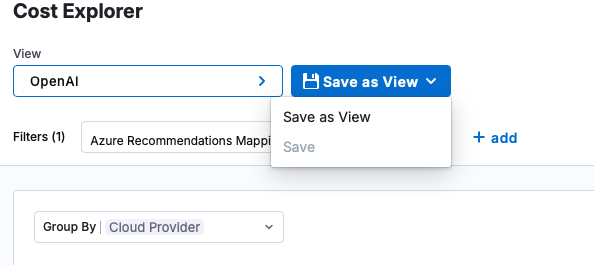
  1. Apply filters, grouping, and preferences

  2. Click "Save as View" dropdown

  3. Choose "Save" (update existing) or "Save as View" (create new)

  4. Enter view name and select folder

  5. Click "Save"

Click to view full size image

Edit View Properties

  • Click the edit icon next to the view name

  • Modify name and folder location

  • Changes are saved when you save the view

Click to view full size image

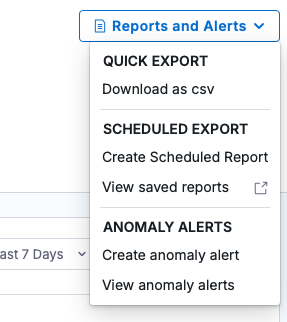
Reports and Alerts

Click to view full size image
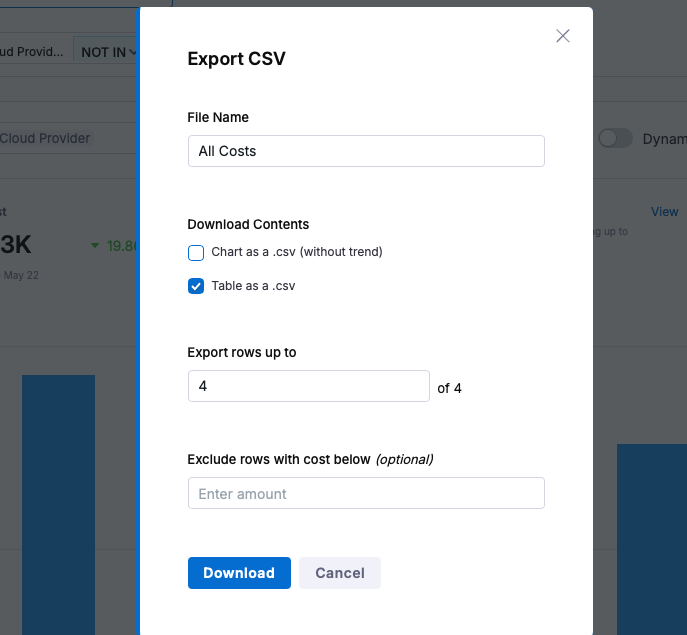
  • Quick Export: Download as CSV either as a chart or as a table

Click to view full size image
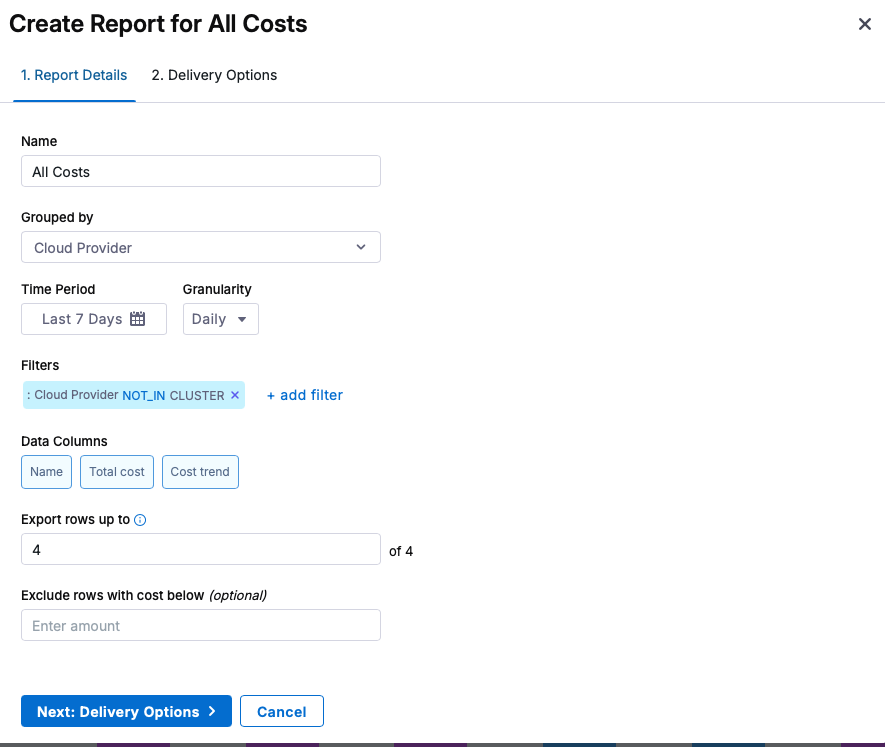
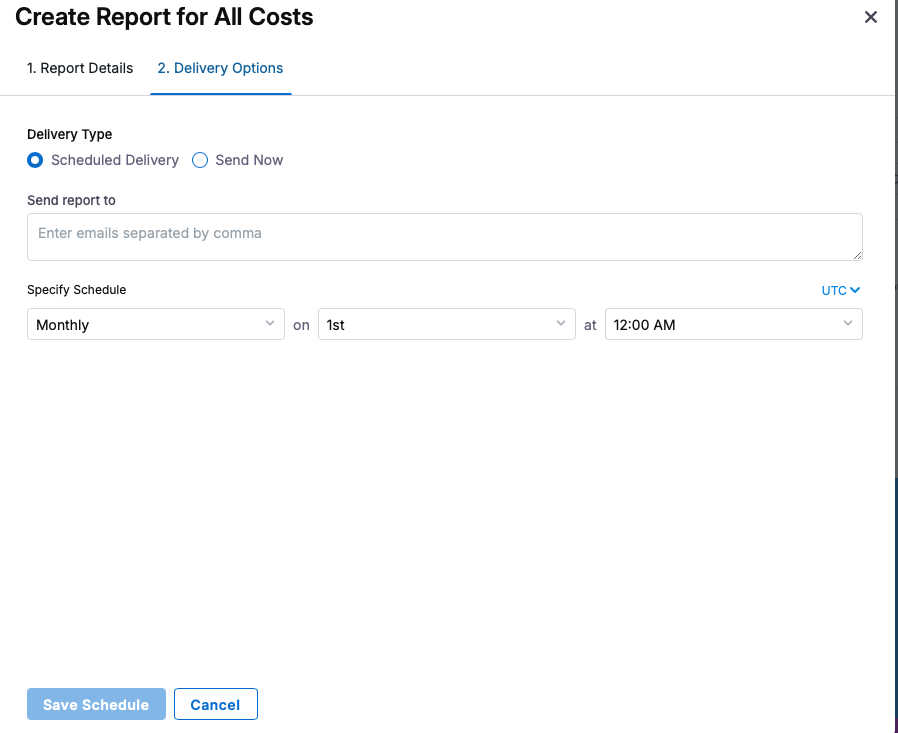
  • Scheduled Reports: Create recurring reports from saved views

Click to view full size image
Dynamic vs Stored Data Toggle

Toggle between data calculation modes:

  • Dynamic (ON): Cost Category rules applied in real-time

  • Stored (OFF): Pre-calculated Cost Category data (faster)

Read More here: Dynamic Cost Categories Toggle

Switching Between Cost Explorer and Perspectives

Enable Cost Explorer

Click to view full size image
  1. Look for the Switch to new Views Experience banner on the Perspectives page

  2. Click "Switch" to enable Cost Explorer

  3. The page will reload with the new interface

Switch Back to Perspectives

Click to view full size image
  1. Open the Views Explorer Drawer (click the View selector).

  2. Click Switch back to Perspectives link in the header.

  3. The page will reload with the classic Perspectives interface.

Your preference is stored locally and persists across sessions.


Last updated

Was this helpful?