AI Cost Management Quickstart
Turn on AI trace attribution to break AI spend down to the agent, session, and request that caused it, from generating an ingestion token to verifying traces in Cost Explorer.
This quickstart walks you through setting up AI trace attribution so you can see exactly which agent, session, or request drove your AI spend. If you have not connected a billing provider yet, start with Get Started first.
Before you begin
Make sure you have the following:
AI Cost Management enabled: Confirm that AI Cloud Providers appears under Cloud & AI Cost Management > Account Settings. If it does not, contact Harness Support to enable it for your account.
A provider connector (recommended): Needed for invoice-accurate costs to compare against trace estimates. Go to the CACM Get Started to connect one.
Permission to create a service account: You generate the ingestion token from a service account. Go to RBAC in Harness to confirm your role.
A runtime: You need one of the following: Python 3.8+ to instrument your app with the Harness SDK, or
curlto send a quick test trace and verify the setup works.Network access: From your app or shell to the Harness OTLP endpoint (
https://app.harness.io/udp-ingest/otel/v1/traces, or your cluster's equivalent).
Set up trace attribution
Step 1: Generate an ingestion token
Harness authenticates trace ingestion with a bearer token against the account's OTLP endpoint. Create a dedicated service account for ingestion so the credential is isolated and easy to rotate.
Create a service account (example:
ai-telemetry-ingest) with the minimum permissions required for ingestion.Select Generate Token and copy it.
STORE THE TOKEN SECURELY
The token is displayed once. Save it to a secret manager or environment variable and do not commit it to source control.
Step 2: Choose your path
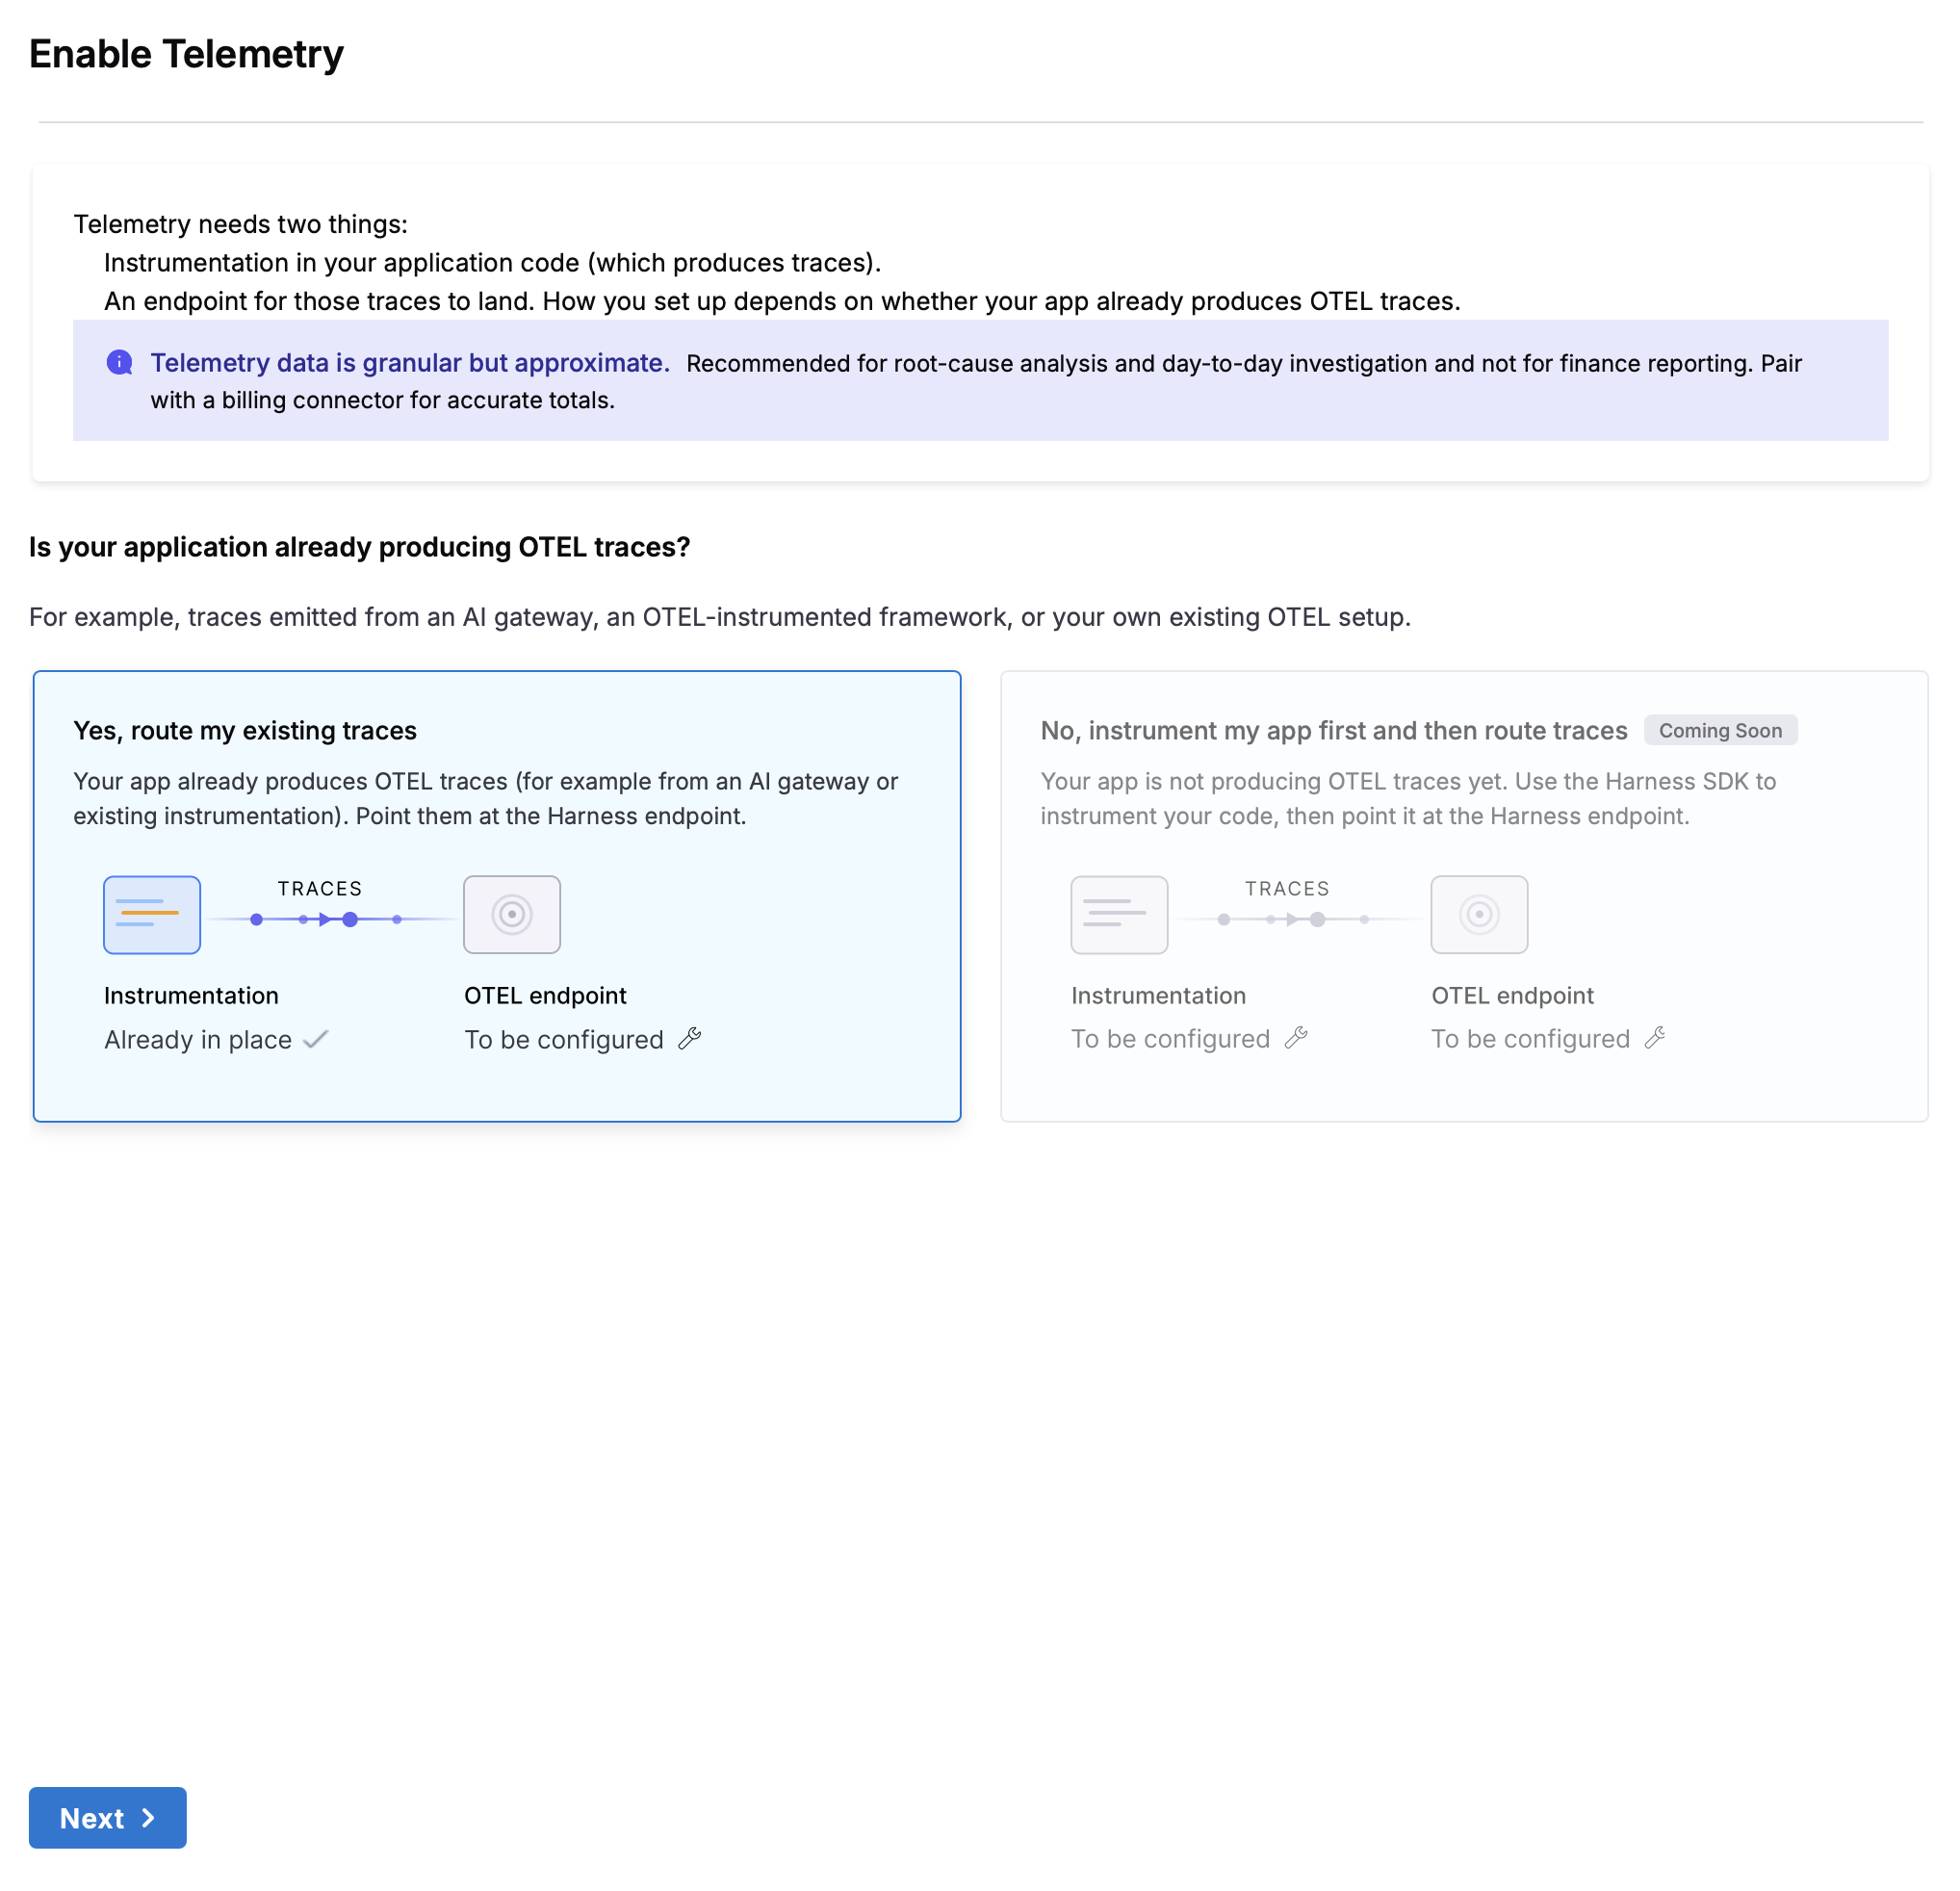
Select your onboarding path based on whether your application or gateway emits generative AI (GenAI) OpenTelemetry traces:
Traces are already emitted: Select Route Existing Traces to forward your telemetry to Harness without code changes.
Application requires instrumentation: Instrument your code to emit GenAI traces, then route them to Harness. Use the Harness SDK for direct Python model SDK calls, or a compatible open-source SDK for orchestration frameworks.
Not sure whether your stack emits GenAI traces? Go to Compatibility Matrix to check.
Route Existing Traces
Your app or gateway already emits GenAI OpenTelemetry traces (LangSmith, OpenInference, a LiteLLM proxy, or native framework export).
Generate a token and point the existing exporter at the Harness endpoint. No code changes.
Instrument Your Application
Your app does not emit GenAI traces yet.
Add the Harness SDK (direct Python SDK calls) or an open-source SDK (orchestration frameworks), then route the traces to Harness.
Step 3: Instrument your application
Follow the path you chose in Step 2.
Use this path if your app or gateway already emits OpenTelemetry traces with GenAI semantic conventions (from LangSmith, OpenInference, a LiteLLM proxy, or a framework with native export). You repoint the existing exporter at Harness, with no code changes.

Set these OpenTelemetry environment variables, then restart the application or gateway:
Replace app.harness.io with your cluster if different (example: app3.harness.io).
Some frameworks and tools need one extra flag to turn telemetry on before the variables above take effect. Go to the matching integration page for the exact flag:
Set LANGSMITH_OTEL_ENABLED=true
Enable the otel callback in config.yaml
Set CLAUDE_CODE_ENABLE_TELEMETRY=1
Use this path if your app does not emit GenAI traces yet. Add instrumentation, then route the traces to Harness. Pick the tab that matches your stack.
Use this if your Python app calls a model SDK directly (LiteLLM, OpenAI, or Anthropic) with no orchestration framework:
Install the Harness SDK for your client (for example,
pip install "harness-sdk[openai]").Set the endpoint environment variables to point at Harness.
Add these two lines at the very start of your app, before importing any AI library:
Go to the Harness SDK integration for the exact install commands, the endpoint variables, and per-client examples.
Use this if a framework such as LangChain, LlamaIndex, or Google ADK runs your LLM calls. Each framework has its own open-source instrumentation that captures the full workflow, not just the model call, so you see the tool calls, retries, and loops around it. Follow the setup page for your framework:
For other languages (Go, Java, .NET), go to Manual instrumentation.
Step 4: Verify traces in Cost Explorer
Run the application, or restart the exporter, so traces flow. They usually appear within a few minutes; allow up to about 20 minutes.
Go to Cloud & AI Cost Management > Cost Explorer.
Select the AI Traces view or group by Service Name, and find your service.
Select a service row to open the Service Traces drawer, and drill from a session down to the exact LLM call, retry, or tool loop that drove the cost.
Once traces are flowing and you can see cost attributed by service, you have full AI cost visibility: invoice-accurate totals from the connector and a code-level breakdown from traces.
Step 5: Send a test trace
To confirm the endpoint and token work without instrumenting an application, send a single test span with curl. This is useful before you wire up a full app, or to isolate whether a problem is with the ingestion setup or the instrumentation.
Replace <ACCOUNT_ID> with your account identifier and <YOUR_TOKEN> with the token from Step 1, then run:
Open the AI Traces view in Cost Explorer and look for test-service. It usually appears within a few minutes; allow up to about 20 minutes.
Next steps
Go to Cost Explorer to explore AI spend by model, agent, session, and service.
Go to AI Cost Troubleshooting if data does not appear as expected.
Last updated
Was this helpful?