> For the complete documentation index, see [llms.txt](https://developer.harness.io/llms.txt). Markdown versions of documentation pages are available by appending `.md` to page URLs; this page is available as [Markdown](https://developer.harness.io/continuous-delivery/troubleshooting-and-resources/tutorials/kubernetes-container-deployments/prometheus.md).
# Verify Kubernetes Deployments with Prometheus
Verify Kubernetes deployments with Prometheus and Harness Continuous Verification.
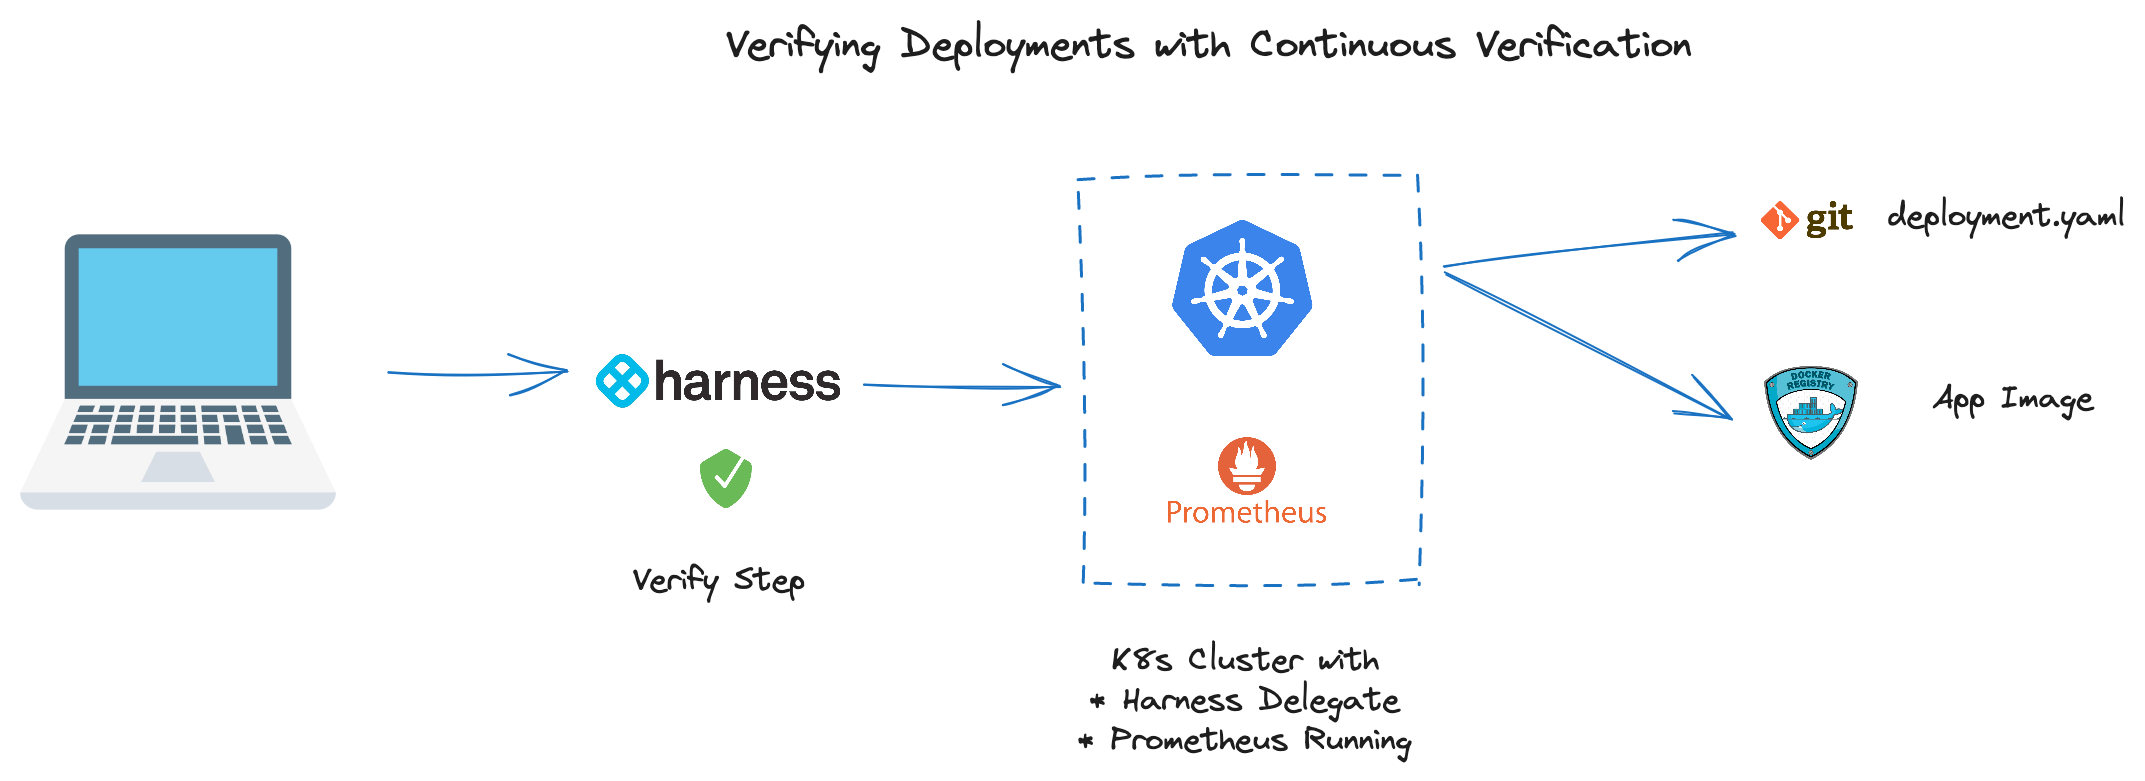
This topic explains how to verify a Kubernetes deployment with Prometheus using Harness Continuous Verification (CV). You deploy [an application that writes to a Prometheus endpoint](https://github.com/harness-apps/cv-example-app), then add a Verify step that queries Prometheus to confirm the deployment is healthy.
Looking at external systems such as Application Performance Monitoring (APM), logging, or monitoring solutions is a systematic way to validate deployments. Harness CV can query these systems on your behalf, and can also [apply AI/ML](/continuous-delivery/use-continuous-delivery/verify-deployments/cv-concepts/machine-learning.md) to watch markers that are trending towards failure or regression.
***
### What will you learn in this topic?
* How to [install Prometheus](#install-prometheus) on your Kubernetes cluster with Helm.
* How to [configure Continuous Verification](#configure-continuous-verification) to query Prometheus and validate a deployment.
* How to [run the example pipeline](#run-the-example-pipeline) to deploy the sample application and verify it with Harness CV.
***
### Before you begin
To deploy the sample application to an existing Kubernetes cluster, ensure you have the following:
* **Harness account**: A Harness account is required. Go to [sign up for free](https://app.harness.io/auth/#/signup/?module=cd&?utm_source=website\&utm_medium=harness-developer-hub\&utm_campaign=cd-plg\&utm_content=get-started) to create one.
* **GitHub connectivity**: Go to the [GitHub connector settings reference](/harness-platform/use-harness-platform/connectors/code-repositories/add-a-github-connector/git-hub-connector-settings-reference.md) to configure it.
* **Docker Hub connectivity**: Go to [Connect to Harness Container Image Registry using a Docker connector](/harness-platform/use-harness-platform/connectors/artifact-repositories/add-a-docker-registry-connector/connect-to-harness-container-image-registry-using-docker-connector.md) to configure it.
* **Prometheus endpoint**: A reachable Prometheus endpoint. If you do not have one, install [Prometheus](https://prometheus.io/) on your Kubernetes cluster as described in the next section.
***
### Install Prometheus
Install Prometheus with Helm.
```bash
helm repo add prometheus-community https://prometheus-community.github.io/helm-charts
helm repo update
helm upgrade --install prometheus prometheus-community/prometheus \
--namespace prometheus --create-namespace
```
Expose Prometheus via NodePort.
```bash
kubectl expose deployment -n prometheus prometheus-server --type=NodePort --name=prometheus-service
```
Browse to `node_public_ip:nodeport`.
```bash
#Node External IP
kubectl get nodes -o wide
#NodePort for prometheus-service
kubectl get svc -n prometheus
```
Next, validate that your application writes to a Prometheus endpoint, or use the sample application.
***
### How applications write to Prometheus
Prometheus is a [time series database](https://prometheus.io/docs/concepts/data_model/) where your metrics are stored. Writing to Prometheus entails providing a key/value pair of the metric and value. Depending on the language your application uses, there are different Prometheus SDKs you can use to read and write metrics.
The [Spring Boot sample application](https://github.com/harness-apps/cv-example-app) is a good example of the underpinnings needed to write to Prometheus. The [pom.xml](https://github.com/harness-apps/cv-example-app/blob/main/pom.xml) contains the [Micrometer configuration](https://docs.micrometer.io/micrometer/reference/implementations/prometheus.html) to get connection and auto-wire information on Prometheus. Then, in the [application code](https://github.com/harness-apps/cv-example-app/blob/main/src/main/java/io/harness/cv/example/app/GenerateStableMetrics.java), you can use the Java SDK to write to the Prometheus primitives. The sample application has two versions that toggle between a `stable` and `unstable` mode, which have separate images for deployment convenience. The `stable` and `unstable` versions have different classes that write varying metric values.
By installing the Prometheus Helm Chart into your Kubernetes cluster, you also get a good set of Kubernetes-centric metrics that are scraped and exported for your convenience.
***
### Verify a deployment with Harness
There are a few objects to line up in Harness, starting with the un-validated deployment itself. Go to the [Kubernetes Manifest tutorial](/continuous-delivery/troubleshooting-and-resources/tutorials/kubernetes-container-deployments/manifest.md) to deploy a manifest in depth. You then wire the Verify step into your pipeline and configure the Prometheus Query Language (PromQL) queries to validate the application.
Click to view full size image
Perform the following steps to set up the deployment:
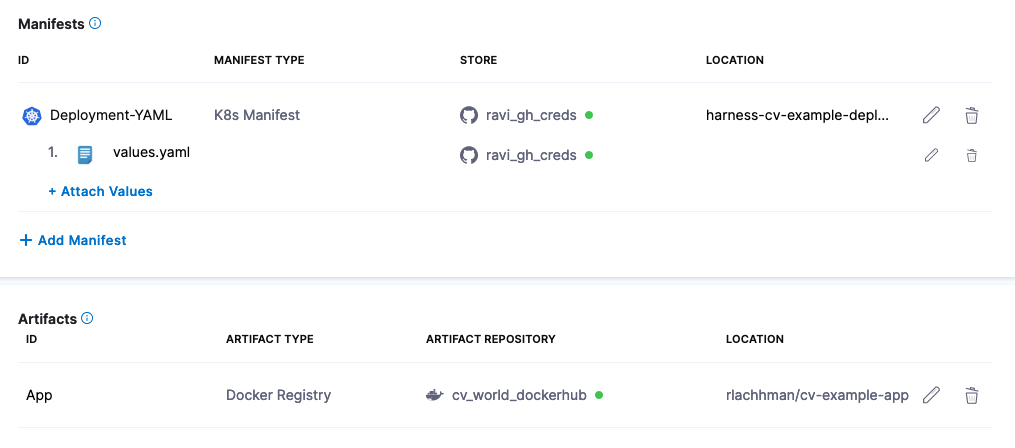
1. Create a new Harness Kubernetes Deployment.
2. In the Service Configuration, add a Kubernetes manifest pointing to [harness-cv-example-deployment.yaml](https://github.com/harness-apps/cv-example-app/blob/main/harness-cv-example-deployment.yaml).
3. In the Service Configuration, add a Values YAML pointing to [values.yaml](https://github.com/harness-apps/cv-example-app/blob/main/values.yaml).
4. In the Service Configuration, add an Artifact pointing to `rlachhman/cv-example-app`.
Click to view full size image
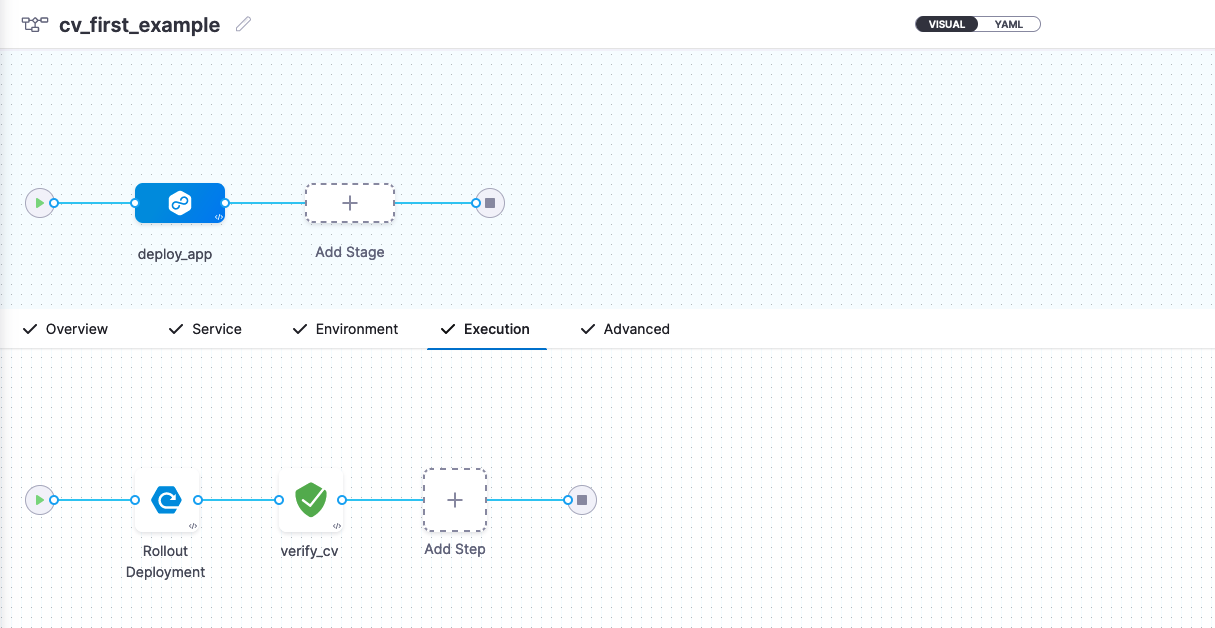
You can then pick your deployment strategy. For simplicity, this example uses a rolling deployment strategy. Once the deployment step is set up, add a Verify step to your pipeline, which is the Continuous Verification step.
***
### Configure Continuous Verification
The Continuous Verification configuration is represented by two concerns. The first is the Verify step, which defines when and where to run the verification. The second is the Monitored Service, which defines what to query and how to query it against your Health Source, in this case Prometheus. The Harness UI guides you through this setup.
Perform the following steps to add the Verify step:
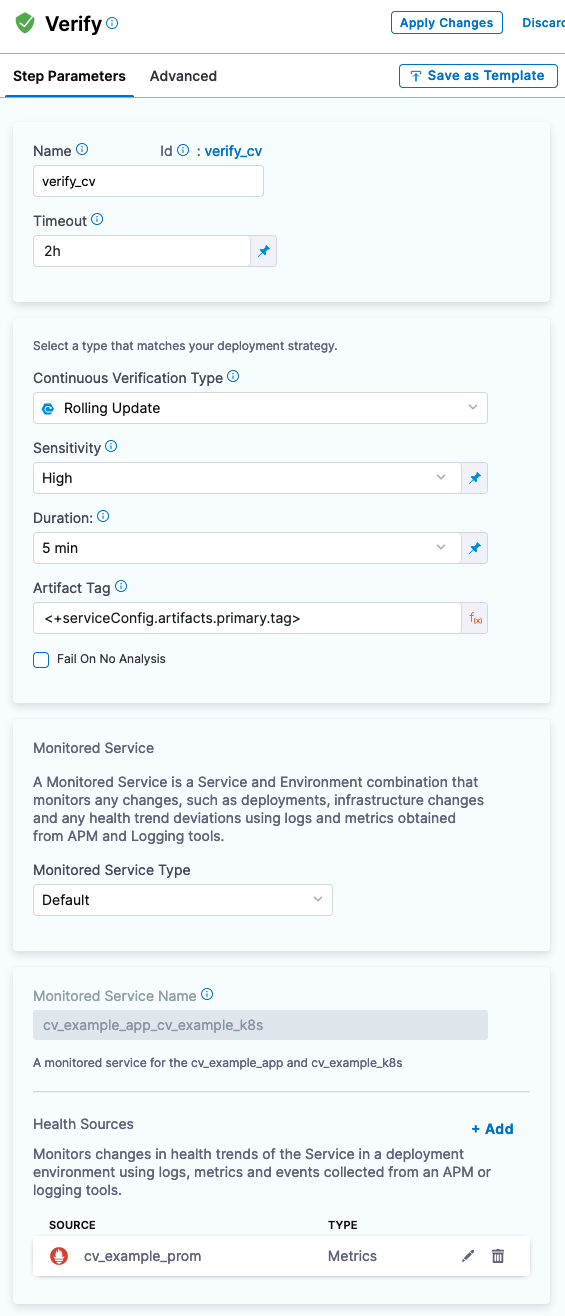
1. Add the Verify step after your rolling deployment.
2. Set **Continuous Verification Type** to **Rolling Update**.
3. Set [Sensitivity](/continuous-delivery/use-continuous-delivery/verify-deployments/cv-concepts/machine-learning.md#sensitivity) to **High**.
4. Set **Duration** to **5 min**.
5. Leave the **Artifact Tag** as `<+serviceConfig.artifacts.primary.tag>`.
Next, configure the Health Source ([Monitored Service](/service-reliability-management/use-srm/monitored-services/create-monitored-service.md)) for your application (for example, a [Harness Service](/continuous-delivery/new-to-continuous-delivery/overview.md#service)).
Perform the following steps to configure the Health Source:
1. When prompted, add your [Prometheus connection details](/harness-platform/use-harness-platform/connectors/monitoring-and-logging-systems/connect-to-monitoring-and-logging-systems.md#step-add-prometheus).
1. If using NodePort, use `http://node_public_ip:nodeport`.
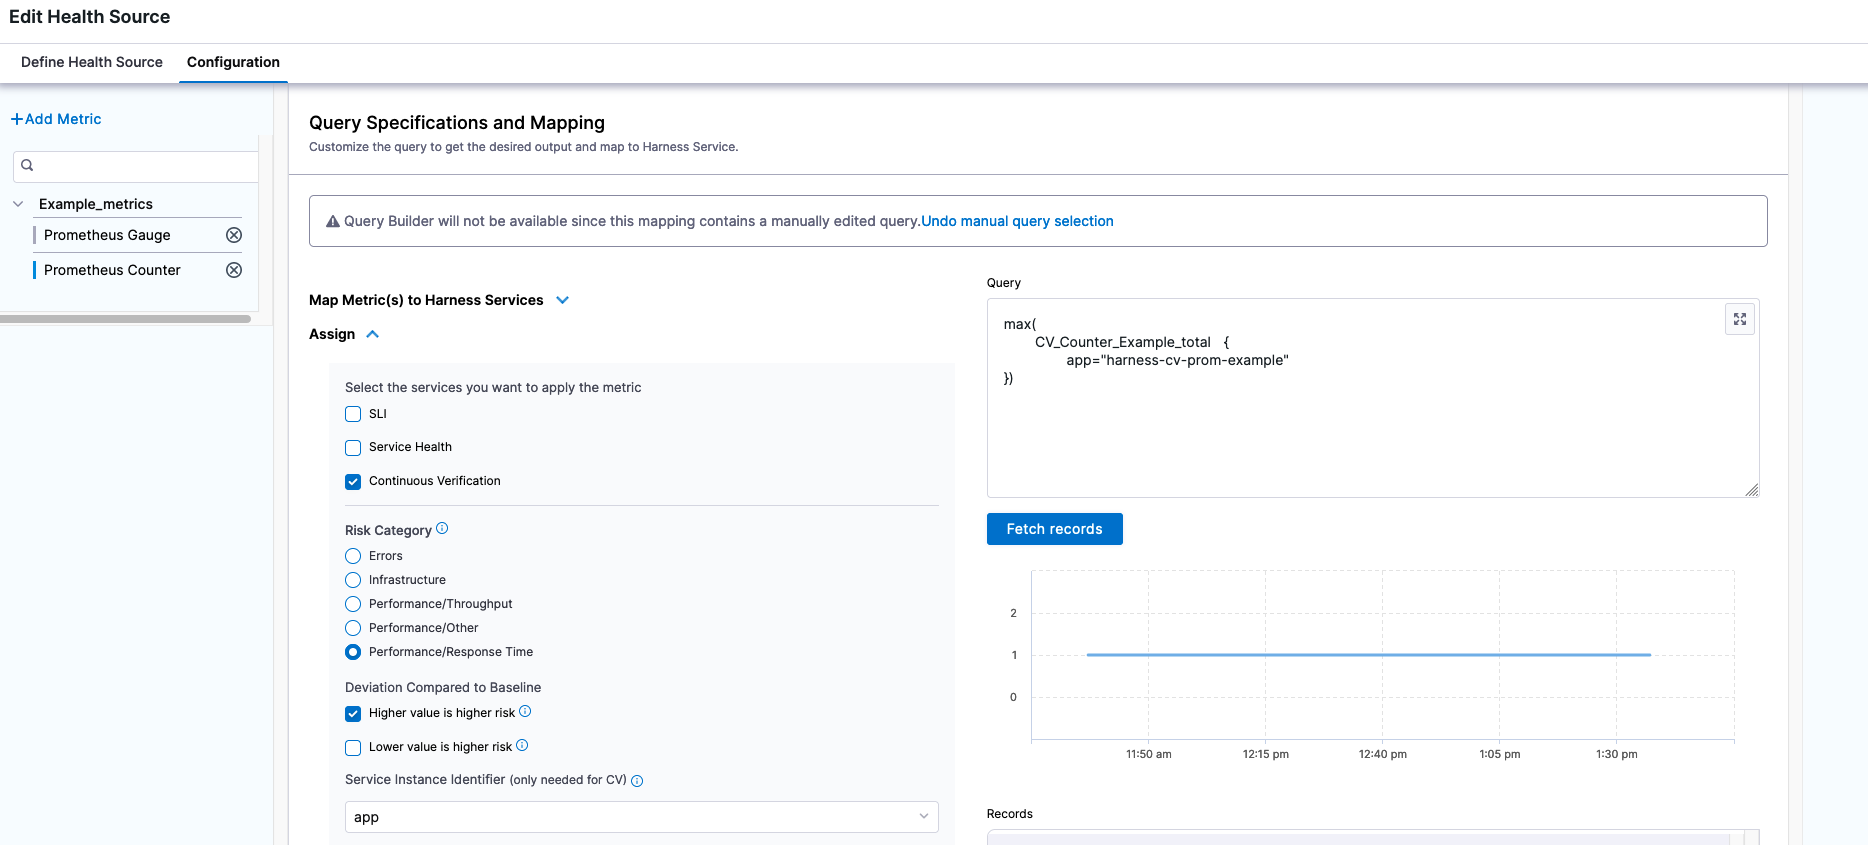
2. The sample application writes to the Prometheus metrics `CV_Counter_Example_total` and `CV_Gauge_Example`. You can query for the [Counter](https://prometheus.io/docs/concepts/metric_types/#counter).
3. Define the Health Source Configuration to have a metric called `Prometheus Counter`.
4. Query the Counter with PromQL:
```
max(
CV_Counter_Example_total {
app="harness-cv-prom-example"
})
```
5. Assign it to Continuous Verification.
6. Set **Risk Category** to **Performance/Response Time**.
7. Set **Deviation Compared to Baseline** to **Higher value is higher risk**.
8. Set the **Service Instance Identifier** to `app`.
Click to view full size image
With the query configured, your Verify step has all of the necessary pieces.
Click to view full size image
You are now ready to run the pipeline.
Click to view full size image
***
### Run the example pipeline
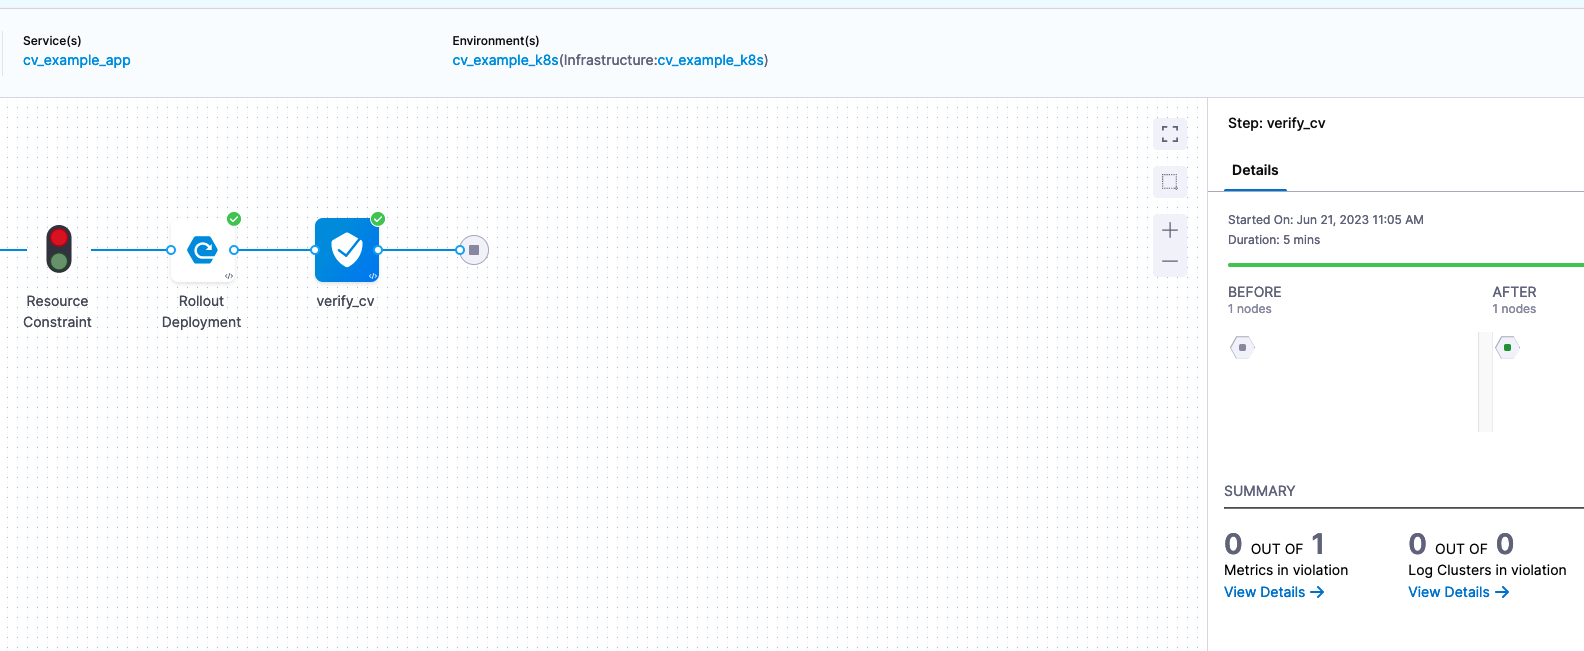
Harness Continuous Verification works off the concept of baselines and the ability to perform a before-and-after analysis of what has been deployed. Deploying the `stable` tag of the sample application for the first time generates a pass.
Click to view full size image
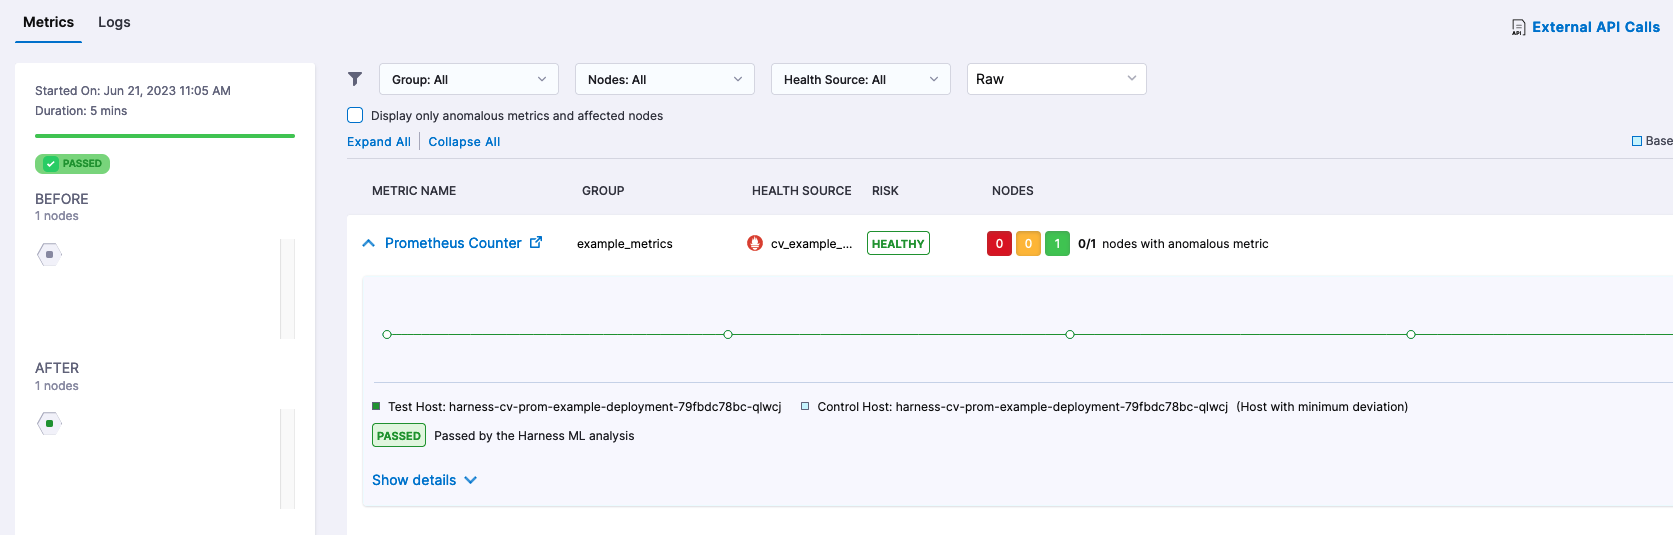
Select **View Details** to see what values were used for the comparisons.
Click to view full size image
Since Harness Continuous Verification uses AI/ML to help determine regressions, you can also wire in [static values](/continuous-delivery/use-continuous-delivery/verify-deployments/cv-concepts/machine-learning.md#plain-threshold-based-verification) that are known failures, such as long response times or deviations from a value. This example is just the start of what is possible with Continuous Verification.
***
### Next steps
You have verified a Kubernetes deployment with Prometheus and Harness CV. Continue your learning journey with the following:
* [Failure strategies](/harness-platform/use-harness-platform/pipelines/failure-handling/define-a-failure-strategy-on-stages-and-steps.md): Enact automatic or manual failure strategies in your pipeline.
* [Multi Service Deployments](/continuous-delivery/troubleshooting-and-resources/knowledge-base-article/cv-multi-service.md): Apply Continuous Verification to more complex deployments.
* [Sample application](https://github.com/harness-apps/cv-example-app#modifying-application): Modify or fork the sample application to build more scenarios.
{% @harness-feedback/feedback %}