Using custom dashboards to monitor CD deployments
Monitor CD deployments using the explores that work best for you.
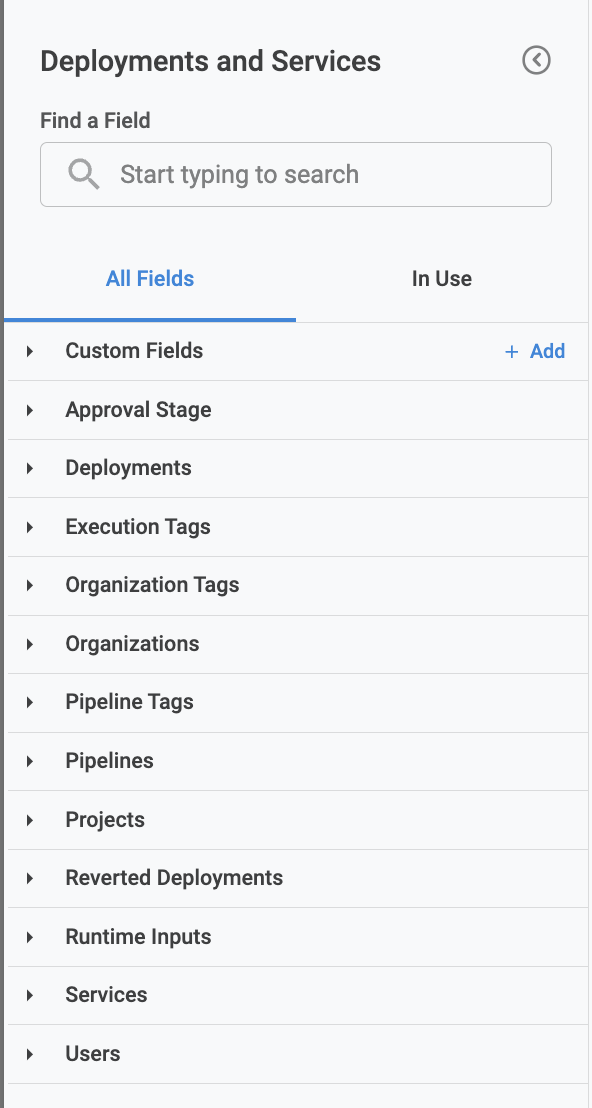
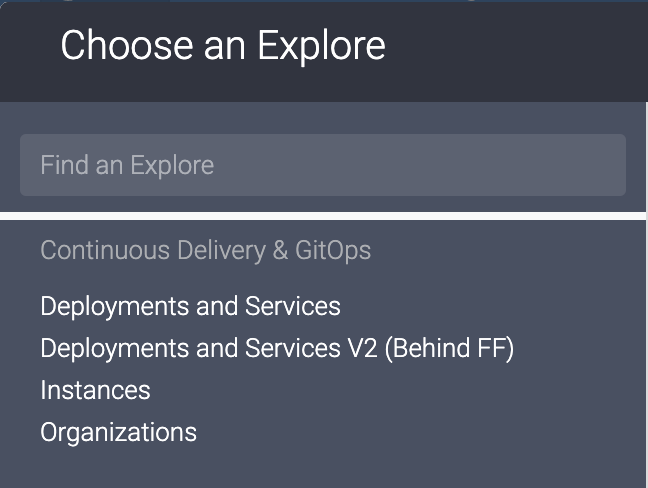
An Explore is a starting point for a query that is designed to explore a particular subject area. This topic describes the various explores available for monitoring CD deployments, and the data the provide. The following image shows the list of explores available for visualizing CD data.

It is recommended to refer this documentation first to get a basic overview on how to create dashboards.
Deployments and Services
This explore can be used to visualize CD data related to pipeline executions. Each explore has a set of views. The views present in this explore are:

Let's go through each of the views listed above and describe its fields and usages.
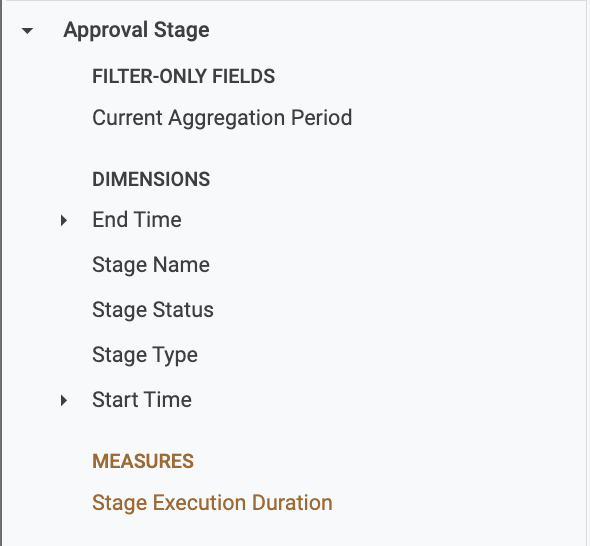
Approval Stage
This view contains the data related to the Helm manifest info that is used in CD stage executions. The data is recorded per CD stage execution. For example, if there are 10 executions of a single service with a Helm manifest linked to it, this view will have 10 records.

Filter-only Field:
Current Aggregation Period:
List of dimensions:
End Time: End time of the stage execution
Stage Name: Name of the stage
Stage Status: Current status of the stage(
RUNNING/FAILEDetc.)Stage Type: Type of the stage(
Approvals)Start Time: Start time of the stage execution
List of measures:
Stage Execution Duration: Average stage execution duration
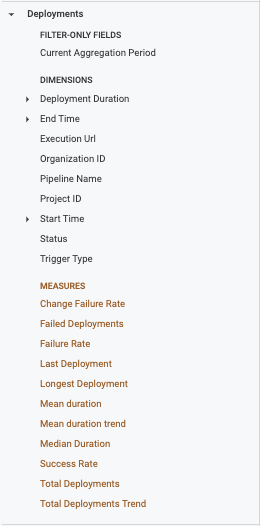
Deployments
This view contains the data related to pipeline executions. The data is recorded per pipeline execution, meaning if there are 10 pipeline executions, then this view will also have 10 records.

Filter-only Field:
Current Aggregation Period:
List of dimensions:
Deployment Duration: Duration of the pipeline execution
End Time: End time of the pipeline execution
Execution Url: URL of pipeline execution
Organization ID: Organization identifier where the pipeline got executed
Pipeline Name: Name of the pipeline
Project ID: Project identifier where the pipeline got executed
Start Time: Start time of the pipeline execution
Status: Pipeline status(
RUNNING/ABORTED/SUCCESSetc.)Trigger Type: Type of trigger used to execute the pipeline(
MANUAL/WEBHOOKetc.)
List of measures:
Change Failure Rate: Total deployments that have been reverted divided by the total no. of deployments
Failed Deployments: No. of deployments that failed with
FAILED/ABORTEDstatusesFailure Rate: Failure rate of deployments(Failed Deployments divided by total no. of deployments)
Last Deployment: Last deployment time
Longest Deployment: Longest deployment time
Mean duration: Average pipeline duration
Mean duration trend: This compares the mean duration trend from the previous period to the current period
Median Duration: Median duration of the deployment
Success Rate: Success rate of deployments(deployments completed with
SUCCESSstatus)Total Deployments: Total no. of deployments
Total Deployments Trend: This compares the deployment count from the previous period to the current period
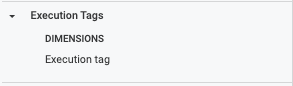
Execution Tags
This view contains the data related to pipeline execution tags. It will contain the tags that were present in the pipeline at the start of the execution.

List of dimensions:
Execution tag: The execution tag, it will be displayed as
key:value. If there are let's say 5 tags in a pipeline, there will be 5 rows having 1 tag(key:valuepair) in each row.
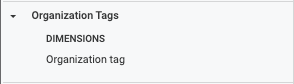
Organization Tags
This view contains the data related to the organization tags. It will contain the real-time tags of the organization.

List of dimensions:
Organization tag: The organization tag. It will be displayed as
key:value. For example, if there are 5 tags in an organization, there will be 5 rows having 1 tag (key:valuepair) in each row.
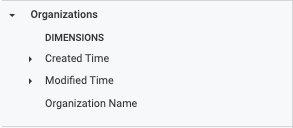
Organizations
This view contains the data related to organizations.

List of dimensions:
Organization tag: The organization tag, displayed as
key:value. For example, if there 5 tags in an organization, there will be 5 rows having 1 tag (key:valuepair) in each row.
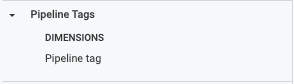
Pipeline Tags
This view contains the data related to pipeline tags. It will contain the real-time tags of the pipeline.

List of dimensions:
Pipeline tag: The pipeline tag, displayed as
key:value. For example, if there are 5 tags in a pipeline, there will be 5 rows having 1 tag (key:valuepair) in each row.
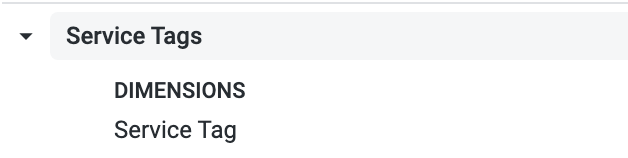
Service Tags
Displays a list of tags associated with a service.

List of dimensions:
Service tag: The service tag is displayed as
key:value. For example, if there are 5 tags in a service, there will be 5 rows having 1 tag (key:valuepair) in each row.
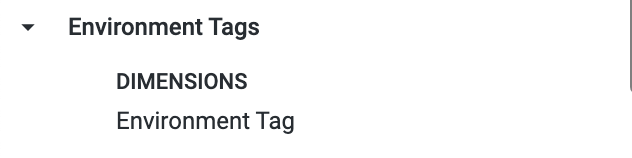
Environment Tags
Displays a list of tags associated with a environment.

List of dimensions:
Environment tag: The environment tag is displayed as
key:value. For example, if there are 5 tags in a environment, there will be 5 rows having 1 tag (key:valuepair) in each row.
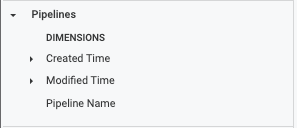
Pipelines
This view contains the data related to the pipelines.

List of dimensions:
Created Time: Creation time of the pipeline
Modified Name: Modification time of the pipeline
Pipeline Name: Name of the pipeline
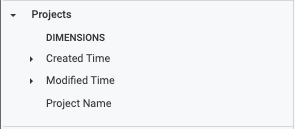
Projects
This view contains the data related to the projects.

List of dimensions:
Created Time: Creation time of the project
Modified Name: Modification time of the project
Project Name: Name of the project
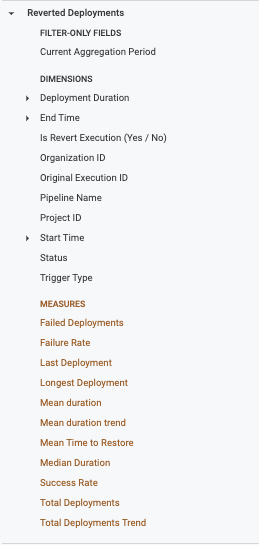
Reverted Deployments
This view contains the data related to reverted pipeline executions.

Filter-only Field:
Current Aggregation Period:
List of dimensions:
Deployment Duration: Duration of the pipeline execution
End Time: End time of the pipeline execution
Is Revert Execution (Yes / No): Specifies if the execution got reverted
Organization ID: Organization identifier where the pipeline got executed
Original Execution ID: Original execution id of the pipeline which got reverted
Pipeline Name: Name of the pipeline
Project ID: Project identifier where the pipeline got executed
Start Time: Start time of the pipeline execution
Status: Pipeline status (
RUNNING/ABORTED/SUCCESSetc.)Trigger Type: Type of trigger used to execute the pipeline (
MANUAL/WEBHOOKetc.)
List of measures:
Failed Deployments: No. of deployments that failed with
FAILED/ABORTEDstatusesFailure Rate: Failure rate of deployments(Failed Deployments divided by total no. of deployments)
Last Deployment: Last deployment time
Longest Deployment: Longest deployment time
Mean duration: Average pipeline duration
Mean duration trend: This compares the mean duration trend from the previous period to the current period
Mean Time to Restore: Measures the mean time to restore
Median Duration: Median duration of the deployment
Success Rate: Success rate of deployments (deployments completed with
SUCCESSstatus)Total Deployments: Total no. of deployments
Total Deployments Trend: This compares the deployment count from the previous period to the current period
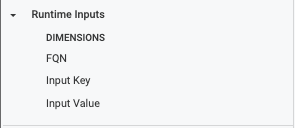
Runtime Inputs
This view contains the data related to the runtime inputs provided at the time of the pipeline execution. This will contain only the user provided runtime inputs when a pipeline is executed.

List of dimensions:
FQN: FQN of the runtime input
Input Key: Key of the runtime input
Input Value: Value given to the runtime input
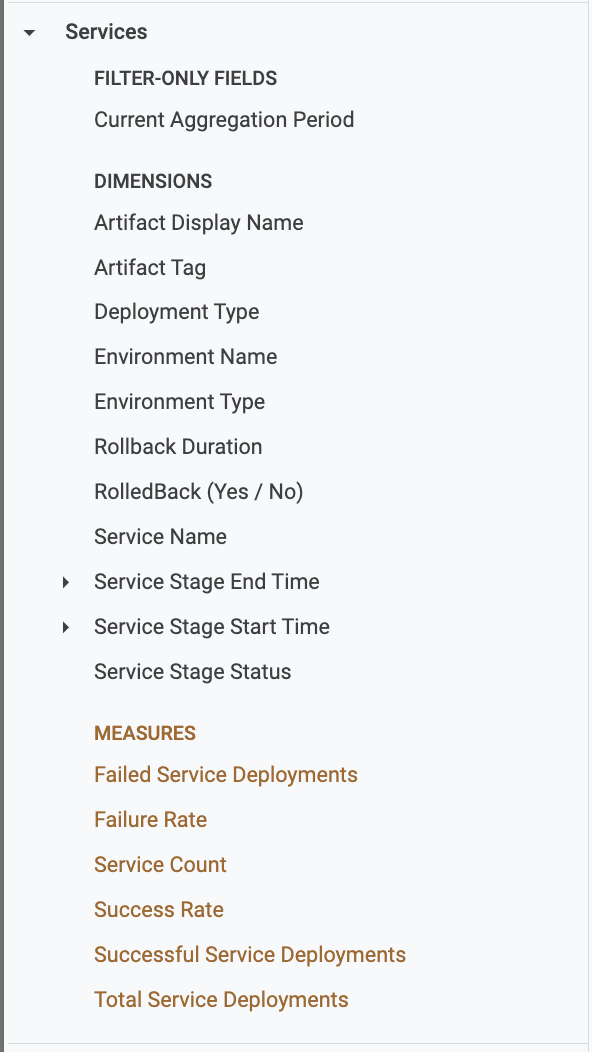
Services
This view contains the data related to the service and environment configurations.

Filter-only Field:
Current Aggregation Period:
List of dimensions:
Artifact Display Name: Display name of the artifact being deployed in the execution
Artifact Tag: Artifact tag being deployed
Deployment Type: Deployment type of the service
Environment Name: Name of the environment being used for the execution
Environment Type: Type of the environment(
Production/PreProduction)Rollback Duration: Rollback duration of the stage
RolledBack (Yes / No): Signifies if the stage execution did roll back
Service Name: Name of the service being deployed.
Service Stage End Time: End time of the CD stage
Service Stage Start Time: Start time of the CD stage
Service Stage Status: Status of the CD stage
List of measures:
Failed Service Deployments: No. of deployments that failed with
FAILED/ABORTEDstatusesFailure Rate: Failure rate of deployments(Failed Deployments divided by total no. of deployments)
Service Count: Distinct no. of services that got deployed
Success Rate: Success rate of the deployment
Successful Service Deployments: No. of executions that completed with
SUCCESSstatus.Total Service Deployments: Total no. of deployments
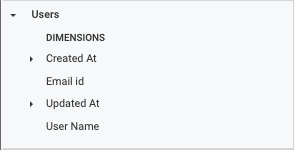
Users
This view contains the data related to users.

List of dimensions:
Created At: Time at which user was created
Email id: Email id of the user
Updated At: Time at which user was updated
User Name: User name
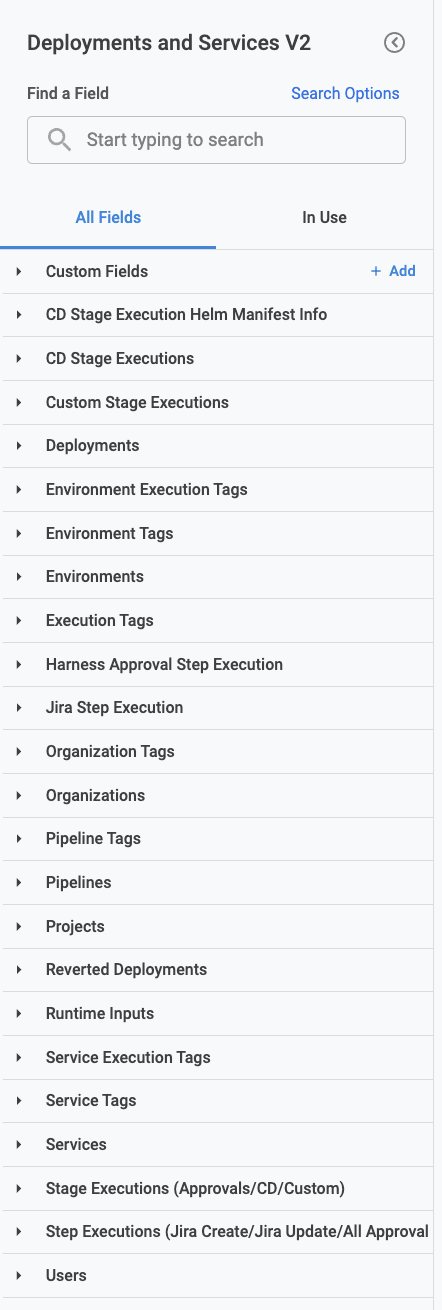
Deployments and Services V2
This explore can be used to visualize CD data related to pipeline, stage, and step executions. Each explore has a set of views. The views present in this explore are:

Let us go through each of the view listed in the above image, and describe the fields and it's usages.
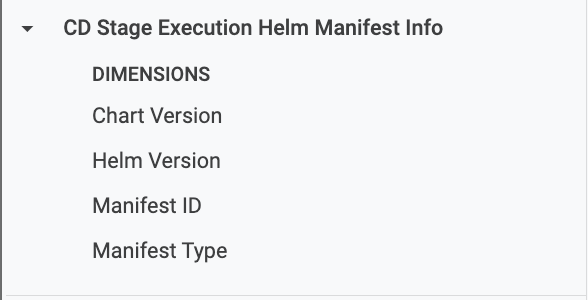
CD Stage Execution Helm Manifest Info
This view contains the data related to the Helm manifest info that is used in CD Stage executions. The data is recorded per CD stage execution, meaning if there are 10 executions of a single service that has a Helm manifest linked to it this view will also have 10 records.

List of dimensions:
Chart Version: Chart version of the manifest
Helm Version: Helm version of the manifest
Manifest ID: Manifest id configured in the service
Manifest Type: Type of the manifest, currently it only stores for manifest of type
HelmChart
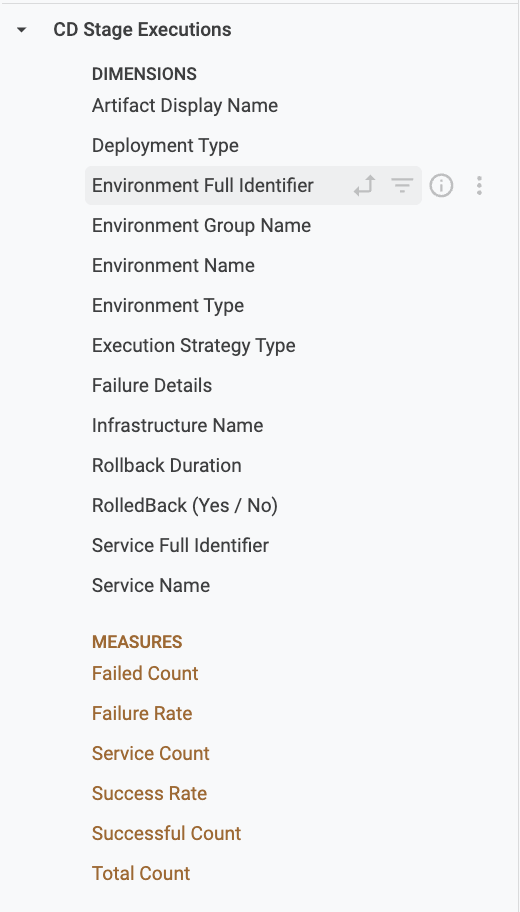
CD Stage Executions
This view contains data related to the CD stage executions. The data is recorded per CD stage execution, meaning if there are 10 pipeline executions that contain a single CD stage, then this view will also have 10 records.

List of dimensions:
Artifact Display Name: Display name of the artifact being deployed in the execution
Deployment Type: Deployment type of the service
Environment Full Identifier: Environment identifier being used for the execution
Environment Group Name: Name of the environment group being used for the execution
Environment Name: Name of the environment being used for the execution
Environment Type: Type of the environment(
Production/PreProduction)Execution Strategy Type: The execution strategy used for the execution. This filter only applies to executions that occur after it was added and does not retrieve strategy details for earlier executions.
Failure Details: Failure message of the execution(if the CD Stage failed)
Infrastructure Name: Name of the infrastructure being used for the execution
Rollback Duration: Rollback duration of the stage
RolledBack (Yes / No): Signifies if the stage execution did roll back
Service Name: Name of the service being deployed.
List of measures:
Failed Count: No. of stage executions that failed with
FAILED/ABORTED/EXPIREDstatuses.Failure Rate: Rate of failure(Failed Count divided by the total no. of stage executions)
Service Count: Count of distinct no. of services that got deployed.
Success Rate: Rate of success(Successful Count divided by the total no. of stage executions)
Successful Count: No. of stage executions that completed with
SUCCESS/SUCCEEDEDstatuses.Total Count: Total no. of stage executions
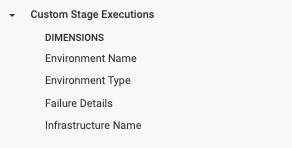
Custom Stage Executions
This view contains the data related to the Custom Stage executions. The data is recorded per Custom Stage Execution, meaning if there are 10 pipeline executions, which contain a single Custom stage, then this view will also have 10 records.

List of dimensions:
Environment Name: Name of the environment being used for the execution
Environment Type: Type of the environment(
Production/PreProduction)Failure Details: Failure message of the execution(if the Custom Stage failed)
Infrastructure Name: Name of the infrastructure being used for the execution
Deployments
This view contains the data related to the pipeline executions. The data is recorded per pipeline execution, meaning if there are 10 pipeline executions, then this view will also have 10 records.

Filter-only Field:
Current Aggregation Period:
List of dimensions:
Deployment Duration: Duration of the pipeline execution
End Time: End time of the pipeline execution
Execution Url: URL of pipeline execution
Organization ID: Organization identifier where the pipeline got executed
Pipeline Name: Name of the pipeline
Project ID: Project identifier where the pipeline got executed
Start Time: Start time of the pipeline execution
Status: Pipeline status(
RUNNING/ABORTED/SUCCESSetc.)Trigger Type: Type of trigger used to execute the pipeline(
MANUAL/WEBHOOKetc.)
List of measures:
Change Failure Rate: Total deployments that have been reverted divided by the total no. of deployments
Failed Deployments: No. of deployments that failed with
FAILED/ABORTEDstatusesFailure Rate: Failure rate of deployments(Failed Deployments divided by total no. of deployments)
Last Deployment: Last deployment time
Longest Deployment: Longest deployment time
Mean duration: Average pipeline duration
Mean duration trend: This compares the mean duration trend from the previous period to the current period
Median Duration: Median duration of the deployment
Success Rate: Success rate of deployments(deployments completed with
SUCCESSstatus)Total Deployments: Total no. of deployments
Total Deployments Trend: This compares the deployment count from the previous period to the current period
Execution Tags
This view contains the data related to the pipeline execution tags. It will contain the tags that were present in the pipeline at the start of the execution.

List of dimensions:
Execution tag: The execution tag is displayed as
key:value. If there are let's say 5 tags in a pipeline, there will be 5 rows having 1 tag(key:valuepair) in each row.
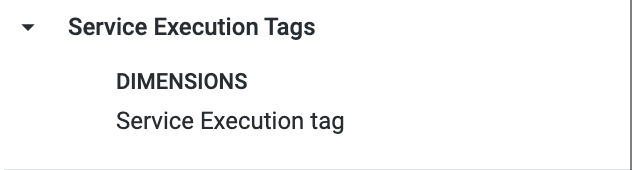
Service Execution Tags
This view contains the data related to the service execution tags. It will contain the tags that were present in the service at the start of the execution.

List of dimensions:
Service Execution tag: The execution tag is displayed as
key:value. If there are 5 tags in a service, there will be 5 rows having 1 tag(key:valuepair) in each row.
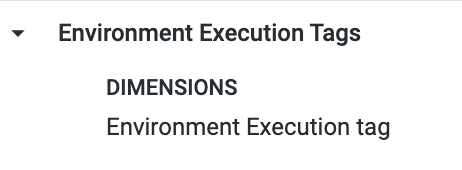
Environment Execution Tags
This view contains the data related to the environment execution tags. It will contain the tags that were present in the environment at the start of the execution.

List of dimensions:
Environment execution tag: The execution tag is displayed as
key:value. If there are 5 tags in a environment, there will be 5 rows having 1 tag (key:valuepair) in each row.
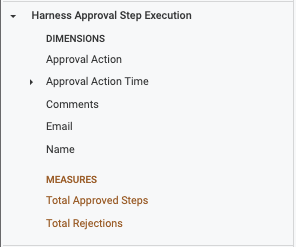
Harness Approval Step Execution
This view contains the data related to the Harness Approval Step Executions. If any field from this view is selected it will only show the data related to the executions which have a harness approval step. For e.g. if their are Jira approval and Harness Approval steps in a single pipeline execution, then selecting fields from this view, will only show Harness approval data.

List of dimensions:
Approval Action: Action taken for the approval(
APPROVE/REJECT)Approval Action Time: Time at which approval action was done
Comments: Comments added to the approval action
Email: Email of the user who took the action
Name: Name of the user who took the action
List of measures:
Total Approved Steps: Total no. of approved harness approval steps
Total Rejections: Total no. of rejected harness approval steps
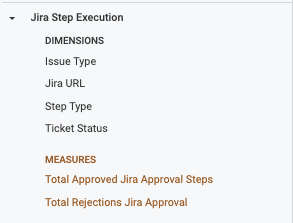
Jira Step Execution
This view contains the data related to the Jira Step Executions. If any field from this view is selected it will only show the data related to the executions which have a Jira steps(JIRA CREATE/UPDATE/APPROVAL). For e.g. if their are some Jira steps and Harness Approval steps in a single pipeline execution, then selecting fields from this view, will only show Jira steps data.

List of dimensions:
Issue Type: Jira ticket issue type
Jira URL: URL of the jira ticket
Step Type: Step type of the jira step(
JIRA CREATE/JIRA UPDATE/JIRA APPROVAL)Ticket Status: Status of the jira ticket
List of measures:
Total Approved Jira Approval Steps: Total no. of approved jira approval steps
Total Rejections Jira Approval: Total no. of rejected jira approval steps
Organization Tags
This view contains the data related to the organization tags. It will contain the real-time tags of the organization.

List of dimensions:
Organization tag: The organization tag, it will be displayed as
key:value. If there are let's say 5 tags in an organization, there will be 5 rows having 1 tag(key:valuepair) in each row.
Organizations
This view contains the data related to organizations.

List of dimensions:
Organization Name: The name of the organization where the pipeline execution happened.
Pipeline Tags
This view contains the data related to the pipeline tags. It will contain the real-time tags of the pipeline.

List of dimensions:
Pipeline tag: The pipeline tag, it will be displayed as
key:value. If there are let's say 5 tags in a pipeline, there will be 5 rows having 1 tag(key:valuepair) in each row.
You may want to see this dimension in all one column. To do this, right click on the dimension/column and select Unpivot.

Service Tags
Displays a list of tags associated with a service.

List of dimensions:
Service tag: The service tag is displayed as
key:value. For example, if there are 5 tags in a service, there will be 5 rows having 1 tag (key:valuepair) in each row.
Environment Tags
Displays a list of tags associated with a environment.

List of dimensions:
Environment tag: The environment tag is displayed as
key:value. For example, if there are 5 tags in a environment, there will be 5 rows having 1 tag (key:valuepair) in each row.
Pipelines
This view contains the data related to the pipelines.

List of dimensions:
Created Time: Creation time of the pipeline
Modified Name: Modification time of the pipeline
Pipeline Name: Name of the pipeline
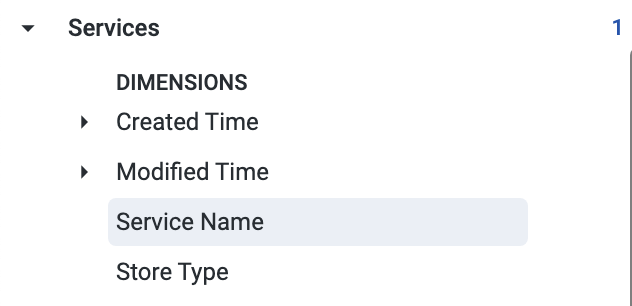
Services
This view contains the data related to the service.

List of dimensions:
Created Time: Creation time of the service
Modified Name: Modification time of the service
Service Name: Name of the Service
Store Type: Indicates whether Service as INLINE OR REMOTE.
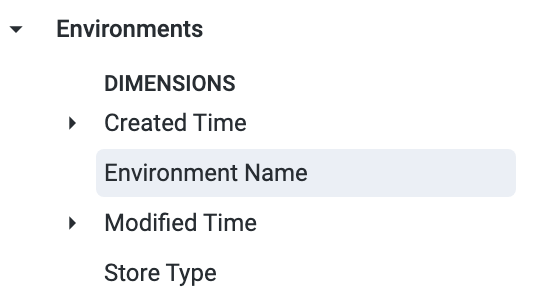
Environments
This view contains the data related to the environment.

List of dimensions:
Created Time: Creation time of the environment
Modified Name: Modification time of the environment
Environment Name: Name of the environment
Store Type: Indicates whether environment as INLINE OR REMOTE.
Projects
This view contains the data related to the projects.

List of dimensions:
Created Time: Creation time of the project
Modified Name: Modification time of the project
Project Name: Name of the project
Reverted Deployments
This view contains the data related to the pipeline executions which have been reverted.

Filter-only Field:
Current Aggregation Period:
List of dimensions:
Deployment Duration: Duration of the pipeline execution
End Time: End time of the pipeline execution
Is Revert Execution (Yes / No): Specifies if the execution got reverted
Organization ID: Organization identifier where the pipeline got executed
Original Execution ID: Original execution id of the pipeline which got reverted
Pipeline Name: Name of the pipeline
Project ID: Project identifier where the pipeline got executed
Start Time: Start time of the pipeline execution
Status: Pipeline status(
RUNNING/ABORTED/SUCCESSetc.)Trigger Type: Type of trigger used to execute the pipeline(
MANUAL/WEBHOOKetc.)
List of measures:
Failed Deployments: No. of deployments that failed with
FAILED/ABORTEDstatusesFailure Rate: Failure rate of deployments(Failed Deployments divided by total no. of deployments)
Last Deployment: Last deployment time
Longest Deployment: Longest deployment time
Mean duration: Average pipeline duration
Mean duration trend: This compares the mean duration trend from the previous period to the current period
Mean Time to Restore: Measures the mean time to restore
Median Duration: Median duration of the deployment
Success Rate: Success rate of deployments(deployments completed with
SUCCESSstatus)Total Deployments: Total no. of deployments
Total Deployments Trend: This compares the deployment count from the previous period to the current period
Runtime Inputs
This view contains the data related to the runtime inputs provided at the time of the pipeline execution. This will contain only the user provided runtime inputs when a pipeline is executed.

List of dimensions:
FQN: FQN of the runtime input
Input Key: Key of the runtime input
Input Value: Value given to the runtime input
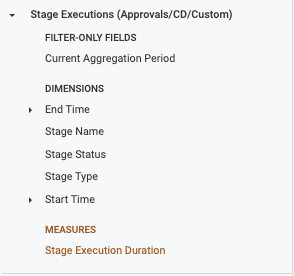
Stage Executions (Approvals/CD/Custom)
This view contains the data related to the stage executions. Currently, it only shows data for Approvals/CD and Custom stages.

Filter-only Field:
Current Aggregation Period:
List of dimensions:
End Time: End time of the stage execution
Stage Name: Name of the stage
Stage Status: Current status of the stage(
RUNNING/FAILEDetc.)Stage Type: Type of the stage(
Approvals/CD/Custom)Start Time: Start time of the stage execution
List of measures:
Stage Execution Duration: Average stage execution duration
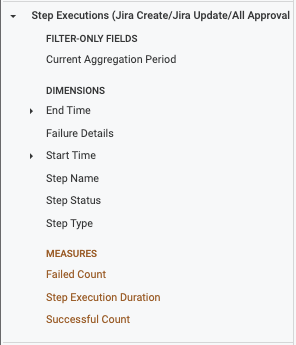
Step Executions (Jira Create/Jira Update/All Approval Steps)
This view contains the data related to the step executions. Currently, it only shows data for these steps:
Jira Create
Jira Update
Jira Approval
Custom Approval
ServiceNow Approval
Harness Approval

Click to view full size image
Filter-only Field:
Current Aggregation Period:
List of dimensions:
End Time: End time of the step execution
Failure Details: Failure message of the step(if it failed)
Start Time: Start time of the step execution
Step Name: Name of the step
Step Status: Current status of the step(
RUNNING/FAILEDetc.)Step Type: Type of the step
List of measures:
Failed Count: No. of step executions that failed with
FAILED/ABORTED/EXPIREDstatuses.Step Execution Duration: Average step execution duration
Successful Count: No. of step executions that completed with
SUCCESS/SUCCEEDEDstatuses.
Users
This view contains the data related to the users.

List of dimensions:
Created At: Time at which user was created
Email id: Email id of the user
Updated At: Time at which user was updated
User Name: User name
Troubleshooting
This section covers common questions and issues you may encounter when working with custom dashboards for CD deployments.
Understanding drill-down behavior
When you click on a deployment metric in a dashboard widget (for example, clicking on a bar in a "Deployment Frequency" chart), a drill-down page opens showing detailed pipeline execution data.
How drill-down works:
The drill-down displays data at the stage level, not the pipeline level. Each row in the drill-down represents a unique combination of:
Pipeline execution
Service name
Environment name
Start time
End time
Other stage-specific attributes
Key point: If a pipeline has multiple CD stages (for example, 2 stages deploying to different environments), the drill-down will show multiple rows for that single pipeline execution — one row per stage.
Example:
A pipeline executes once with 2 stages (Deploy to QA, Deploy to Prod)
The widget shows: 1 deployment
The drill-down shows: 2 rows (one for each stage)
This is expected behavior because the drill-down provides stage-level details including service, environment, and timing information for each deployment stage.
Dashboard count mismatch between widget and drill-down
Issue: The count displayed in a dashboard widget (for example, "Total Deployments - Prod: 10") does not match the number of rows shown when you click through to the drill-down view (for example, 20 rows).
Cause: This is expected behavior, not a bug. As explained above:
Widget count: Shows the number of pipeline executions (counts each pipeline once)
Drill-down rows: Shows stage-level details where each row represents a stage execution
Example:
A pipeline with 2 CD stages executes 10 times
Widget shows: 10 deployments
Drill-down shows: 20 rows (10 pipelines × 2 stages)
The drill-down gives you stage-level visibility so you can see exactly which services were deployed to which environments in each pipeline execution.
Dashboard not showing recent data
Issue: Dashboard widgets stop displaying data after a certain date, even though pipelines continue to execute successfully.
Possible causes:
Data synchronization issue: The Change Data Capture (CDC) service that synchronizes execution data to the dashboards may have experienced an interruption.
Dashboard configuration: The dashboard may have date filters or time range settings that exclude recent data.
Troubleshooting steps:
Check your dashboard filters:
Review the time range filter on your dashboard
Ensure date filters are set to include recent data
Check if any custom filters are excluding recent executions
Verify pipeline executions:
Confirm that pipelines are executing successfully in the Harness UI
Check the execution history to ensure data is being generated
Test with a new widget:
Create a new widget using the same explore (for example, "Deployments and Services V2")
If the new widget shows current data, the issue may be with the specific widget configuration
Consider recreating affected widgets
Contact Harness Support:
If the issue persists across multiple dashboards and widgets, there may be a data synchronization issue
Provide the dashboard URL and the date range when data stopped appearing
Include information about which explores are affected
Last updated
Was this helpful?