> For the complete documentation index, see [llms.txt](https://developer.harness.io/llms.txt). Markdown versions of documentation pages are available by appending `.md` to page URLs; this page is available as [Markdown](https://developer.harness.io/continuous-error-tracking/event-explorer/event-distribution.md).
# Event Distribution Graph
Explore Event Distribution Graph features.
{% hint style="info" %}
**NOTE**
This feature is behind the feature flag `CET_EVENTS_CHART`. Contact [Harness Support](mailto:support@harness.io) to enable the feature.
{% endhint %}
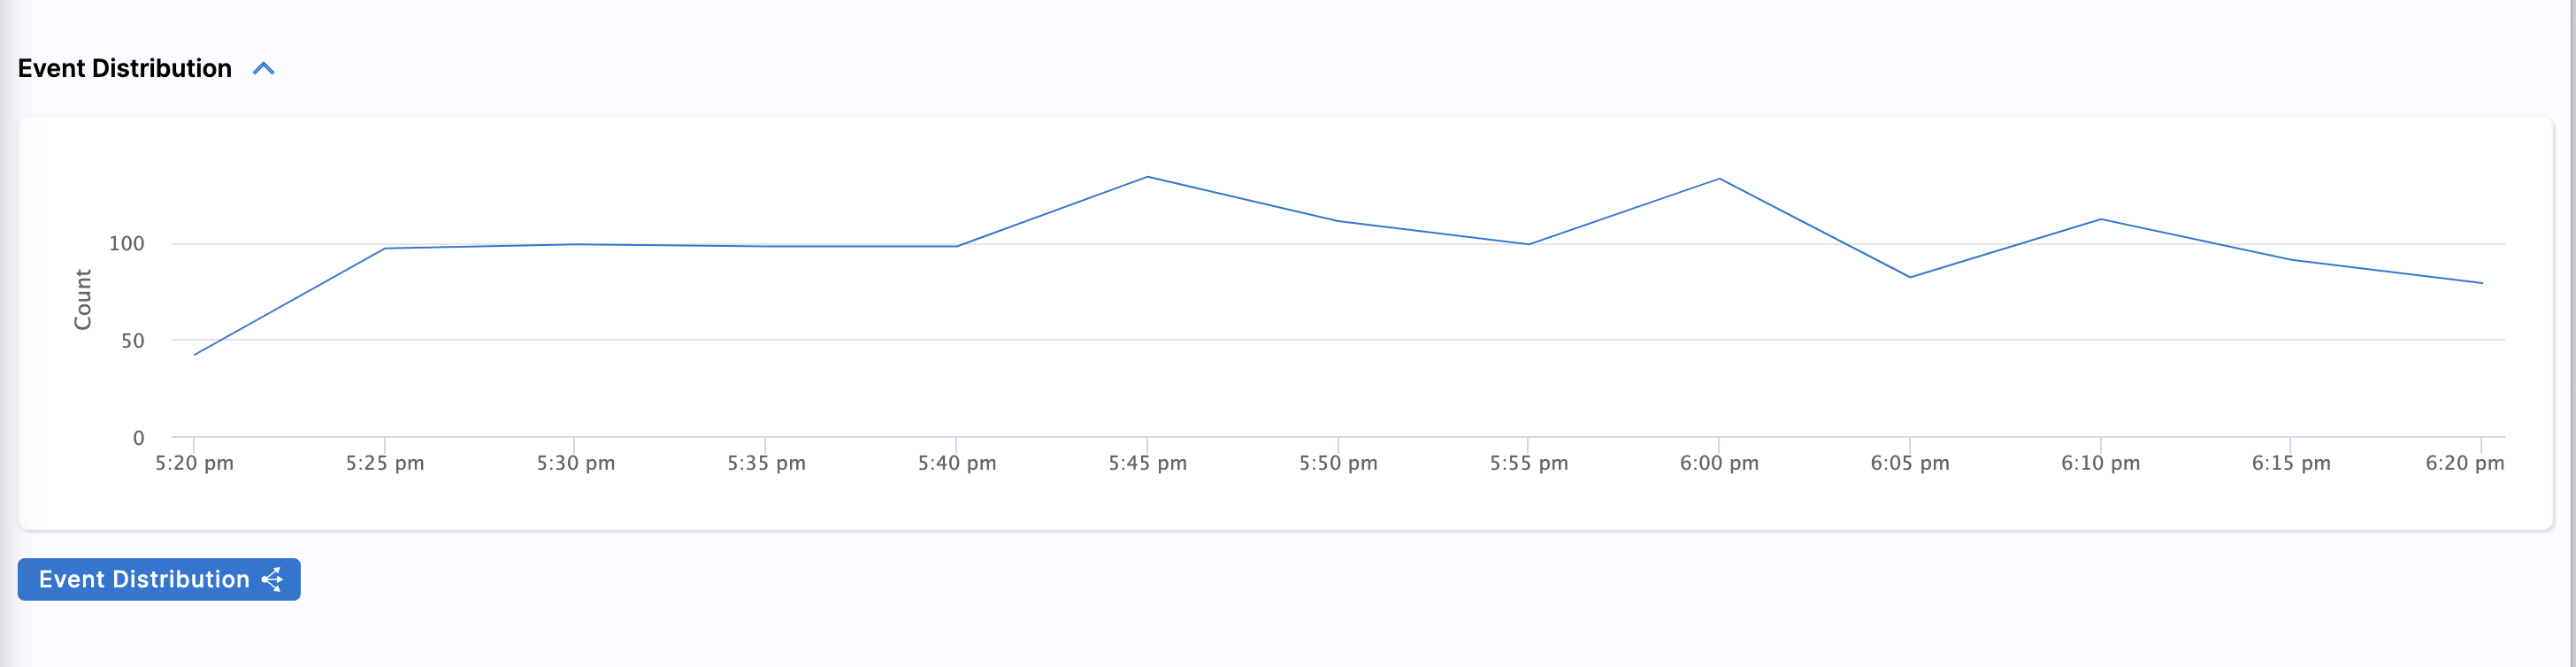
The Event Distribution Graph provides an interactive visual representation of event volume within the selected timeframe and view. It helps you analyze historical performance metrics and track error counts within your specified time interval.
This topic describes the Event Distribution Graph features and how to use them.
### View the Event Distribution Graph
To access the Event Distribution Graph, follow these steps:
* Select the expandable **Event Distribution** button.
The graph appears, displaying historical performance metrics and the total count of errors across your chosen time interval.
### Add events to the graph
To include a new event in the graph, follow these steps:
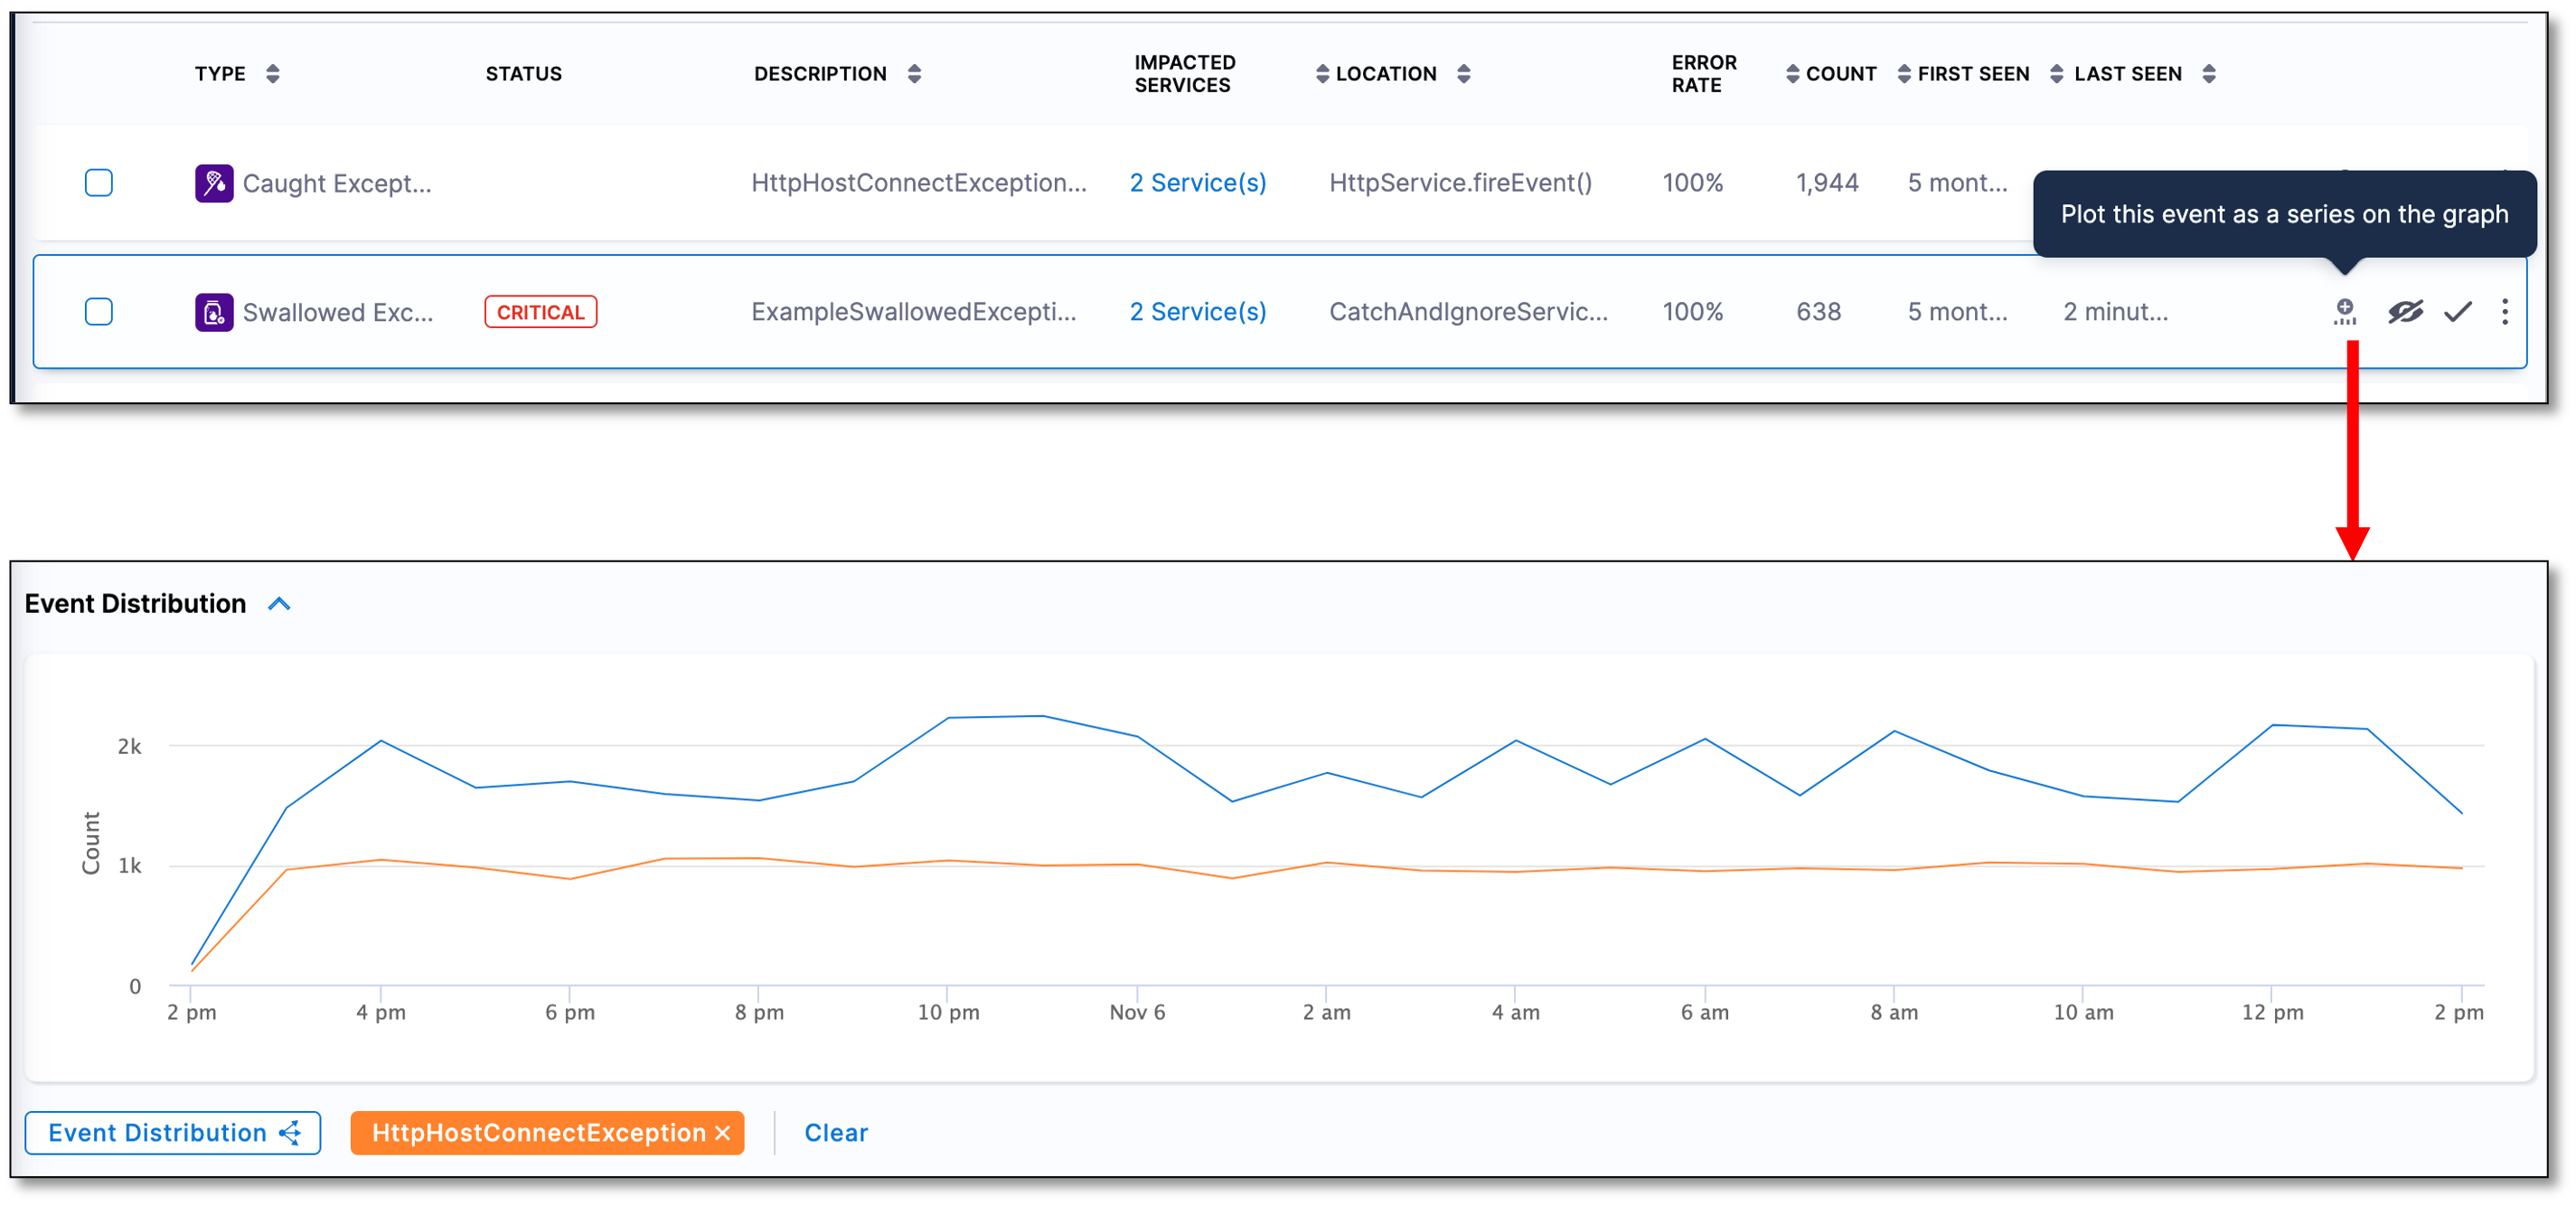
1. Select the + icon located in the last column.
2. Enter the event details in the provided fields.
The newly added event is displayed on the chart.
### Display top events
To quickly identify high-impact errors, follow these steps:
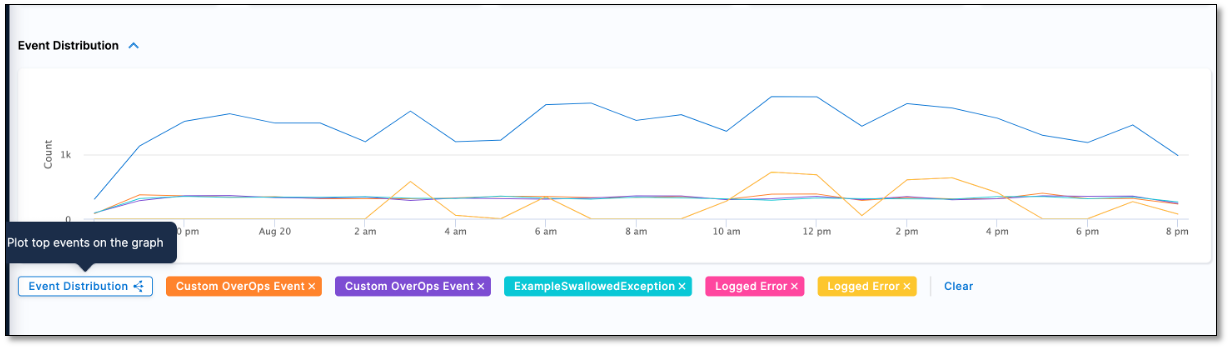
* Select the **Event Distribution split series** icon.
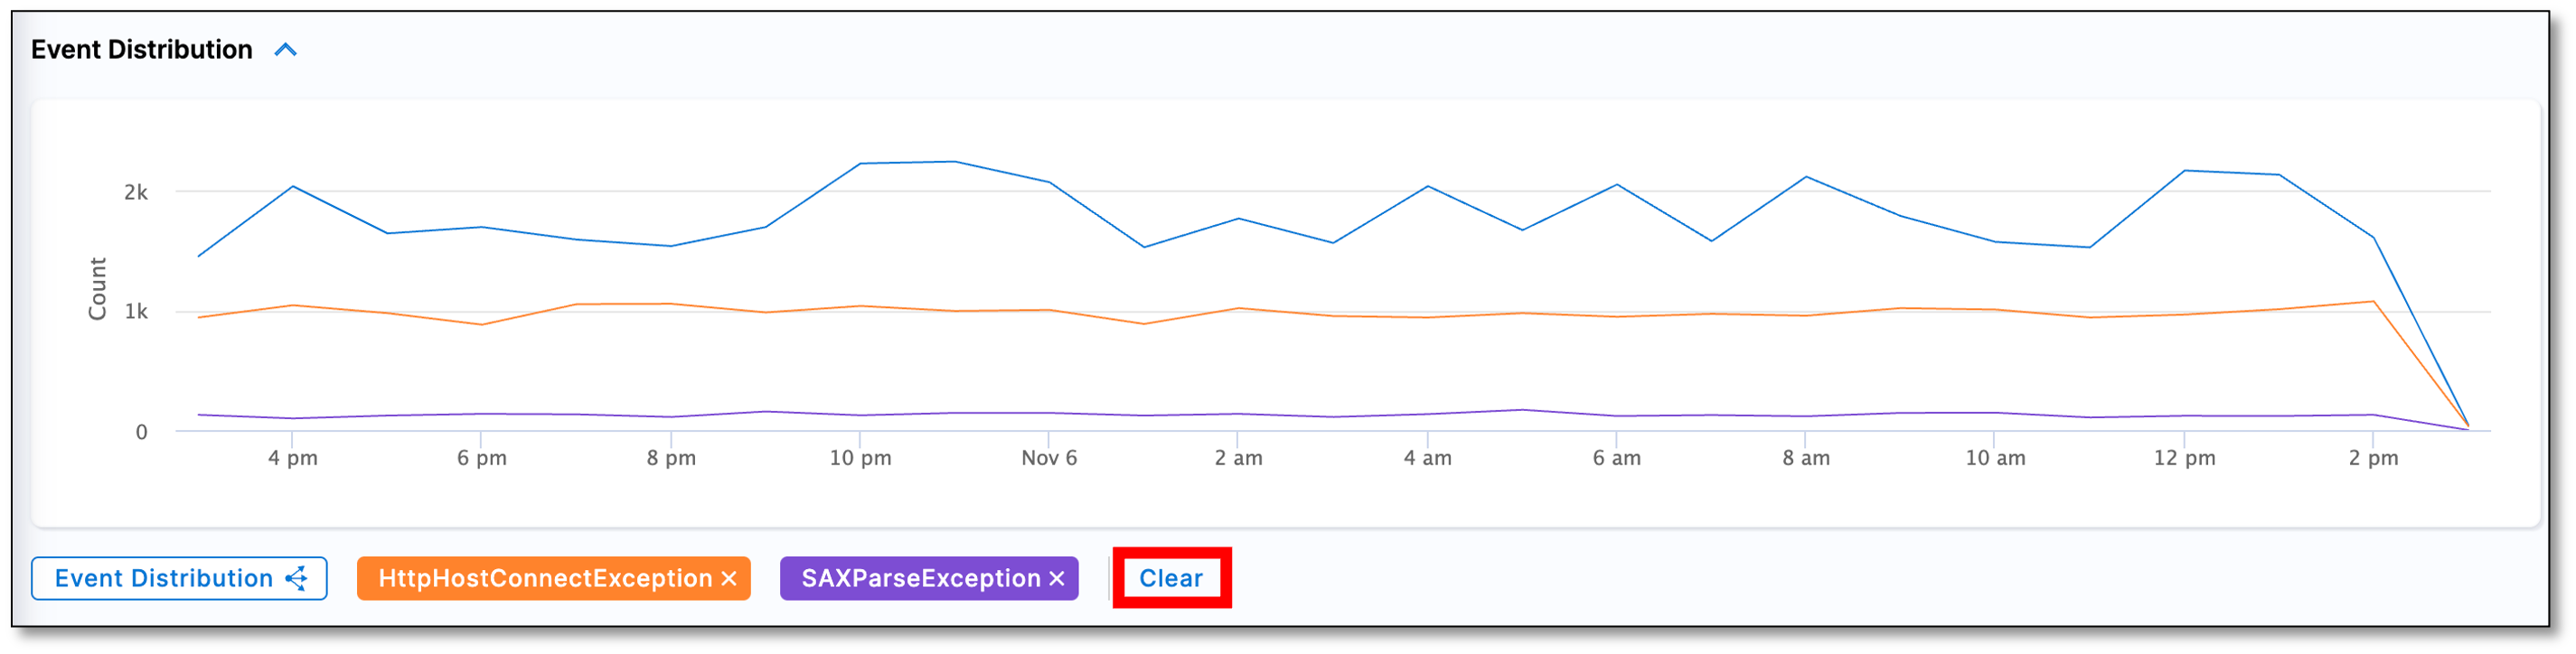
This adds the top error events as a series on the graph, providing an immediate overview of critical issues requiring attention.
### Remove events from the graph
To remove events from the Event Distribution Graph, use one of the following methods:
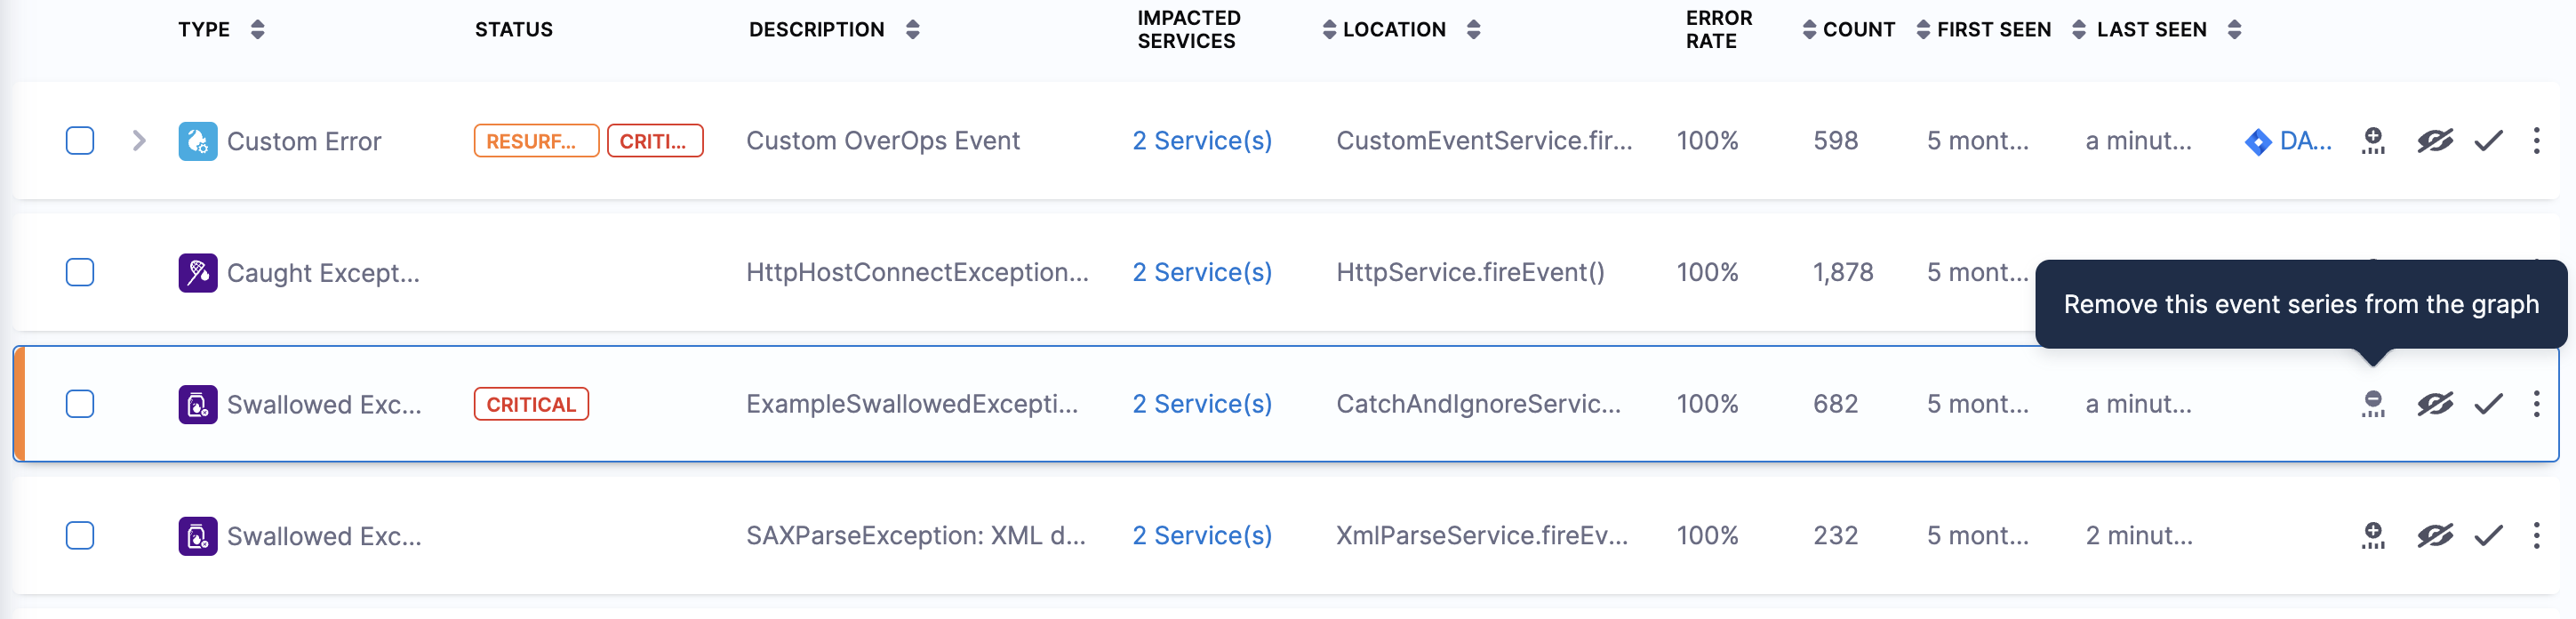
* Remove an Event: Select the remove icon next to the event you wish to remove.
* Remove All Events: Choose the Clear option to remove all events from the graph.
### Customize timeframes
You can tailor the graph to your preferences by adjusting the timeframes using one of the following methods:
* Time Period: Select this option and choose a specific time period for data display. The default is Last 1 hour.
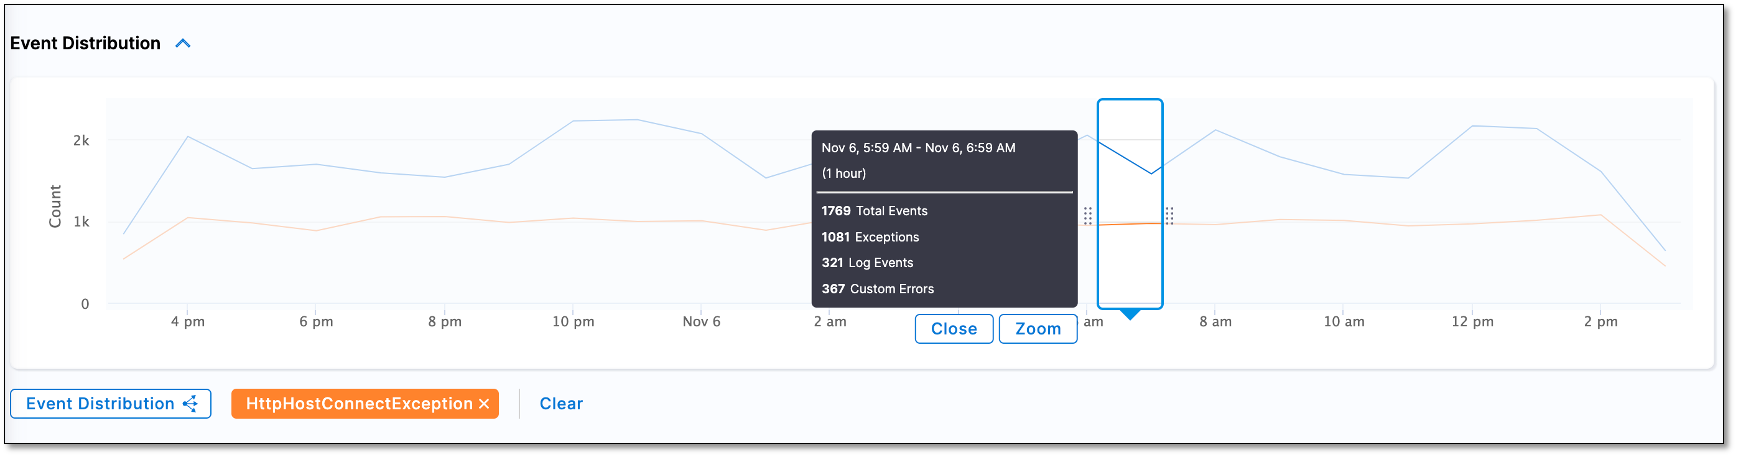
* Time Slice: Click on the graph to open a concise time slice pane. You can expand or shrink the time slice according to your preferred timeframe.
### Collapse the event graph
Click **Event Distribution** to collapse the Event Distribution Graph.
{% @harness-feedback/feedback %}