Configure Prometheus Probe
This topic describes the configuration and usage of Prometheus probe.
Before you begin, review the following:
Configuration
-
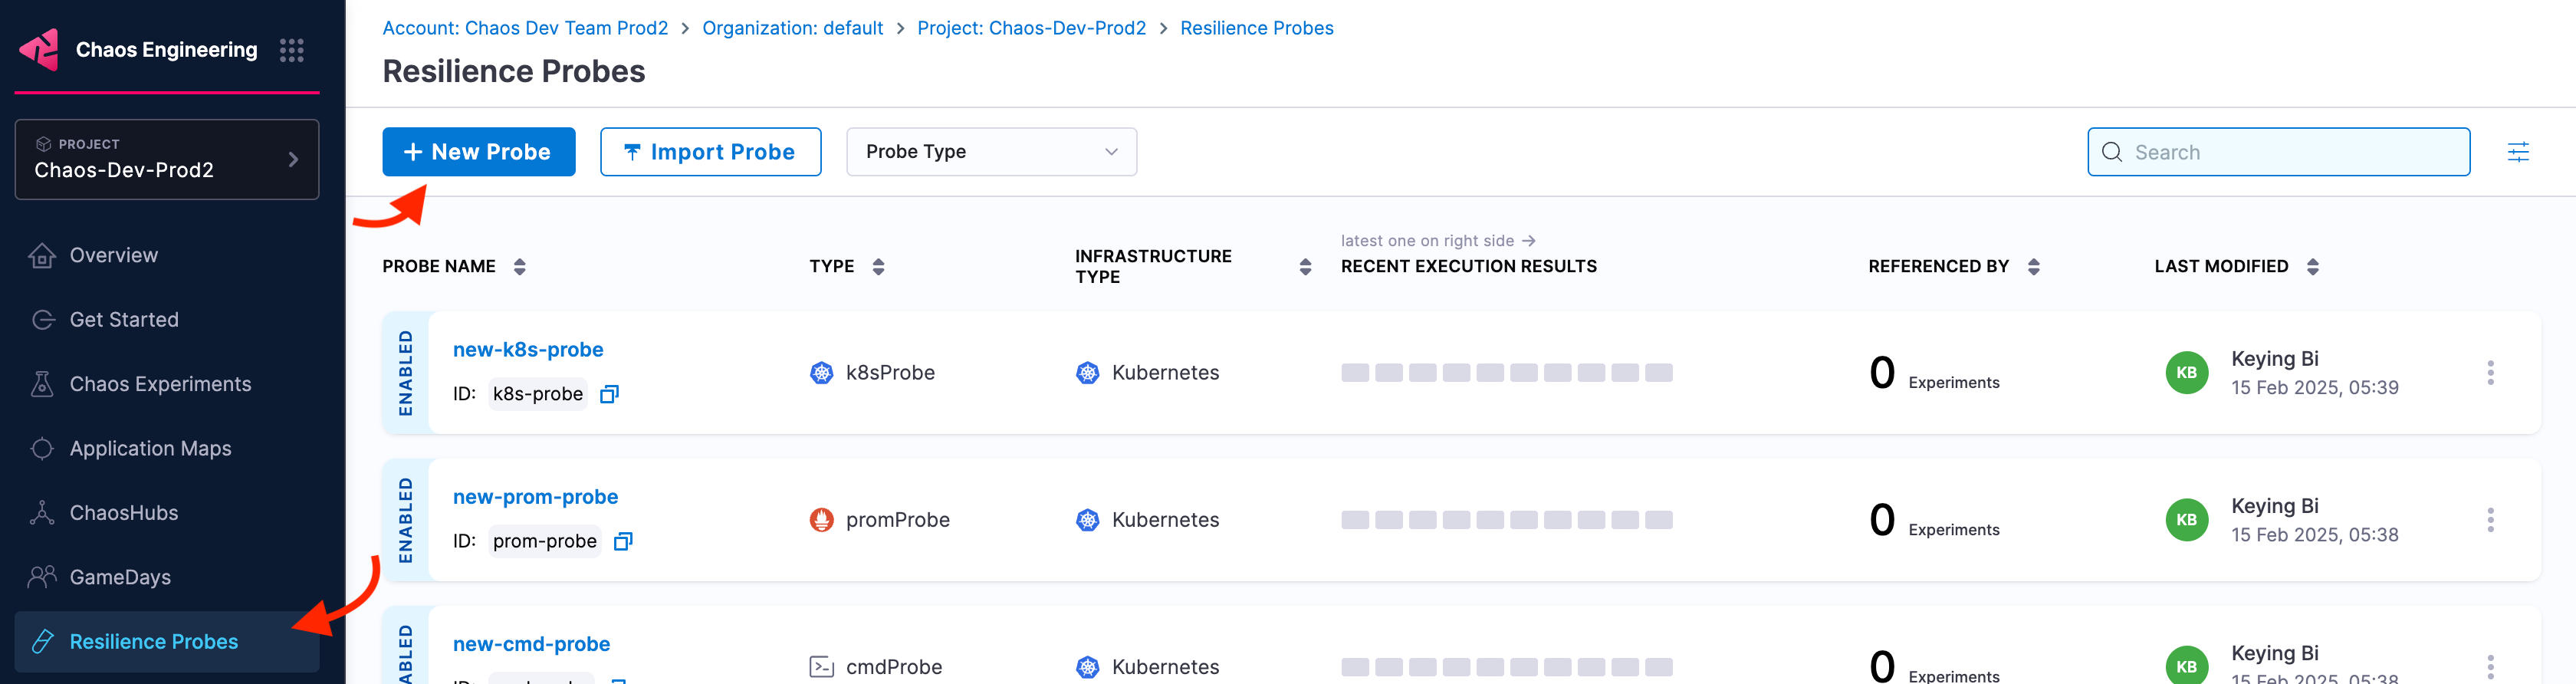
Go to Chaos Engineering module and select Resilience Probes. Select New Probe.
-
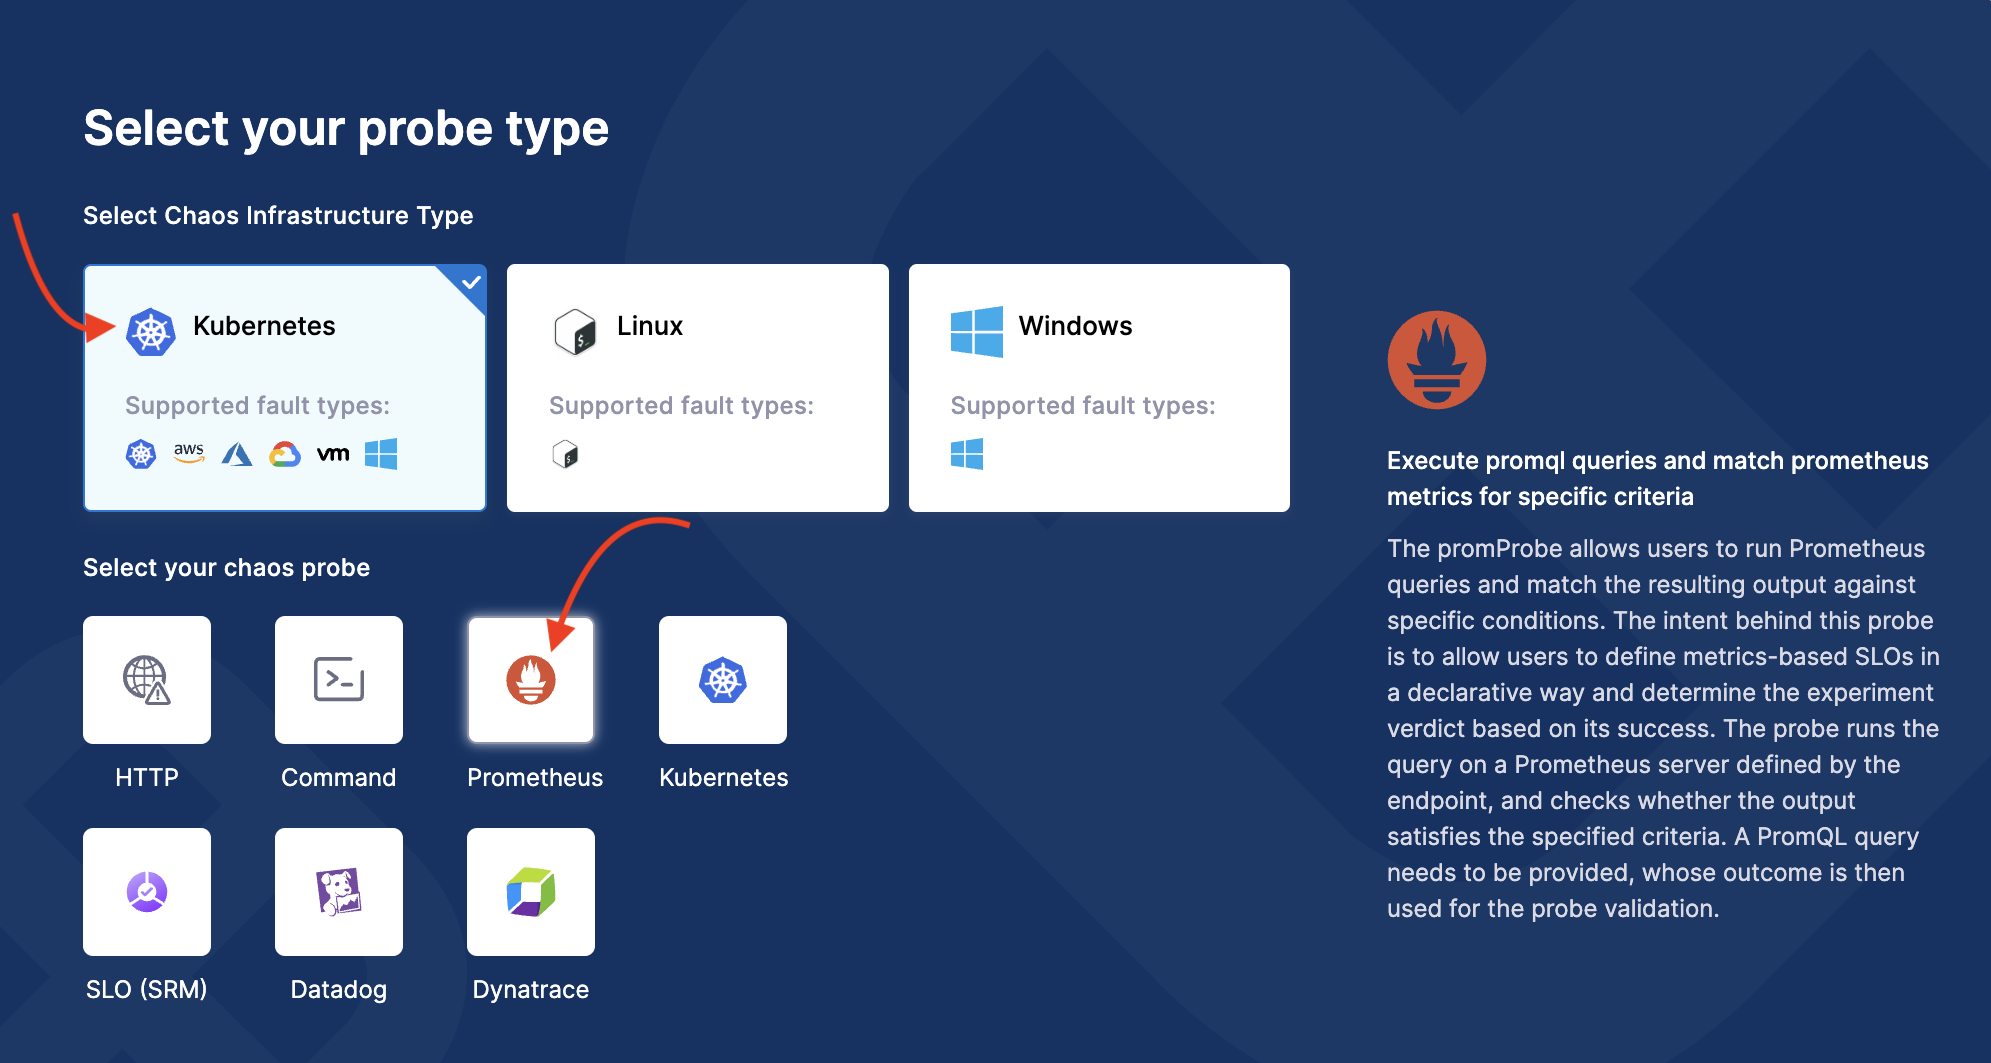
Select infrastructure type as Kubernetes and chaos probe as Prometheus.
-
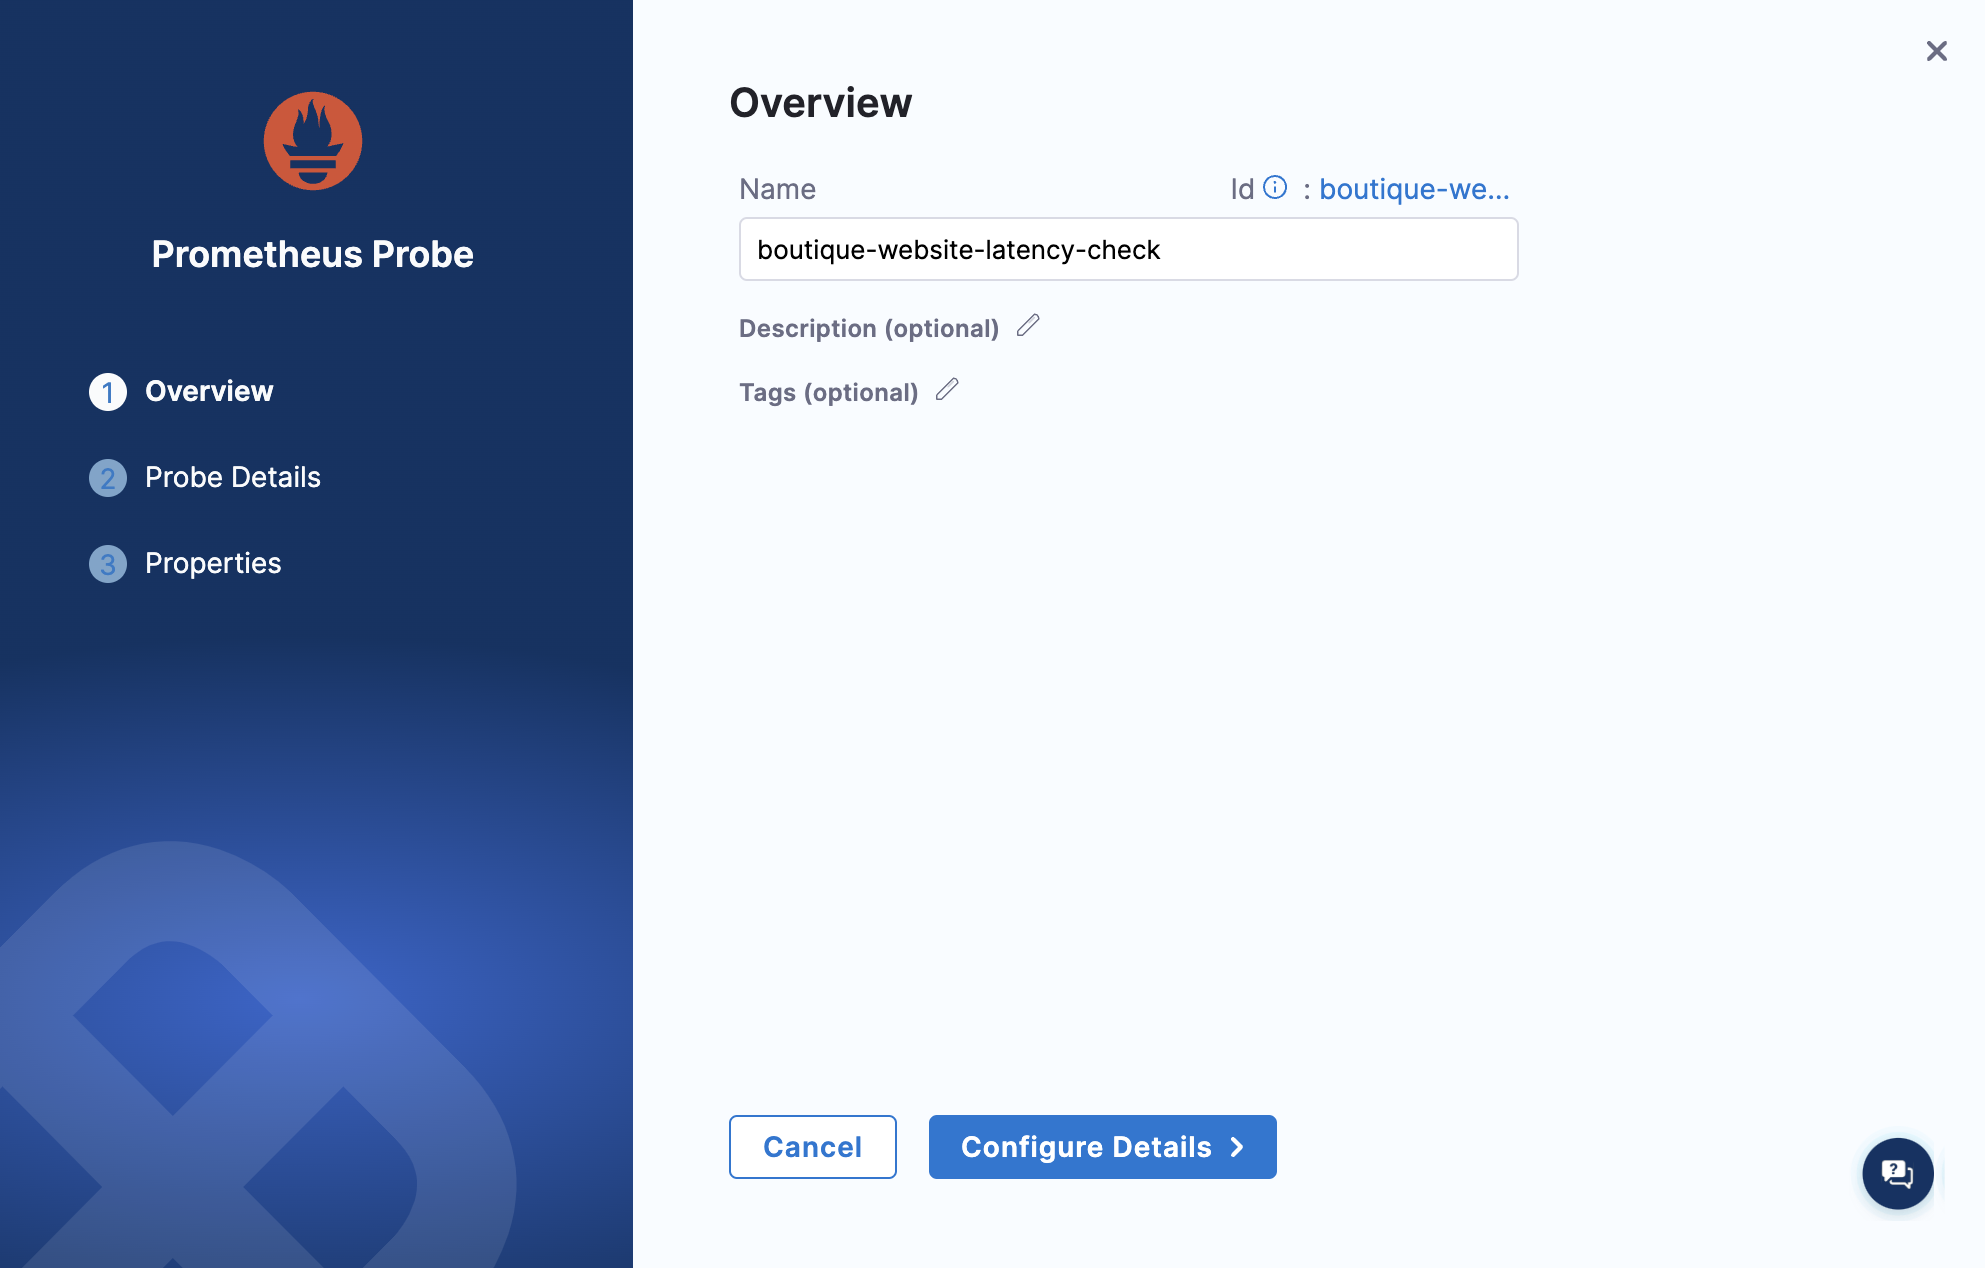
Provide the name, and click Configure Details.
-
Based on your application's requirements, provide values for the following parameters.
-
Prometheus Endpoint: It is the target HTTP/HTTPS endpoint that the probe will send requests to.

-
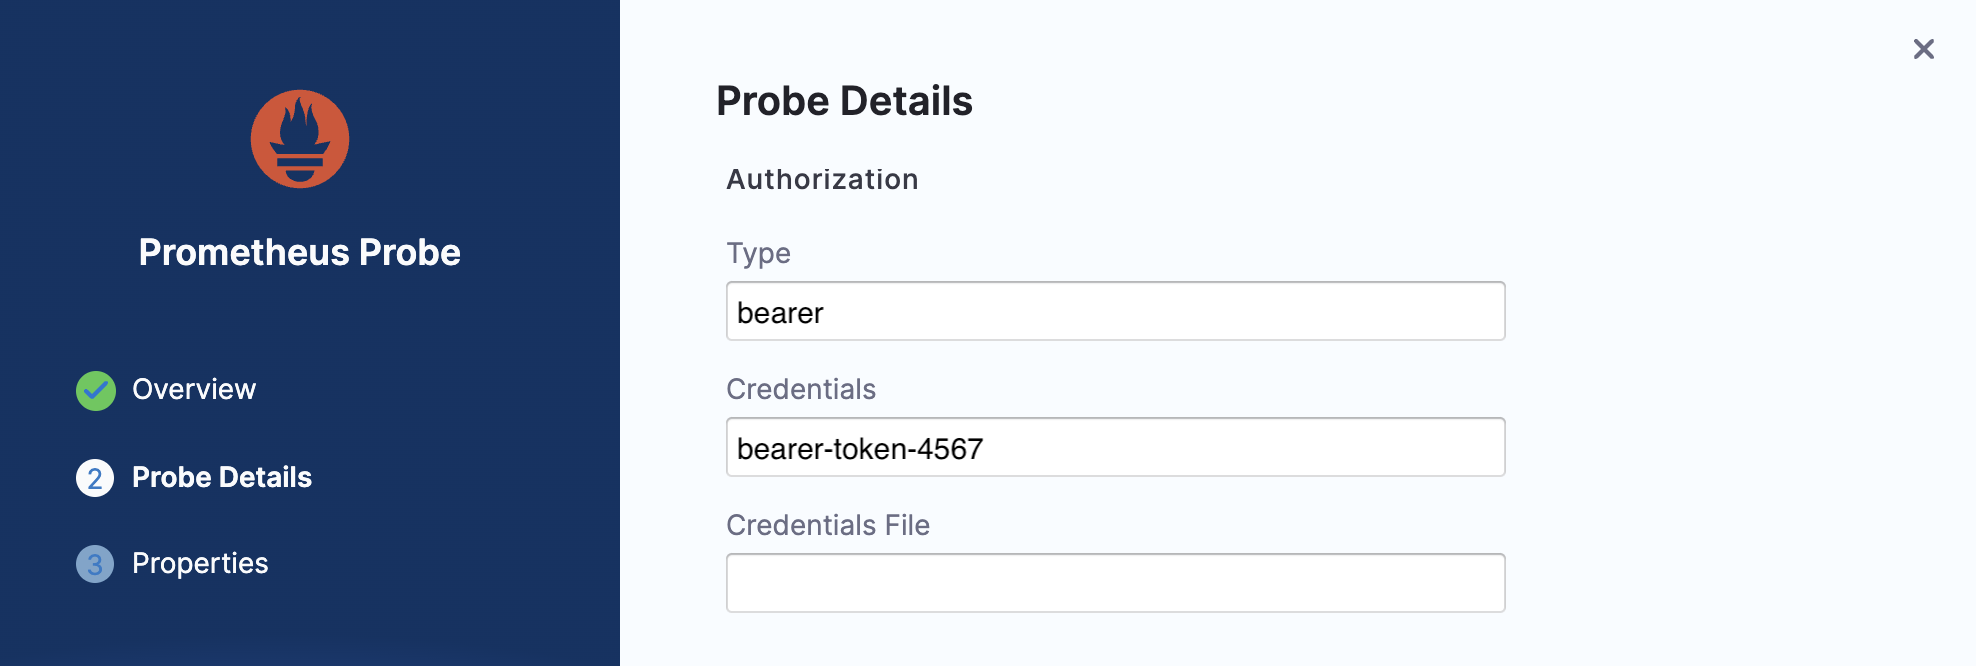
Authorization section has the following fields:
- Type: Type of HTTP request to be performed. Supports
GETandPOST. - Credentials: Authentication credentials (username and password) required to access the target URL/endpoint. This field is mutually exclusive with Credentials file field.
- Credentials file: Path of the file that contains authentication credentials to access the HTTP endpoint. This field is mutually exclusive with Credentials field.
Go to Authorization for more information.
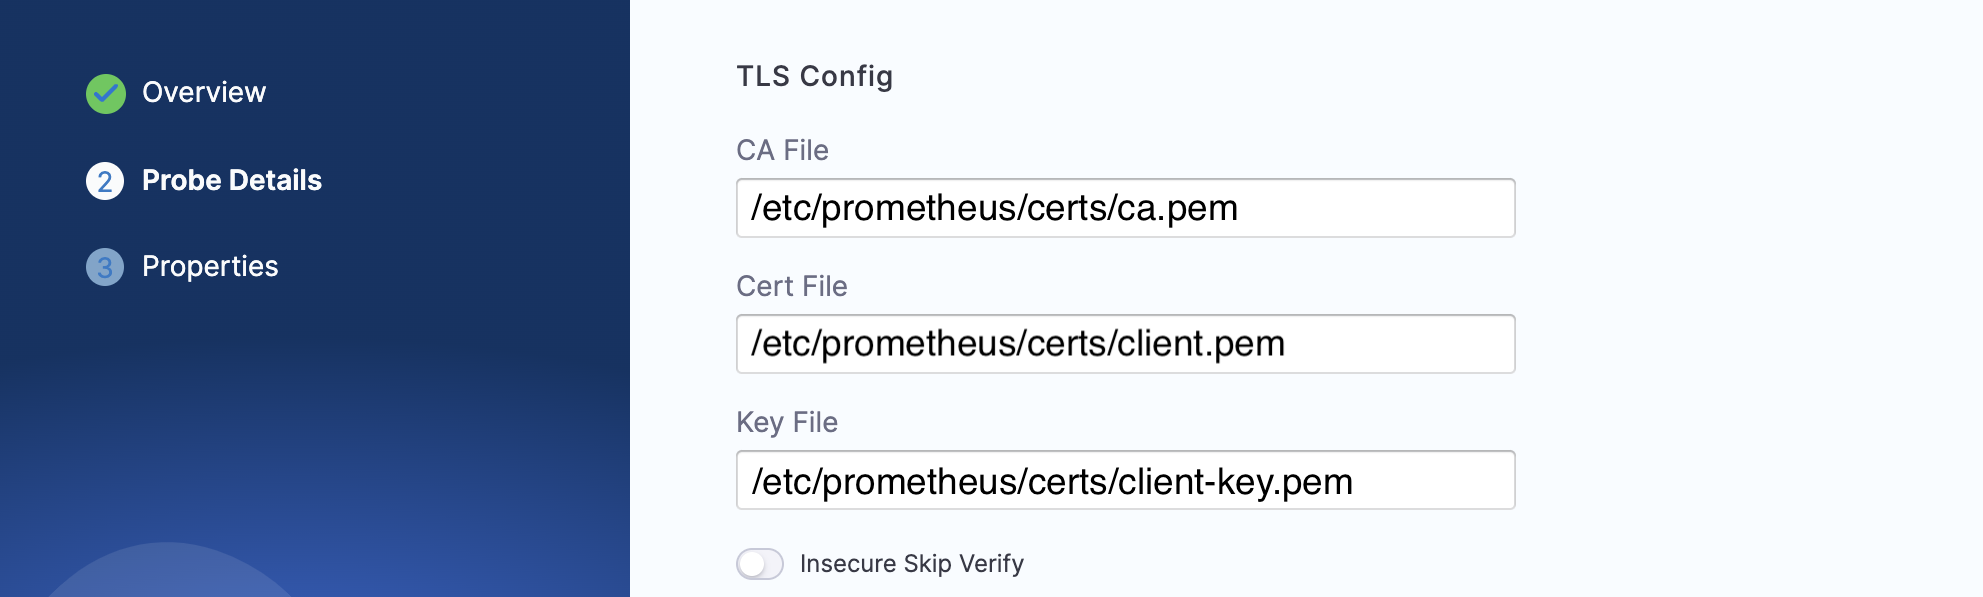
TLS Config has the following fields:
- CA file: Path of the file to validate the custom certificates for TLS of the target URL.
- Cert file: Path of the file to the client certificate required for mTLS.
- Key file: Path of the file to the client key required for mTLS.
- Insecure Skip Verify: If enabled, the probe bypasses the SSL/TLS certificate verification, allowing requests to proceed even if the certificate is invalid or self-signed.
Go to TLS for more information.
- Type: Type of HTTP request to be performed. Supports
-
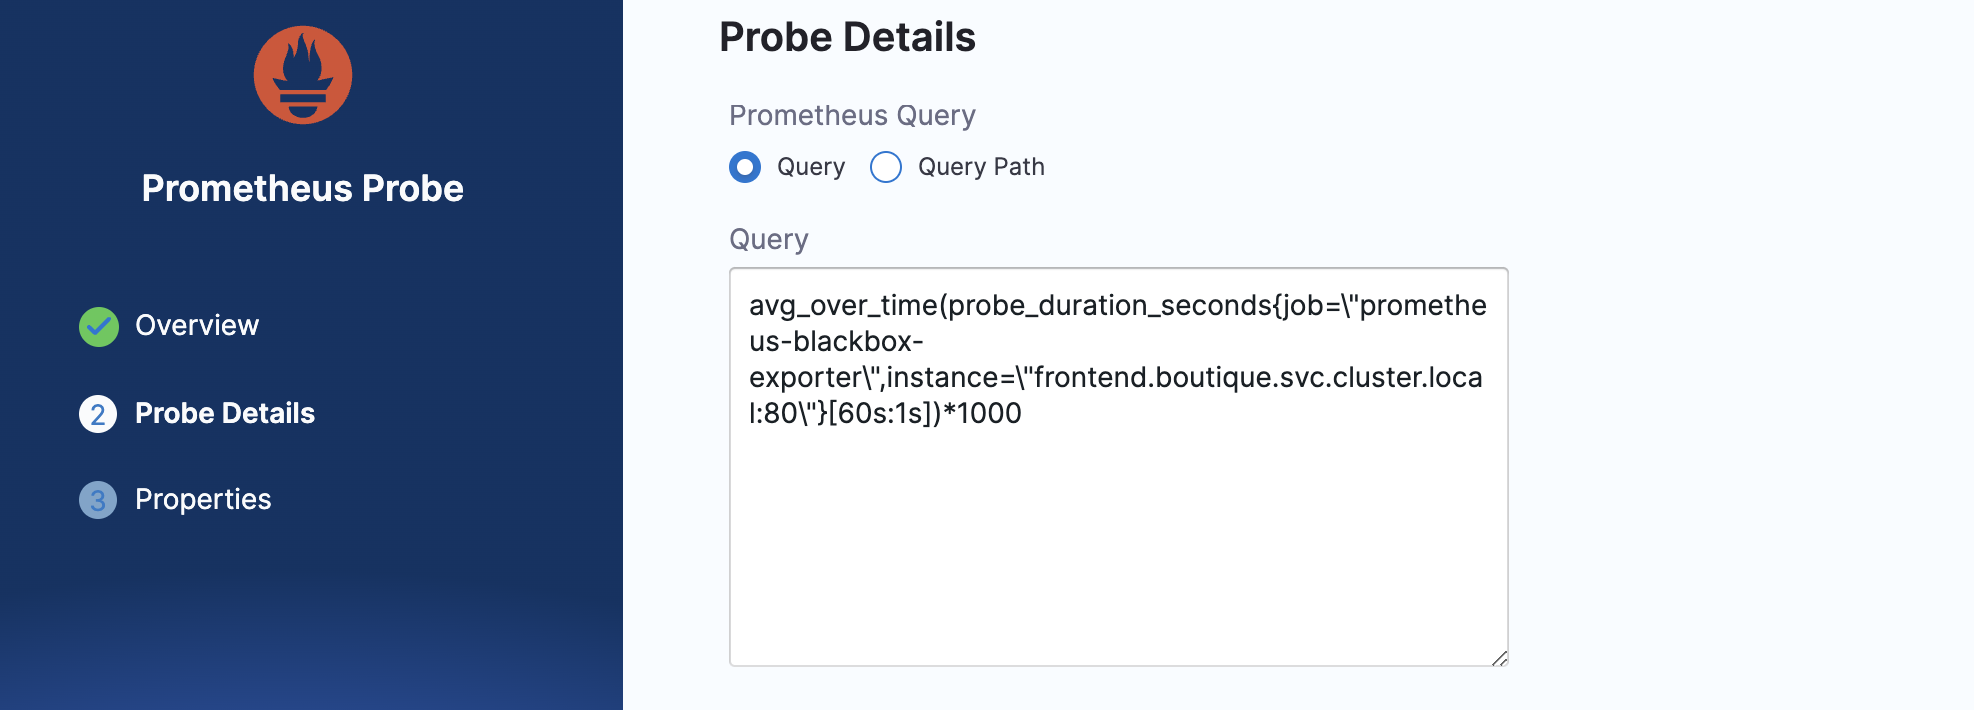
Provide the Prometheus Query (Query or Query Path depending on your usage).
- Query: The PromQL query used with the probe to fetch the desired Prometheus metrics. Ensure that the strings inside the query are enclosed within backslash ("/"). This field is mutually exclusive with Query Path field.
- Query Path: Path of the file where PromQL query is present. This field is mutually exclusive with Query field.
Go to Schema for more information.
-
Specify the data comparison fields, and click Configure Properties.
The data returned using the PromQL Query or Query Path is compared to the following fields:
- Type: Type of data compared with result of Prometheus query. Accepts only
floatdata type. - Comparison Criteria: The criteria (
>=,<=,==,<,>,!=, and so on) based on which the value and the result of Prometheus query are compared. - Value: The value with which the result of Prometheus query is compared
Go to Comparator for more information.

- Type: Type of data compared with result of Prometheus query. Accepts only
-
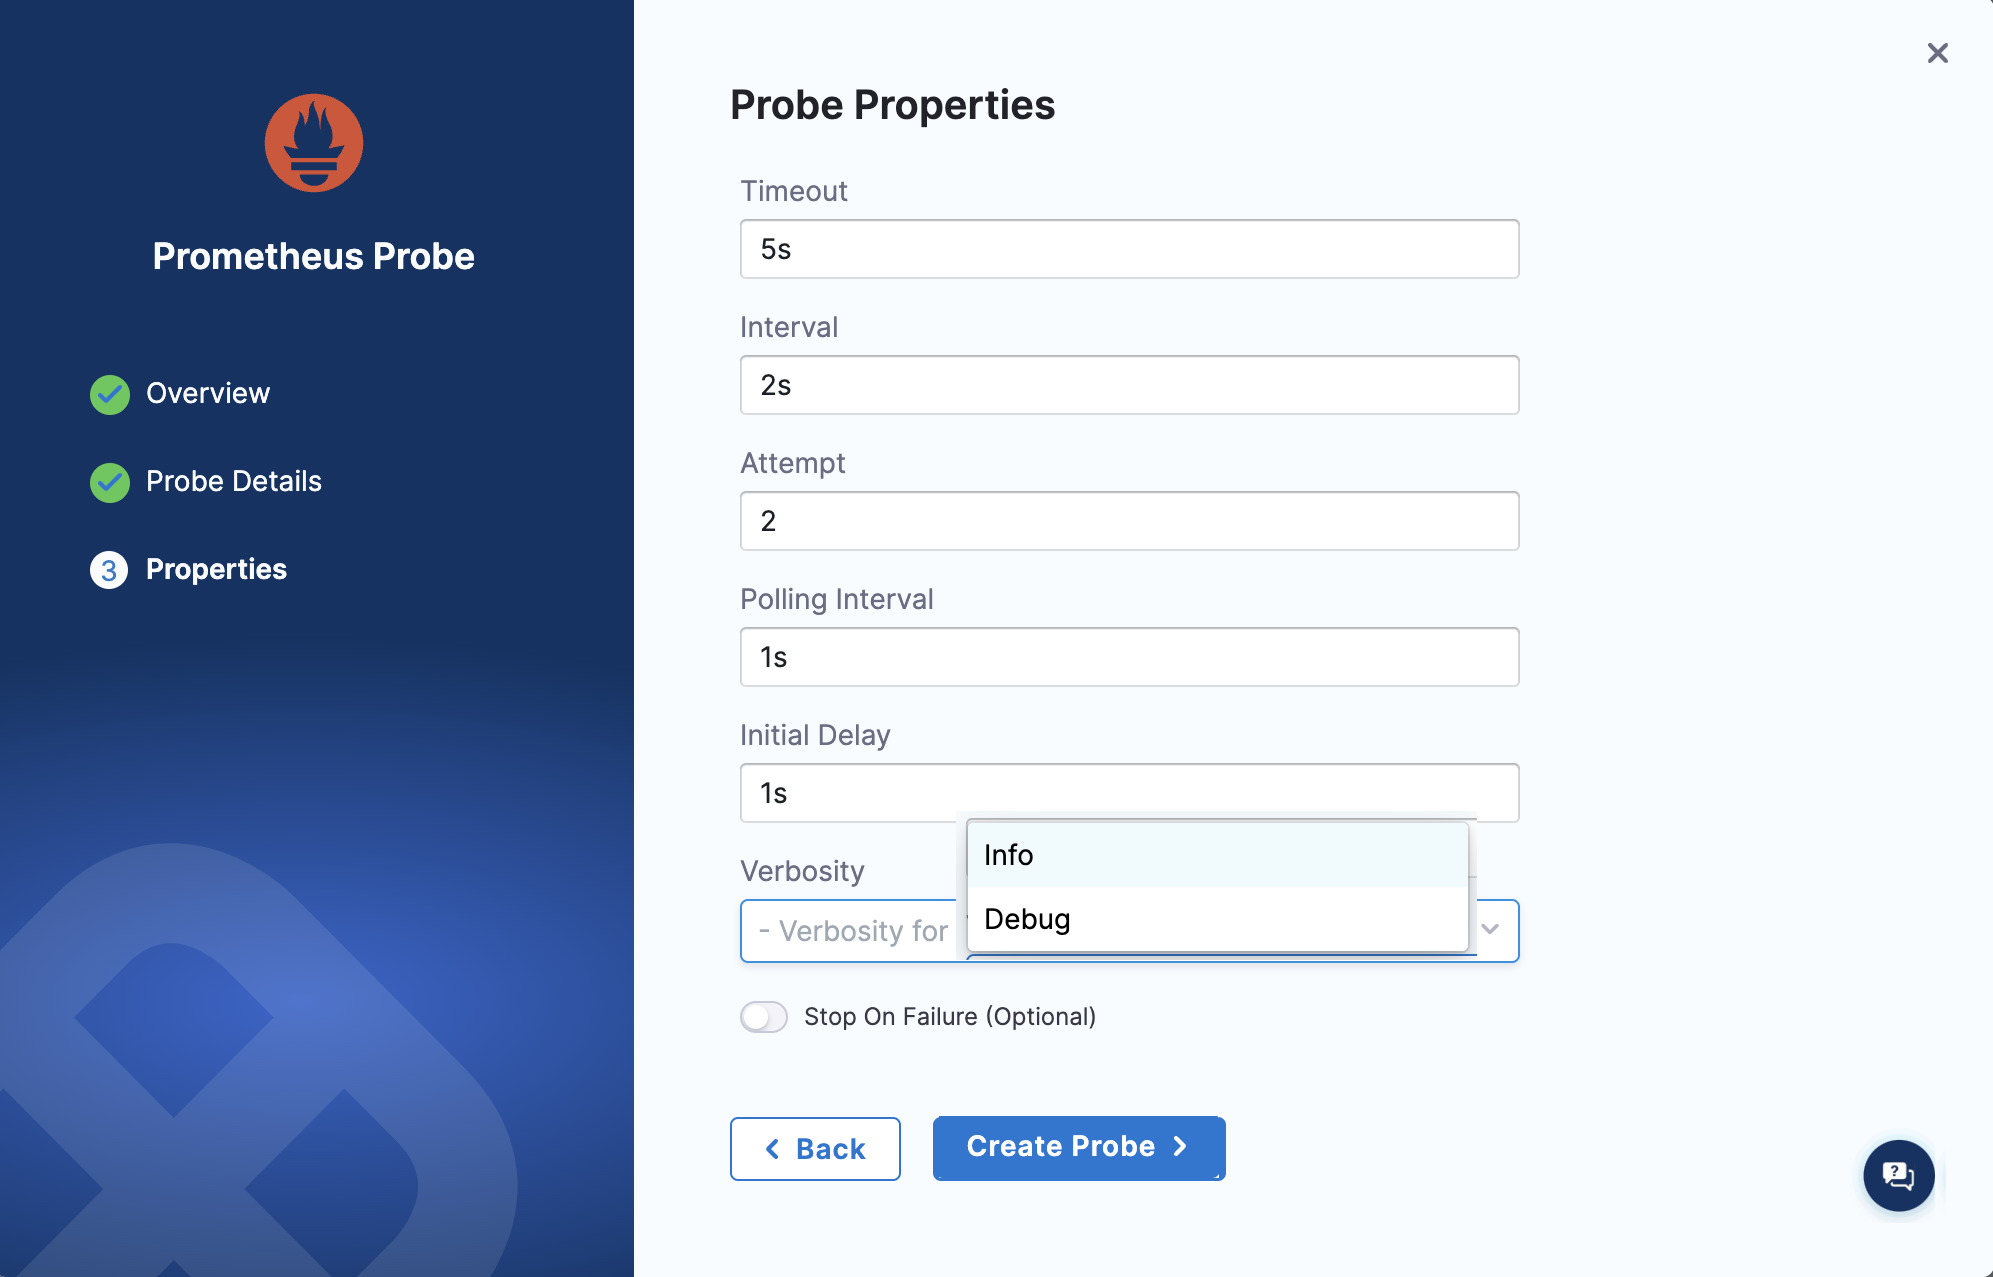
Specify general probe properties such as timeout, interval, and so on. Click Create Probe.
- Timeout: Time limit for the probe to execute the check and return the expected output.
- Interval: Duration for which the probe waits between subsequent attempts.
- Attempt: Number of times a check is executed upon failure in the previous attempts before declaring the probe status as
FAILED. - Polling Interval: Time interval for which
continuousandonchaosprobe modes should wait after each iteration. - Intitial Delay: Duration to wait before the probe begins execution.
- Verbosity: Level of detail to include in the logs generated during the execution of the probe. Choose between
info(essential logs, probe status are printed) anddebug(in-depth logs, timestamps, and execution logs are printed) mode. - Stop on Failure (Optional): Enable it to continue or disable it to stop the experiment execution after the probe fails. Disabled by default.
Go to Run Properties for more information.