Set Up AI Cost Traces
After you understand how AI traces work, instrument your application to send OpenTelemetry traces with GenAI semantic conventions to Cloud & AI Cost Management (CACM). This page walks you through every setup path, from generating an ingestion token to verifying traces in Cost Explorer.
This depends on OpenTelemetry traces with GenAI semantic conventions, not just standard OpenTelemetry traces. Standard HTTP, database, or function spans do not carry the model name or token counts CACM needs to calculate cost. Go to the GenAI Span Attribute Reference to review the attributes CACM reads.
Before You Begin
- AI Cost Management enabled: Confirm that AI Cloud Providers appears under Cloud & AI Cost Management > Account Settings. Go to AI Cost Troubleshooting if it does not.
- Permission to create a service account: Route Existing Traces generates the ingestion token as its first step. Go to RBAC in Harness to confirm your role.
- A provider connector (recommended): Needed for invoice-accurate costs. Go to AI Cost Management Quickstart to connect one.
- A runtime: Python 3.8+ for the Harness SDK, or
curlfor a test trace. - Network egress: From your app or shell to the Harness OTLP endpoint (
https://app.harness.io/udp-ingest/otel/v1/traces, or your cluster's equivalent).
Choose Your Path
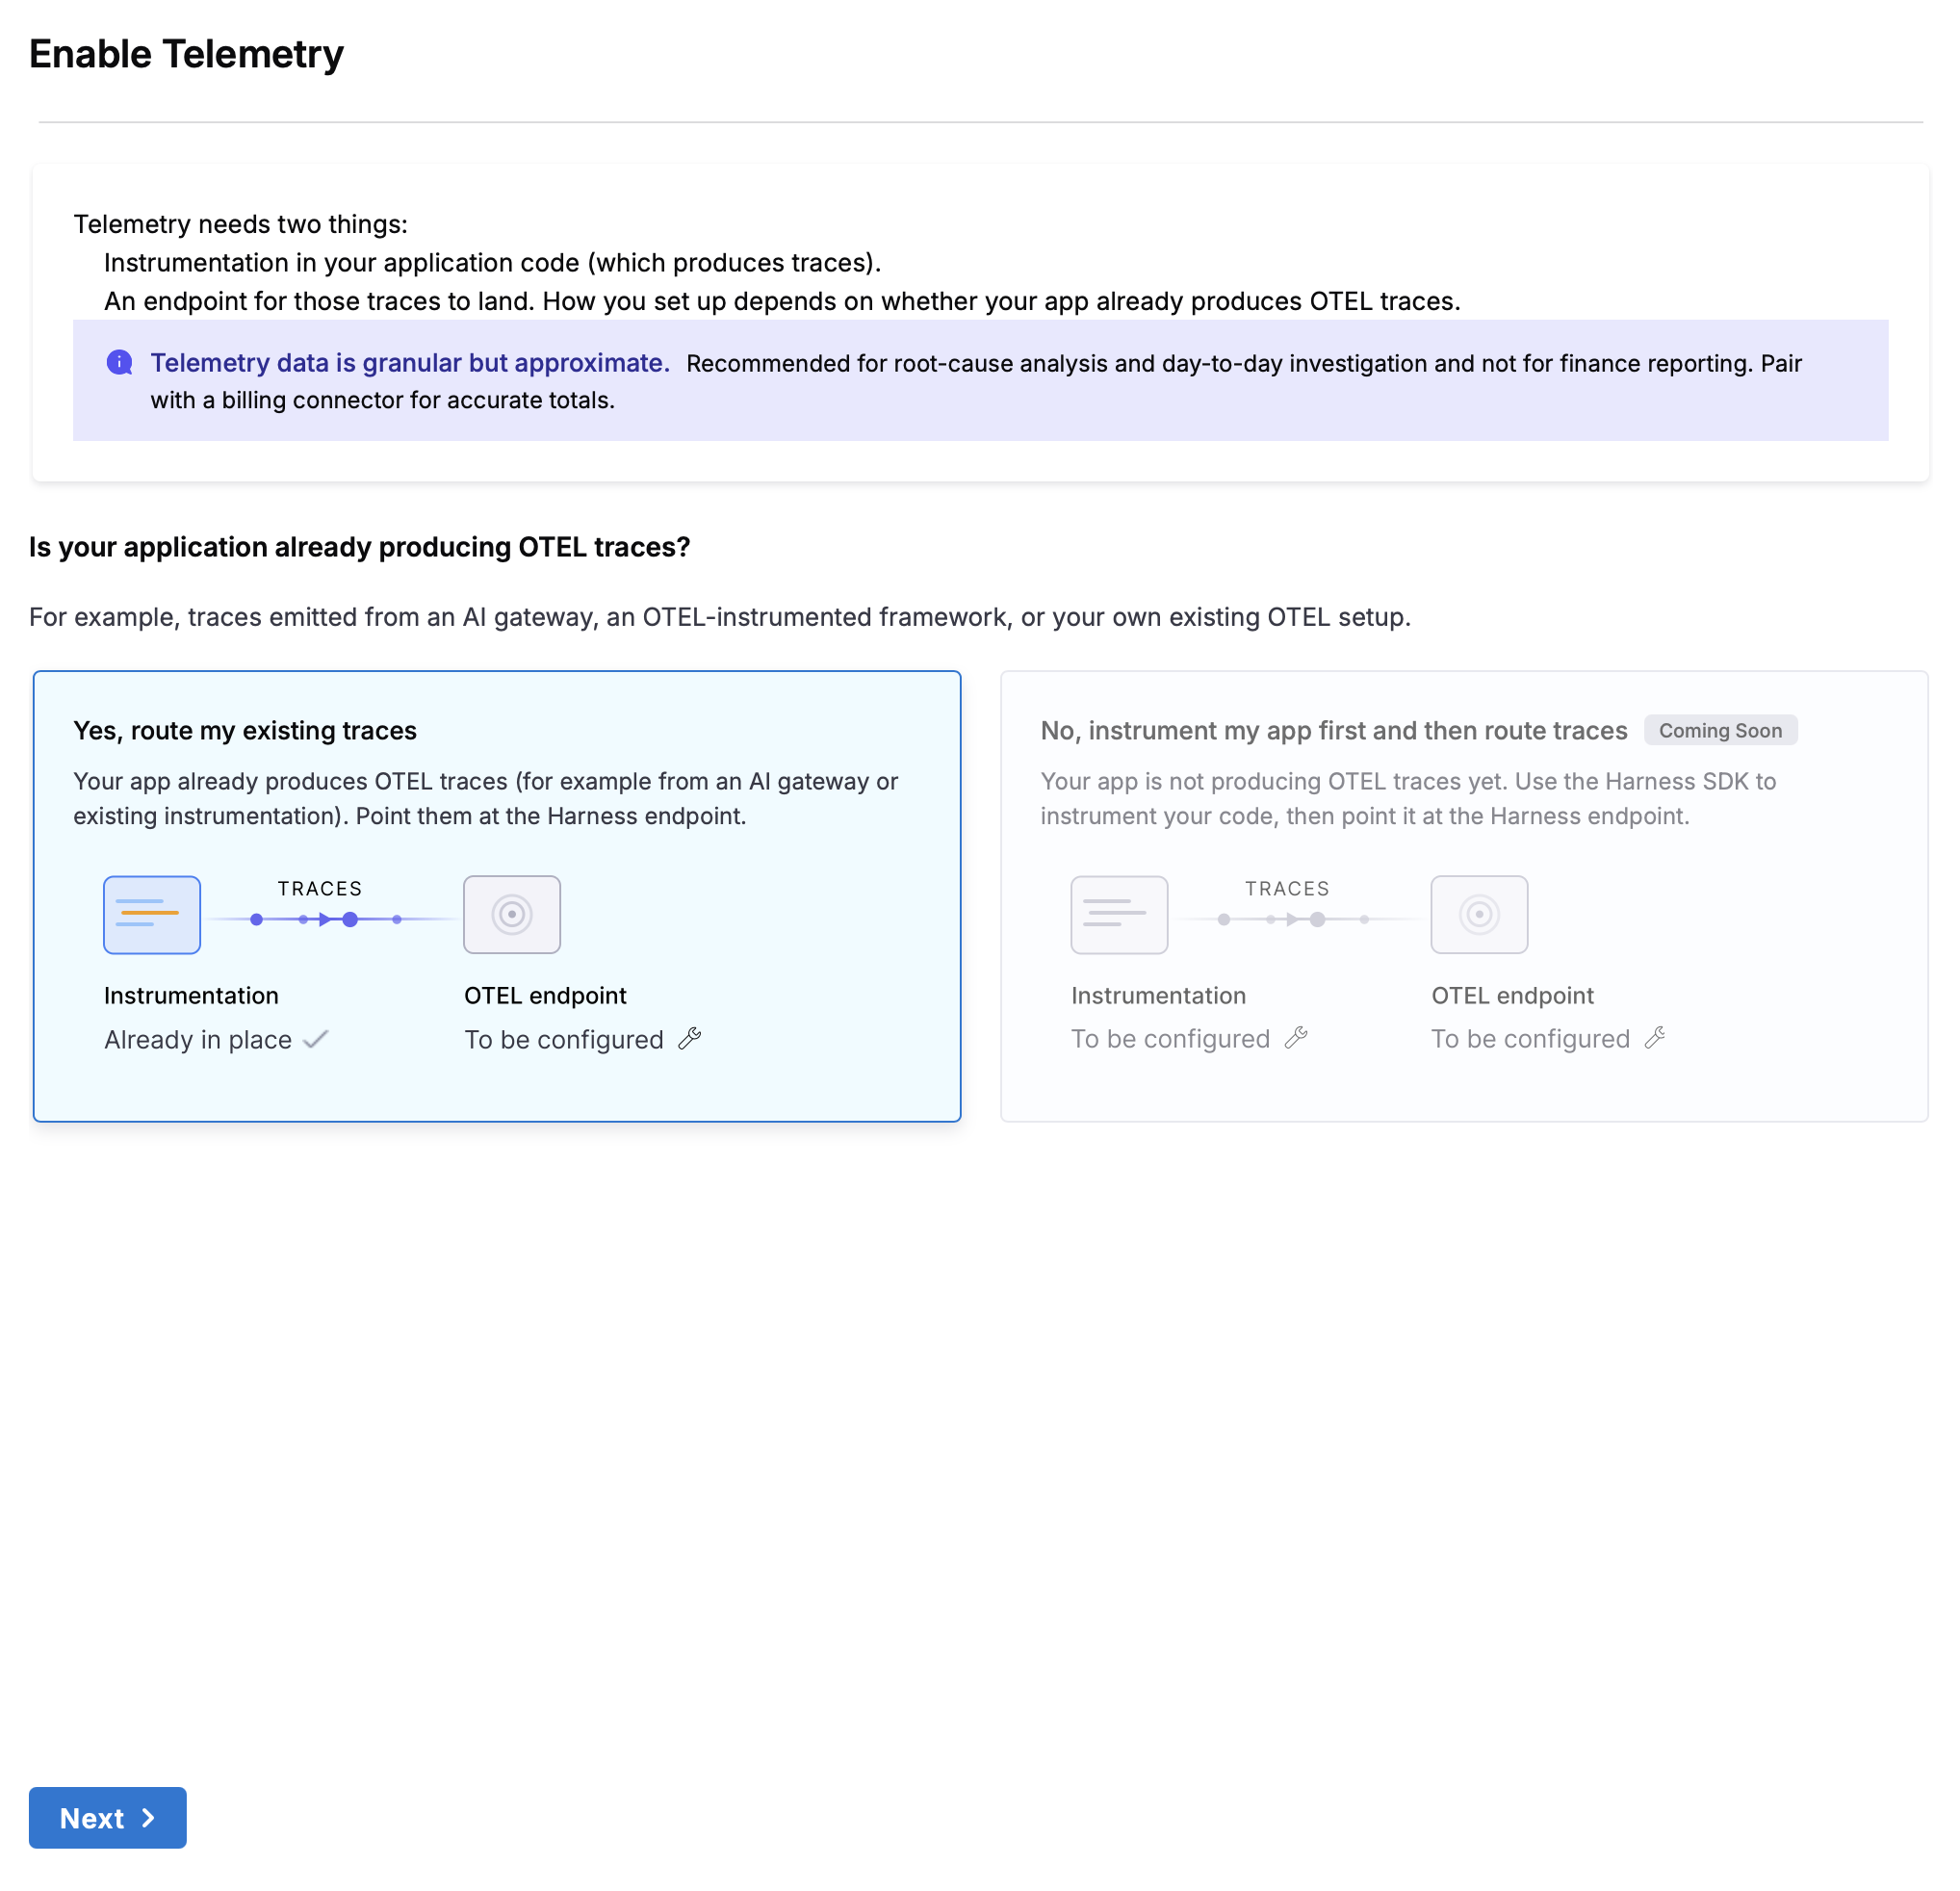
Your setup path depends on one question: Does your app or gateway already emit GenAI OpenTelemetry traces?
- Yes, my stack already emits GenAI traces: Route those traces to Harness with no code changes. Use Route Existing Traces.
- No, I need to instrument my application: Add instrumentation that emits GenAI traces, then route them to Harness. Use the Harness SDK if you call a model SDK directly in Python, or an open-source SDK if an orchestration framework runs your calls.
Not sure whether your stack emits GenAI traces? Go to Supported Providers and Frameworks to check the compatibility matrix.
| Path | Use when | What you do |
|---|---|---|
| Route Existing Traces | Your app or gateway already emits GenAI OpenTelemetry traces (LangSmith, OpenInference, a LiteLLM proxy, or native framework export). | Generate a token and point the existing exporter at the Harness endpoint. No code changes. |
| Instrument Your Application | Your app does not emit GenAI traces yet. | Add the Harness SDK (direct Python SDK calls) or an open-source SDK (orchestration frameworks), then route the traces to Harness. |
Instrument Your Application
Select the tab that matches your stack. Each tab is a complete, self-contained setup, from the ingestion token to verification in Cost Explorer.
- Route Existing Traces
- Harness SDK (Python)
- Framework Instrumentation
Route Existing Traces
Use this path if your app or gateway already emits OpenTelemetry traces with GenAI semantic conventions (from LangSmith, OpenInference, a LiteLLM Proxy, LangChain, or a framework with native export). No code changes: you repoint the existing exporter at Harness.
Step 1: Generate an Authentication Token
Harness uses a bearer token to authenticate trace ingestion against the account's OTLP endpoint.
Recommended: Create a dedicated service account for telemetry ingestion and generate an API key under that account. This isolates the credential, makes it easy to rotate, and keeps trace ingestion working independently of any individual user.
- Create a service account (example:
ai-telemetry-ingest) and assign it a role with the minimum permissions required for ingestion. - Create a service account API key and token.
- Select Generate Token and copy the token.
- The token is only displayed once. Store it securely (secret manager, environment variable, or vault).
- Treat it like a password. Never commit it to source control.
- Rotate it periodically (every 90 days recommended).
Step 2: Configure the OTLP Exporter
Point the existing OTLP exporter at the Harness endpoint by setting these OpenTelemetry environment variables:
export OTEL_EXPORTER_OTLP_ENDPOINT=https://app.harness.io/udp-ingest/otel
export OTEL_EXPORTER_OTLP_HEADERS="Authorization=Bearer <YOUR_TOKEN>"
export OTEL_TRACES_EXPORTER=otlp
export OTEL_EXPORTER_OTLP_PROTOCOL=http/protobuf
What each variable does
| Variable | Purpose |
|---|---|
OTEL_EXPORTER_OTLP_ENDPOINT | Harness OTLP trace ingestion endpoint. Replace app.harness.io with the account's cluster if different (example: app3.harness.io). Find the cluster in the URL when logged in to Harness. |
OTEL_EXPORTER_OTLP_HEADERS | Bearer token for authentication. Use the literal token value or reference it from a secret/environment variable. |
OTEL_TRACES_EXPORTER | Selects the OTLP exporter for traces. |
OTEL_EXPORTER_OTLP_PROTOCOL | Selects HTTP/protobuf OTLP transport (Harness expects this format). |
Framework-specific configuration
The four variables above are the standard OpenTelemetry exporter settings and work for most stacks. Some frameworks and tools also require a framework-specific flag to turn telemetry on. Pick your framework below.
- Standard OTel SDK
- Anthropic Agent SDK (Claude Code)
- LangChain / LangSmith
- LiteLLM Proxy
No extra flag is needed. The standard variables are enough:
export OTEL_EXPORTER_OTLP_ENDPOINT=https://app.harness.io/udp-ingest/otel
export OTEL_EXPORTER_OTLP_HEADERS="Authorization=Bearer ${HARNESS_OTEL_TOKEN}"
export OTEL_TRACES_EXPORTER=otlp
export OTEL_EXPORTER_OTLP_PROTOCOL=http/protobuf
Claude Code additionally requires CLAUDE_CODE_ENABLE_TELEMETRY=1:
export CLAUDE_CODE_ENABLE_TELEMETRY=1
export OTEL_EXPORTER_OTLP_ENDPOINT=https://app.harness.io/udp-ingest/otel
export OTEL_EXPORTER_OTLP_HEADERS="Authorization=Bearer ${HARNESS_OTEL_TOKEN}"
export OTEL_TRACES_EXPORTER=otlp
export OTEL_EXPORTER_OTLP_PROTOCOL=http/protobuf
LangChain emits OTel when LangSmith's OTel export is enabled with LANGSMITH_OTEL_ENABLED=true:
export LANGSMITH_OTEL_ENABLED=true
export OTEL_EXPORTER_OTLP_ENDPOINT=https://app.harness.io/udp-ingest/otel
export OTEL_EXPORTER_OTLP_HEADERS="Authorization=Bearer ${HARNESS_OTEL_TOKEN}"
export OTEL_TRACES_EXPORTER=otlp
export OTEL_EXPORTER_OTLP_PROTOCOL=http/protobuf
Enable the otel callback in your LiteLLM proxy config, then set the standard exporter variables:
# config.yaml
litellm_settings:
  callbacks: ["otel"]
export OTEL_EXPORTER_OTLP_ENDPOINT=https://app.harness.io/udp-ingest/otel
export OTEL_EXPORTER_OTLP_HEADERS="Authorization=Bearer ${HARNESS_OTEL_TOKEN}"
export OTEL_TRACES_EXPORTER=otlp
export OTEL_EXPORTER_OTLP_PROTOCOL=http/protobuf
After setting the variables, restart the application or gateway so they take effect.
Step 3: Verify Traces in Cost Explorer
- Wait for traces to flow. They usually appear within a few minutes; allow up to about 20 minutes.
- Go to Cloud & AI Cost Management > Cost Explorer.
- Select the AI Traces view or group by Service Name.
- Look for the service name (from the
service.nameattribute in traces). - Select a service row to open the Service Traces drawer.
- Inspect recent runs, span waterfalls, and per-span cost attribution.
Step 4: (Optional) Send a Test Trace
Before wiring up the full application, confirm the endpoint and token work by sending a single test span with curl.
Replace <ACCOUNT_ID> with the account identifier and <YOUR_TOKEN> with the token from Step 1, then run:
curl --request POST \
  --url 'https://app.harness.io/udp-ingest/otel/v1/traces?accountIdentifier=<ACCOUNT_ID>&routingId=<ACCOUNT_ID>' \
  --header 'content-type: application/json' \
  --header 'Authorization: Bearer <YOUR_TOKEN>' \
  --data '{
  "resourceSpans": [
    {
      "resource": {
        "attributes": [
          { "key": "harness.account.id", "value": { "stringValue": "<ACCOUNT_ID>" } },
          { "key": "service.name", "value": { "stringValue": "test-service" } }
        ]
      },
      "scopeSpans": [
        {
          "scope": { "name": "otlp-test-client" },
          "spans": [
            {
              "traceId": "aabbccdd11223344aabbccdd11223344",
              "spanId": "0000000000000001",
              "name": "test-span",
              "startTimeUnixNano": "1786104000000000000",
              "endTimeUnixNano": "1786104000500000000"
            }
          ]
        }
      ]
    }
  ]
}'
Note: startTimeUnixNano and endTimeUnixNano are example nanosecond timestamps (they resolve to a 2026 date). If the test span does not appear, regenerate current values. For example, run date +%s and append nine zeros for nanoseconds.
Then open the AI Traces view in Cost Explorer and look for test-service. It usually appears within a few minutes; allow up to about 20 minutes.
Harness SDK (Python)
Use this path if your app calls the model provider SDK directly, with no orchestration framework, and does not yet emit GenAI OTel traces. You add the OTel SDK and GenAI instrumentation to the provider SDK calls.
Instrumentation Overview
OpenTelemetry GenAI instrumentation has three parts:
- OTel SDK: Initialized inside the application process. Manages trace context, span creation, and export.
- GenAI instrumentation libraries: Auto-instrument LLM SDKs (OpenAI, Anthropic, Bedrock via LiteLLM) and AI frameworks (LangChain, LlamaIndex) to emit spans with GenAI semantic conventions. This is the critical part that standard OTel instrumentation does not provide.
- OTLP exporter: Ships spans to the Harness OTLP endpoint over HTTPS with bearer token authentication.
How GenAI instrumentation differs from standard OTel
- Standard OTel: Instruments HTTP requests, database queries, and function calls. Captures latency, errors, and status codes.
- GenAI OTel: Instruments LLM calls specifically. Captures model name, token counts, prompt/response (optional), and cost calculation inputs.
- Key attributes only in GenAI instrumentation:
gen_ai.system,gen_ai.request.model,gen_ai.usage.input_tokens,gen_ai.usage.output_tokens.
You need both for full observability: Standard OTel shows how the application works, GenAI OTel shows what the LLM costs.
Choose an Instrumentation Approach
Three options depending on the stack:
| Approach | Best for |
|---|---|
| Harness SDK (Python) | Python apps using LiteLLM, Anthropic SDK, OpenAI SDK, FastAPI, Flask, Django. |
| Framework Instrumentation | LangChain, LlamaIndex, OpenAI Agents SDK, Google ADK. Go to the Framework Instrumentation tab. |
| Manual instrumentation | Custom agents, non-standard frameworks, polyglot apps. Go to Manual Instrumentation. |
The rest of this tab covers the Harness SDK.
Installation
Install the SDK with the extra for the LLM client.
# For LiteLLM
pip install "harness-sdk[litellm]==1.0.1"

# For Anthropic Python client
pip install "harness-sdk[anthropic]==1.0.1"

# For OpenAI SDK
pip install "harness-sdk[openai]==1.0.1"
Note for the Anthropic extra: The Anthropic extra requires additional packages. Install them separately if not already present:
pip install opentelemetry-instrumentation-anthropic opentelemetry-util-genai
Configuration
Set these environment variables to point the SDK at the Harness endpoint:
export HA_SERVICE_NAME="my-ai-service"
export HA_REPORTING_ENDPOINT="https://app.harness.io/udp-ingest/otel/v1/traces?accountIdentifier=<ACCOUNT_ID>&routingId=<ACCOUNT_ID>"
export HA_REPORTING_TRACE_REPORTER_TYPE=OTLP_HTTP
export HA_REPORTING_TOKEN="<YOUR_TOKEN>"
What each variable does, and where to get the values
| Variable | Purpose |
|---|---|
HA_SERVICE_NAME | Service name that appears in Cost Explorer (example: customer-support-bot, research-agent). |
HA_REPORTING_ENDPOINT | Harness UDP ingest endpoint with account ID. Replace <ACCOUNT_ID> with the actual account identifier (find it in the Harness URL when logged in). |
HA_REPORTING_TOKEN | Service account token generated in the Route Existing Traces tab, Step 1. |
Where to get these values:
<ACCOUNT_ID>: In the Harness URL when logged in (example:app.harness.io/ng/account/abc123/...→ account ID isabc123).<YOUR_TOKEN>: Generated in the Route Existing Traces tab, Step 1.
Instrumentation Code
Add these two lines at the start of the application, before importing AI libraries:
from harness_sdk.agent import Agent
Agent().instrument()
Call Agent().instrument() before importing LLM SDKs (LiteLLM, OpenAI, Anthropic) or web frameworks (FastAPI, Flask). The SDK patches these libraries at import time via monkey-patching. If libraries are imported first, they will not be instrumented.
Python's import system executes module code once. If import openai runs before Agent().instrument(), the SDK cannot patch the OpenAI client and spans will not be emitted.
Complete examples
- LiteLLM
- Anthropic Python client
- OpenAI SDK
Use case: Application uses LiteLLM to call multiple LLM providers (OpenAI, Anthropic, Bedrock, etc.).
from harness_sdk.agent import Agent
Agent().instrument()  # Must be called before importing AI libraries

import litellm

# Every litellm.completion() call now emits a span with gen_ai.* attributes
resp = litellm.completion(
    model="anthropic/claude-3-5-sonnet-20241022",
    messages=[{"role": "user", "content": "Reply with one short sentence."}],
    max_tokens=64,
)
print(resp.choices[0].message.content)
What this produces:
- One span per
litellm.completion()call. - Span attributes:
gen_ai.system=anthropic,gen_ai.request.model=claude-3-5-sonnet-20241022,gen_ai.usage.input_tokens,gen_ai.usage.output_tokens. - Cost calculated from token counts and Anthropic pricing.
Use case: Application uses the Anthropic Python client directly (not LiteLLM).
from harness_sdk.agent import Agent
Agent().instrument()  # Must be called before importing AI libraries

import anthropic

client = anthropic.Anthropic()  # reads ANTHROPIC_API_KEY from env
msg = client.messages.create(
    model="claude-3-5-sonnet-20241022",
    max_tokens=64,
    messages=[{"role": "user", "content": "Reply with one short sentence."}],
)
print(msg.content[0].text)
What this produces:
- One span per
client.messages.create()call. - Span attributes:
gen_ai.system=anthropic,gen_ai.request.model=claude-3-5-sonnet-20241022, token usage. - Cost calculated from token counts and Anthropic pricing.
Use case: Application uses the OpenAI SDK directly.
from harness_sdk.agent import Agent
Agent().instrument()  # Must be called before importing AI libraries

import openai

client = openai.OpenAI()  # reads OPENAI_API_KEY from env
resp = client.chat.completions.create(
    model="gpt-4-turbo",
    messages=[{"role": "user", "content": "Reply with one short sentence."}],
    max_tokens=64,
)
print(resp.choices[0].message.content)
What this produces:
- One span per
client.chat.completions.create()call. - Span attributes:
gen_ai.system=openai,gen_ai.request.model=gpt-4-turbo, token usage. - Cost calculated from token counts and OpenAI pricing.
Verify Traces in Cost Explorer
- Run the application with instrumentation enabled.
- Trigger an LLM call (via API request, CLI, or test script).
- Wait for traces to appear. They usually land within a few minutes; allow up to about 20 minutes.
- Go to Cloud & AI Cost Management > Cost Explorer.
- Select the AI Traces view or group by Service Name.
- Look for the service name (from the
HA_SERVICE_NAMEenvironment variable). - Select a service row to open the Service Traces drawer.
- Inspect spans, token counts, and per-span cost.
Framework Instrumentation
Use this path if an orchestration framework (LangChain, LlamaIndex, OpenAI Agents SDK, Google ADK) runs your calls and has built-in OpenTelemetry support or official instrumentation libraries. This captures the full workflow: tool calls, retries, and loops.
The Harness SDK also works if your framework routes through LiteLLM, but it captures only the LLM call, not the surrounding workflow.
Shared OpenTelemetry Setup
Every framework tab below uses the same OpenTelemetry exporter setup. Run it once at application startup, then add the framework-specific instrumentor from the matching tab. Replace <YOUR_TOKEN> with your service account token (generated in the Route Existing Traces tab, Step 1) and adjust the endpoint for your Harness cluster.
from opentelemetry import trace
from opentelemetry.sdk.trace import TracerProvider
from opentelemetry.sdk.trace.export import BatchSpanProcessor
from opentelemetry.exporter.otlp.proto.http.trace_exporter import OTLPSpanExporter

provider = TracerProvider()
provider.add_span_processor(
    BatchSpanProcessor(
        OTLPSpanExporter(
            endpoint="https://app.harness.io/udp-ingest/otel/v1/traces",
            headers={"Authorization": "Bearer <YOUR_TOKEN>"},
        )
    )
)

# Register `provider` as the global tracer provider so instrumentors and
# `trace.get_tracer(...)` calls below pick it up.
trace.set_tracer_provider(provider)
- LangChain / LangGraph
- LlamaIndex
- Google ADK
- OpenAI Agents SDK
- LiteLLM Proxy
- Claude Code
Best for: LangChain or LangGraph applications without LiteLLM.
LangChain and LangGraph can export traces through LangSmith's OpenTelemetry support or the OpenInference LangChain instrumentation.
Option 1: LangSmith OTel (official)
Set these environment variables:
export LANGSMITH_OTEL_ENABLED=true
export LANGSMITH_TRACING=true
export OTEL_EXPORTER_OTLP_ENDPOINT=https://app.harness.io/udp-ingest/otel
export OTEL_EXPORTER_OTLP_HEADERS="Authorization=Bearer <YOUR_TOKEN>"
Note: LangSmith appends /v1/traces to the endpoint, so use the base path (/udp-ingest/otel) here.
Option 2: OpenInference LangChain instrumentation (community)
Install the instrumentation library:
pip install openinference-instrumentation-langchain \
  opentelemetry-sdk opentelemetry-exporter-otlp
Complete the shared OpenTelemetry setup once, then add the framework instrumentor:
from openinference.instrumentation.langchain import LangChainInstrumentor

# `provider` comes from the shared setup above
LangChainInstrumentor().instrument(tracer_provider=provider)
What this produces:
- One trace per LangChain invocation (chain, agent, tool).
- Nested spans for each step (LLM call, tool use, retrieval).
- GenAI semantic conventions on LLM spans.
- Cost calculated from token counts.
Best for: LlamaIndex applications.
LlamaIndex has built-in OpenTelemetry support. Use the OpenInference LlamaIndex instrumentation to export traces to Harness.
Install the instrumentation library:
pip install openinference-instrumentation-llama-index \
  opentelemetry-sdk opentelemetry-exporter-otlp
Complete the shared OpenTelemetry setup once, then add the framework instrumentor:
from openinference.instrumentation.llama_index import LlamaIndexInstrumentor

# `provider` comes from the shared setup above
LlamaIndexInstrumentor().instrument(tracer_provider=provider)
What this produces:
- One trace per LlamaIndex query or agent invocation.
- Nested spans for retrieval, LLM calls, and post-processing.
- GenAI semantic conventions on LLM spans.
- Cost calculated from token counts.
Best for: Google Agent Development Kit (ADK) applications.
Google's Agent Development Kit (ADK) is instrumented with OpenTelemetry. Use the OpenInference ADK instrumentation to route traces to Harness.
Install the instrumentation library:
pip install openinference-instrumentation-google-adk \
  opentelemetry-sdk opentelemetry-exporter-otlp
Complete the shared OpenTelemetry setup once, then add the framework instrumentor:
from openinference.instrumentation.google_adk import GoogleADKInstrumentor

# `provider` comes from the shared setup above
GoogleADKInstrumentor().instrument(tracer_provider=provider)
What this produces:
- One trace per ADK agent invocation.
- Nested spans for tools, LLM calls, and agent steps.
- GenAI semantic conventions on LLM spans.
- Cost calculated from token counts.
Go to the ADK observability docs to review the built-in tracing model.
Best for: OpenAI Agents SDK applications.
The OpenAI Agents SDK has built-in tracing. Use the OpenInference OpenAI Agents instrumentation to export traces to Harness.
Install the instrumentation library:
pip install openinference-instrumentation-openai-agents \
  opentelemetry-sdk opentelemetry-exporter-otlp
Complete the shared OpenTelemetry setup once, then add the framework instrumentor:
from openinference.instrumentation.openai_agents import OpenAIAgentsInstrumentor

# `provider` comes from the shared setup above
OpenAIAgentsInstrumentor().instrument(tracer_provider=provider)
What this produces:
- One trace per agent run.
- Nested spans for function calls, tool uses, and LLM interactions.
- GenAI semantic conventions on LLM spans.
- Cost calculated from token counts.
Go to the OpenAI Agents SDK tracing docs to configure custom processors.
Best for: Teams routing all LLM traffic through a LiteLLM proxy.
LiteLLM proxy can emit OTel traces for every LLM call via its otel callback.
Enable the callback in config.yaml:
litellm_settings:
  callbacks: ["otel"]
Set these environment variables on the proxy:
export OTEL_EXPORTER="otlp_http"
export OTEL_ENDPOINT="https://app.harness.io/udp-ingest/otel/v1/traces"
export OTEL_HEADERS="Authorization=Bearer <YOUR_TOKEN>"
OTEL_EXPORTER, OTEL_ENDPOINT, and OTEL_HEADERS are LiteLLM-proxy-specific variable names, not the standard OpenTelemetry SDK variables (OTEL_EXPORTER_OTLP_ENDPOINT, OTEL_EXPORTER_OTLP_HEADERS, and so on) used elsewhere on this page. Use these exact names only for the LiteLLM proxy; the standard names still apply everywhere else.
Restart the LiteLLM proxy. All requests routed through the proxy now emit traces to Harness.
What this produces:
- One span per LLM call routed through the proxy.
- Span attributes:
gen_ai.system,gen_ai.request.model, token usage. - Cost calculated from token counts and model pricing.
Note: This instruments the proxy, not the application code. If the application makes direct LLM calls (bypassing the proxy), those calls will not appear in telemetry.LiteLLM Proxy vs LiteLLM SDK
import litellm). Instrument with the Harness SDK (go to the Harness SDK tab).
Best for: Teams using Claude Code to generate or debug AI applications.
Claude Code emits OpenTelemetry metrics and events, and trace export is available as a beta.
Set these environment variables (in shell profile, CI environment, or ~/.claude/settings.json):
export CLAUDE_CODE_ENABLE_TELEMETRY=1
export OTEL_TRACES_EXPORTER=otlp
export OTEL_EXPORTER_OTLP_PROTOCOL=http/protobuf
export OTEL_EXPORTER_OTLP_ENDPOINT=https://app.harness.io/udp-ingest/otel
export OTEL_EXPORTER_OTLP_HEADERS="Authorization=Bearer <YOUR_TOKEN>"
Note: Trace export from Claude Code is a beta capability. Go to the Claude Code monitoring docs to review the latest configuration and the list of emitted metrics, events, and traces.
Manual Instrumentation (Advanced)
Use manual instrumentation for languages the Harness SDK does not cover (Go, Java, .NET), custom agents, or when you need full control over span structure. You create spans with a standard OpenTelemetry SDK and set the required GenAI attributes yourself.
At minimum, each LLM span must set gen_ai.provider.name (preferred; the legacy gen_ai.system is also supported), gen_ai.request.model, gen_ai.usage.input_tokens, and gen_ai.usage.output_tokens, and export over OTLP to the Harness endpoint. Set gen_ai.agent.name if you want cost grouped by agent in Cost Explorer. Reuse the shared OpenTelemetry exporter setup from the Framework Instrumentation tab (which registers the global tracer provider that trace.get_tracer() reads from), then wrap each LLM call:
from opentelemetry import trace

tracer = trace.get_tracer(__name__)

with tracer.start_as_current_span("llm.call") as span:
    span.set_attribute("gen_ai.provider.name", "openai")  # preferred; "gen_ai.system" also supported
    span.set_attribute("gen_ai.agent.name", "support-copilot")  # optional: groups cost by agent in Cost Explorer
    span.set_attribute("gen_ai.request.model", "gpt-4-turbo")
    # ... make the LLM call ...
    span.set_attribute("gen_ai.usage.input_tokens", resp.usage.prompt_tokens)
    span.set_attribute("gen_ai.usage.output_tokens", resp.usage.completion_tokens)
For other languages, use the equivalent OpenTelemetry SDK (Go, Java, .NET) and set the same attributes. Go to the GenAI Span Attribute Reference to review the full list.
Reduce Trace Data Volume
Large prompt and response payloads and over-instrumentation inflate span volume and storage cost. To keep trace data manageable in high-traffic production:
- Disable payload capture: Set
HA_GEN_AI_PAYLOAD_CAPTURE_ENABLED=falsefor the Harness SDK so raw prompt and response text is not stored on spans. - Scope instrumentation to LLM calls: Instrument the model calls that carry cost, not every function in the application.
- Sample a percentage of traces: In high-traffic production, export a representative sample rather than every trace.
Next Steps
- Go to the GenAI Span Attribute Reference to review the exact attributes CACM reads from each span.
- Go to Supported Providers and Frameworks to check which SDKs and frameworks emit these attributes natively.
- Go to AI Cost Troubleshooting if traces do not appear or show no cost.
- Go to the AI Cost Management FAQ to review common questions.