path-a
Path A: Route Existing Traces to Harness
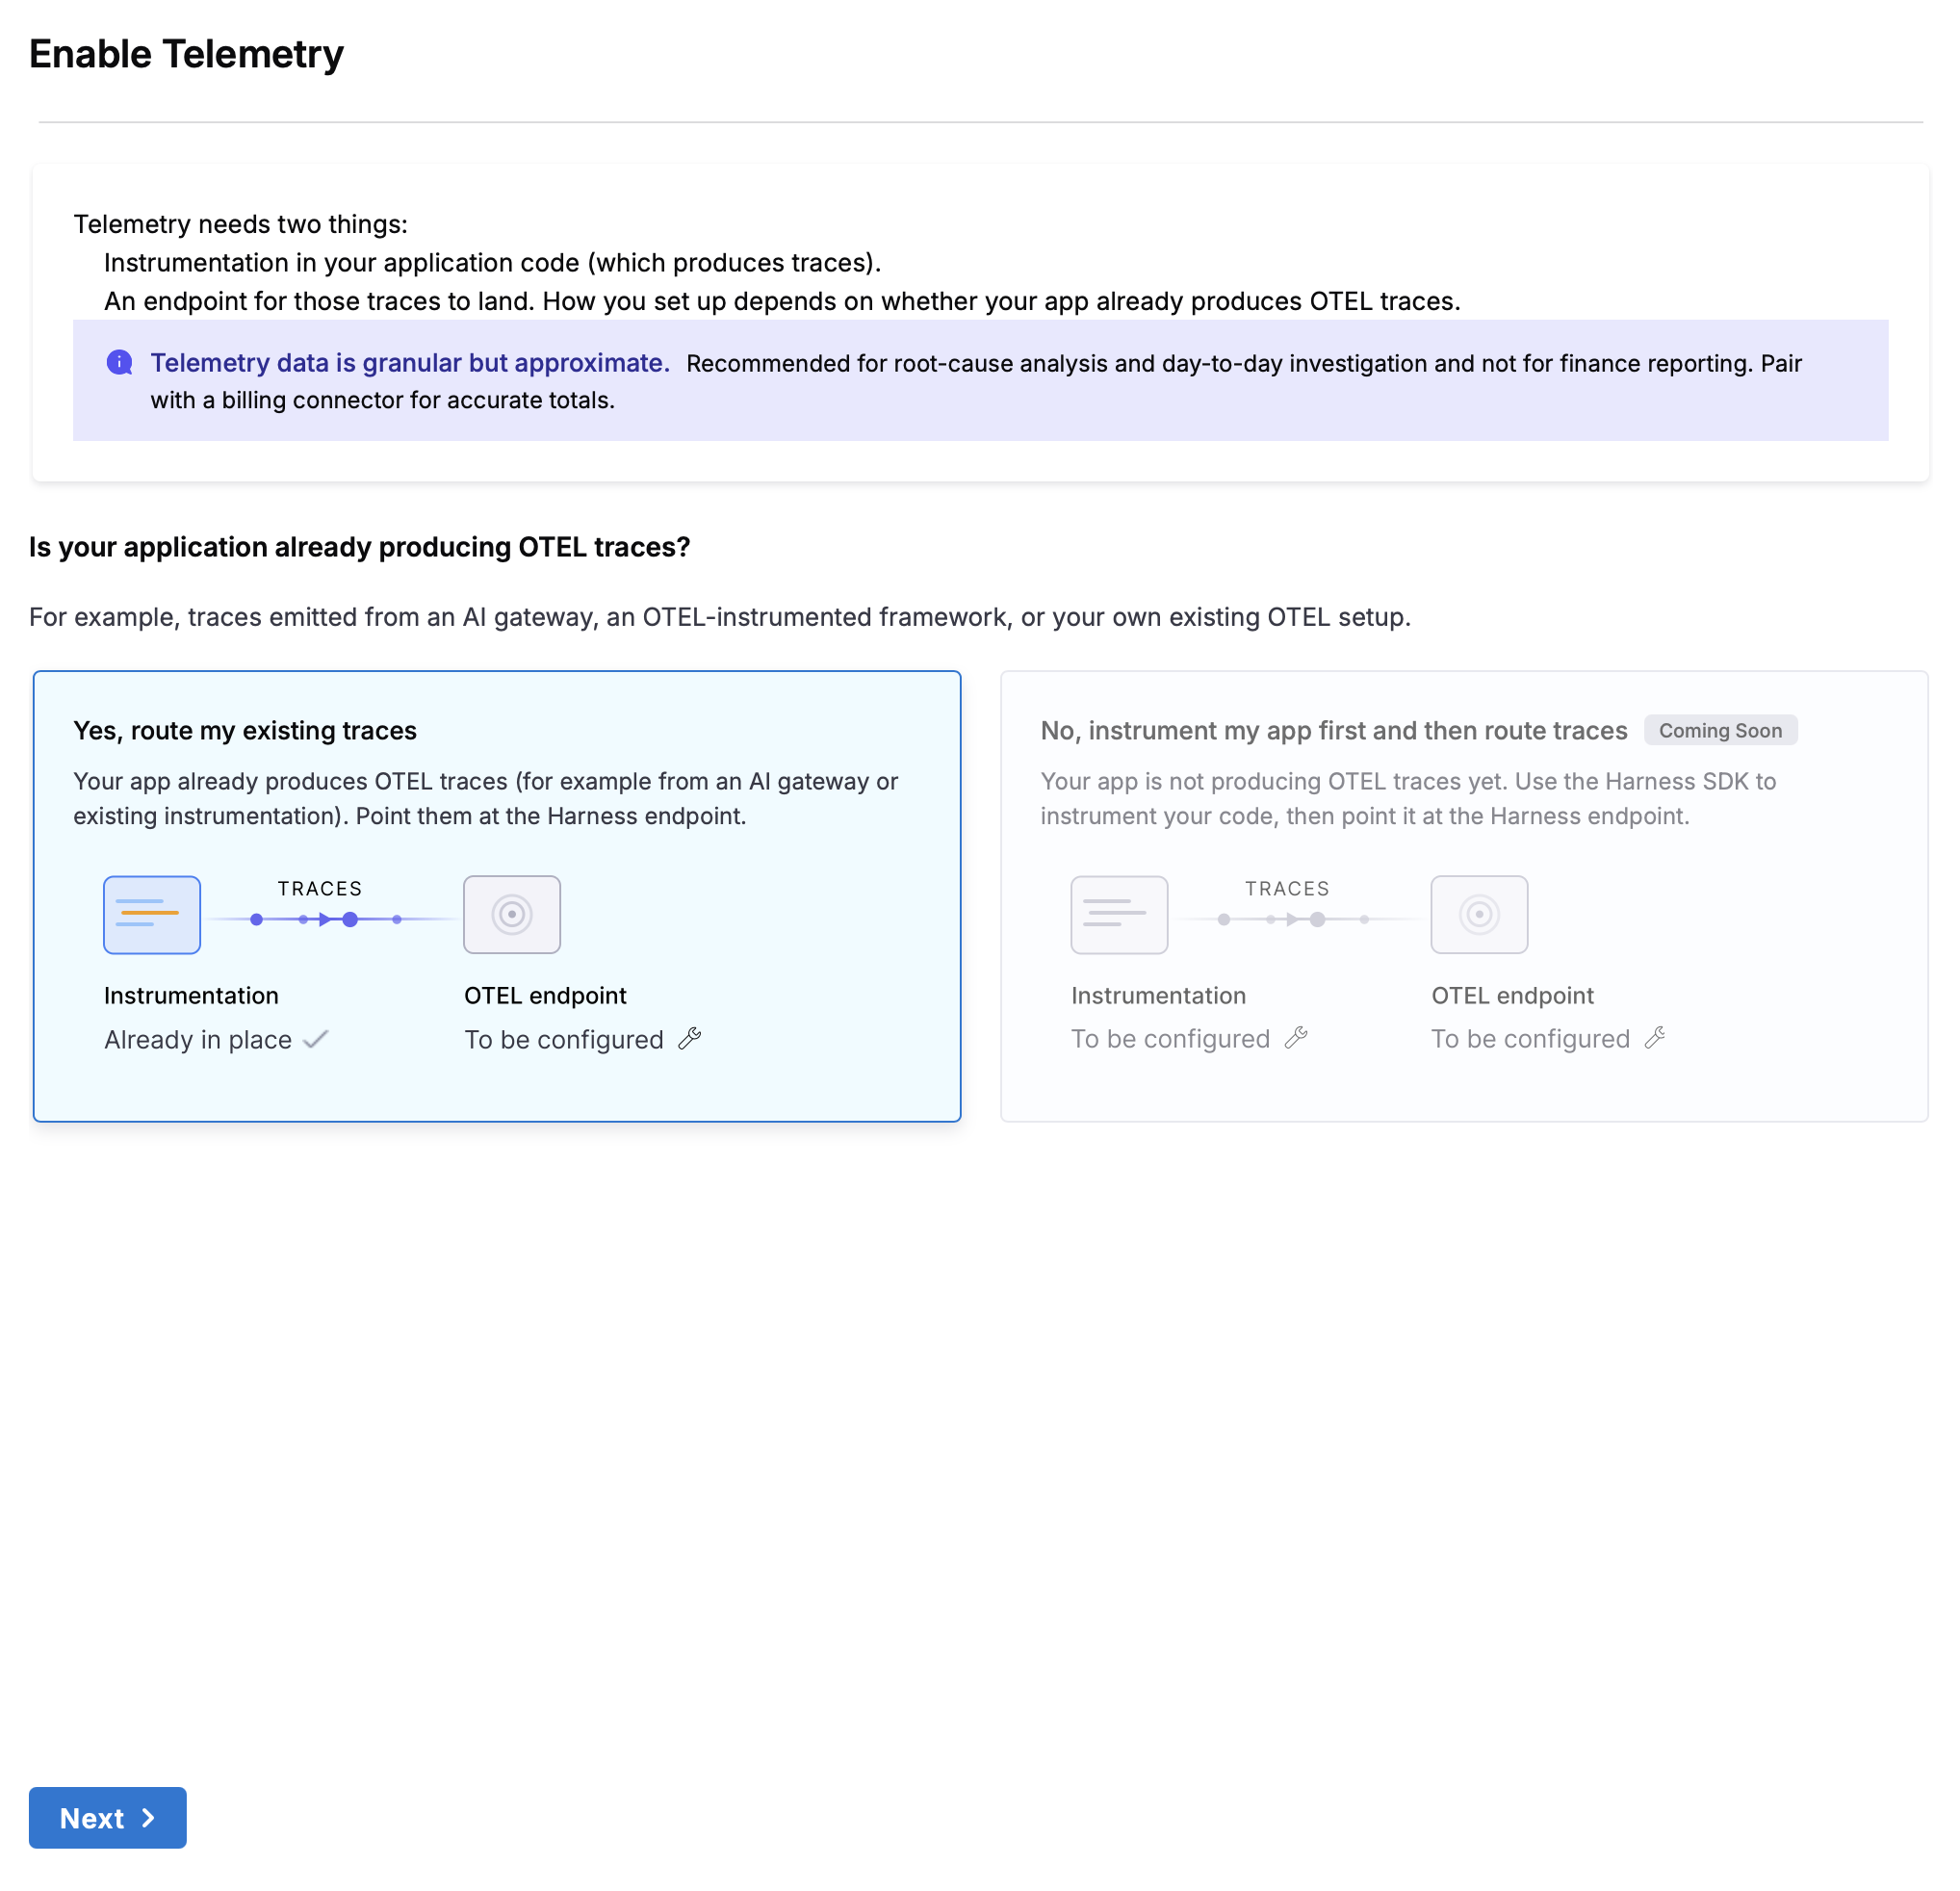
Use this path if your app or gateway already emits OpenTelemetry traces with GenAI semantic conventions (from LangSmith, OpenInference, a LiteLLM Proxy, LangChain, or a framework with native export). No code changes: you repoint the existing exporter at Harness.
Step 1: Generate an Authentication Token
Harness uses a bearer token to authenticate trace ingestion against the account's OTLP endpoint.
Recommended: Create a dedicated service account for telemetry ingestion and generate an API key under that account. This isolates the credential, makes it easy to rotate, and keeps trace ingestion working independently of any individual user.
- Create a service account (example:
ai-telemetry-ingest) and assign it a role with the minimum permissions required for ingestion. - Create a service account API key and token.
- Select Generate Token and copy the token.
- The token is only displayed once. Store it securely (secret manager, environment variable, or vault).
- Treat it like a password. Never commit it to source control.
- Rotate it periodically (every 90 days recommended).
Step 2: Configure the OTLP Exporter
Point the existing OTLP exporter at the Harness endpoint by setting these OpenTelemetry environment variables:
export OTEL_EXPORTER_OTLP_ENDPOINT=https://app.harness.io/udp-ingest/otel/v1/traces
export OTEL_EXPORTER_OTLP_HEADERS="Authorization=Bearer <YOUR_TOKEN>"
export OTEL_TRACES_EXPORTER=otlp
export OTEL_EXPORTER_OTLP_PROTOCOL=http/protobuf
What each variable does
| Variable | Purpose |
|---|---|
OTEL_EXPORTER_OTLP_ENDPOINT | Harness OTLP trace ingestion endpoint. Replace app.harness.io with the account's cluster if different (example: app3.harness.io). Find the cluster in the URL when logged in to Harness. |
OTEL_EXPORTER_OTLP_HEADERS | Bearer token for authentication. Use the literal token value or reference it from a secret/environment variable. |
OTEL_TRACES_EXPORTER | Selects the OTLP exporter for traces. |
OTEL_EXPORTER_OTLP_PROTOCOL | Selects HTTP/protobuf OTLP transport (Harness expects this format). |
Framework-specific configuration
The four variables above are the standard OpenTelemetry exporter settings and work for most stacks. Some frameworks and tools also require a framework-specific flag to turn telemetry on. Pick your framework below.
- Standard OTel SDK
- Anthropic Agent SDK (Claude Code)
- LangChain / LangSmith
- LiteLLM Proxy
No extra flag is needed — the standard variables are enough:
export OTEL_EXPORTER_OTLP_ENDPOINT=https://app.harness.io/udp-ingest/otel/v1/traces
export OTEL_EXPORTER_OTLP_HEADERS="Authorization=Bearer ${HARNESS_OTEL_TOKEN}"
export OTEL_TRACES_EXPORTER=otlp
export OTEL_EXPORTER_OTLP_PROTOCOL=http/protobuf
Claude Code additionally requires CLAUDE_CODE_ENABLE_TELEMETRY=1:
export CLAUDE_CODE_ENABLE_TELEMETRY=1
export OTEL_EXPORTER_OTLP_ENDPOINT=https://app.harness.io/udp-ingest/otel/v1/traces
export OTEL_EXPORTER_OTLP_HEADERS="Authorization=Bearer ${HARNESS_OTEL_TOKEN}"
export OTEL_TRACES_EXPORTER=otlp
export OTEL_EXPORTER_OTLP_PROTOCOL=http/protobuf
LangChain emits OTel when LangSmith's OTel export is enabled with LANGSMITH_OTEL_ENABLED=true:
export LANGSMITH_OTEL_ENABLED=true
export OTEL_EXPORTER_OTLP_ENDPOINT=https://app.harness.io/udp-ingest/otel/v1/traces
export OTEL_EXPORTER_OTLP_HEADERS="Authorization=Bearer ${HARNESS_OTEL_TOKEN}"
export OTEL_TRACES_EXPORTER=otlp
export OTEL_EXPORTER_OTLP_PROTOCOL=http/protobuf
Enable the otel callback in your LiteLLM proxy config, then set the standard exporter variables:
# config.yaml
litellm_settings:
  callbacks: ["otel"]
export OTEL_EXPORTER_OTLP_ENDPOINT=https://app.harness.io/udp-ingest/otel/v1/traces
export OTEL_EXPORTER_OTLP_HEADERS="Authorization=Bearer ${HARNESS_OTEL_TOKEN}"
export OTEL_TRACES_EXPORTER=otlp
export OTEL_EXPORTER_OTLP_PROTOCOL=http/protobuf
After setting the variables, restart the application or gateway so they take effect.
Step 3: Verify Traces in Cost Explorer
- Wait for traces to flow. Traces usually appear within a few minutes; allow up to about 20 minutes for ingestion and cost enrichment.
- Go to Cloud & AI Cost Management > Cost Explorer.
- Select the AI Traces view or group by Service Name.
- Look for the service name (from
service.nameattribute in traces). - Select a service row to open the Service Traces drawer.
- Inspect recent runs, span waterfalls, and per-span cost attribution.
Step 4: (Optional) Send a Test Trace
Before wiring up the full application, confirm the endpoint and token work by sending a single test span with curl.
Replace <ACCOUNT_ID> with the account identifier and <YOUR_TOKEN> with the token from Step 1, then run:
curl --request POST \
  --url 'https://app.harness.io/udp-ingest/otel/v1/traces?accountIdentifier=<ACCOUNT_ID>&routingId=<ACCOUNT_ID>' \
  --header 'content-type: application/json' \
  --header 'Authorization: Bearer <YOUR_TOKEN>' \
  --data '{
  "resourceSpans": [
    {
      "resource": {
        "attributes": [
          { "key": "harness.account.id", "value": { "stringValue": "<ACCOUNT_ID>" } },
          { "key": "service.name", "value": { "stringValue": "test-service" } }
        ]
      },
      "scopeSpans": [
        {
          "scope": { "name": "otlp-test-client" },
          "spans": [
            {
              "traceId": "aabbccdd11223344aabbccdd11223344",
              "spanId": "0000000000000001",
              "name": "test-span",
              "startTimeUnixNano": "1778241600000000000",
              "endTimeUnixNano": "1778241600500000000"
            }
          ]
        }
      ]
    }
  ]
}'
Note: startTimeUnixNano and endTimeUnixNano are example nanosecond timestamps (they resolve to a 2026 date). If the test span does not appear, regenerate current values — for example, run date +%s and append nine zeros for nanoseconds.
Then open the AI Traces view in Cost Explorer and look for test-service. It usually appears within a few minutes; allow up to about 20 minutes.