> For the complete documentation index, see [llms.txt](https://developer.harness.io/llms.txt). Markdown versions of documentation pages are available by appending `.md` to page URLs; this page is available as [Markdown](https://developer.harness.io/cloud-cost-management/use-cacm/data-job-status.md).
# Data Job Status
Monitor and troubleshoot data ingestion and processing jobs across your cloud cost data pipeline in Harness CACM.
## Overview
{% hint style="info" %}
The early access feature is behind a feature flag. Contact [Harness Support](mailto:support@harness.io) to enable the feature.
{% endhint %}
The Data Job Status feature provides real-time visibility into the status of data ingestion and processing jobs across your cloud cost data pipeline in Harness Cloud & AI Cost Management (CACM). It enables you to monitor, track, and troubleshoot data jobs that ingest billing data from cloud providers (AWS, Azure, GCP) into Harness.
Before Data Job Status, users had limited visibility into:
* Data freshness: No way to know if billing data was up-to-date or if ingestion was delayed
* Failure detection: Failures in data pipelines went unnoticed until users saw stale data in dashboards
* Troubleshooting: When data was missing or incorrect, there was no audit trail to diagnose issues
* SLA monitoring: No metrics to track data pipeline health or performance trends
This feature addresses these gaps by providing a centralized view of all data job activity with full execution history.
{% embed url="" %}
### Key capabilities
* Real-time job monitoring: Track the current state of all data jobs (QUEUED, RUNNING, SUCCESS, FAILED, etc.)
* Historical execution tracking: View complete execution history with state transitions and timestamps
* Dashboard overview: Get aggregated statistics on active jobs, jobs requiring attention, and completed jobs
* Filtering and search: Filter jobs by connector, job kind, status, and billing period
* Average duration tracking: See historical average execution times per connector/job kind
## Data job status dashboard
{% hint style="info" %}
**INITIAL DATA POPULATION**
After enabling this feature for your account, it takes approximately 24 hours to populate the job statuses for all connectors. During this period, you may see incomplete or missing data.
{% endhint %}
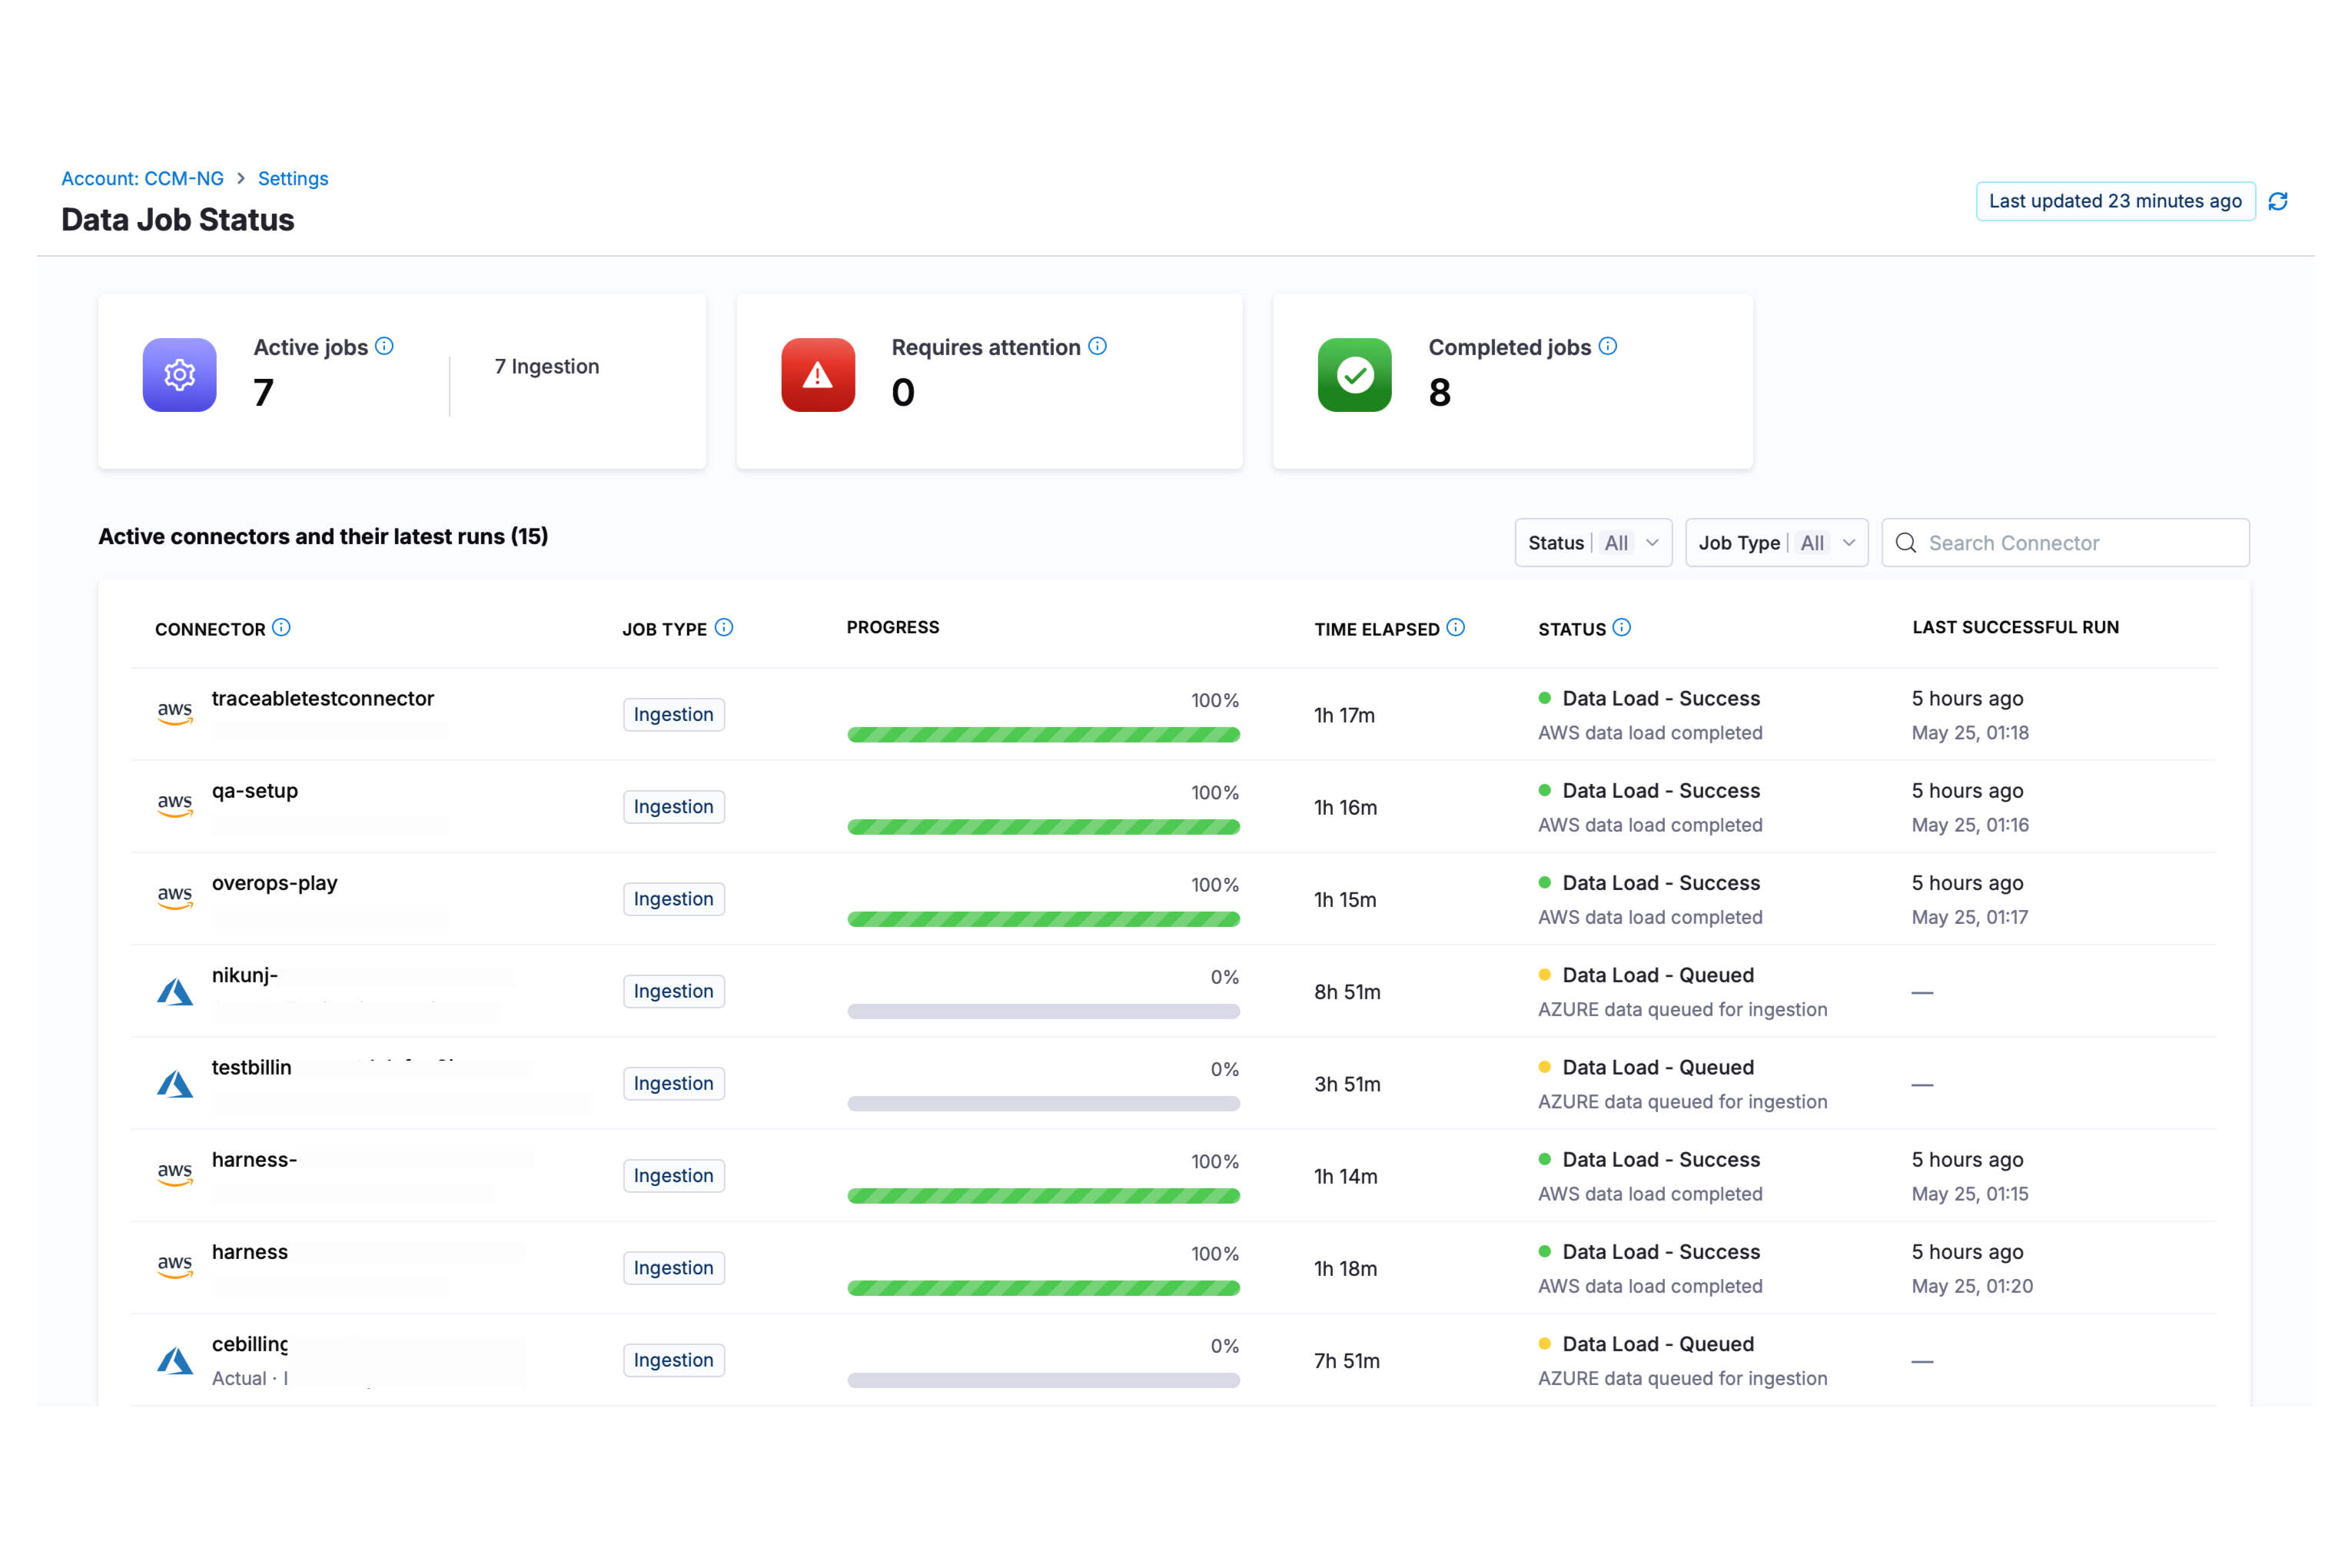
Data Job Status Dashboard Overview
When you connect cloud accounts (AWS, Azure, GCP) to Harness CACM, background jobs run to ingest billing data, process it, and make it available for cost analysis. The Data Job Status page lets you:
* Monitor active data ingestion jobs
* Identify jobs that require attention (failed or stuck)
* View completed jobs
* Drill into job details and logs
* Review historical job runs by billing period
The page displays three summary widgets at the top:
* **Active Jobs**: Jobs currently running or queued across all connectors.
* **Requires Attention**: Jobs that have failed or are taking longer than expected.
* **Completed Jobs**: Jobs that finished successfully.
### Jobs list
Below the widgets, a table displays all active connectors and their latest job runs with the following columns:
* **Connector** - The cloud connector name and ID, with cloud provider icon
* **Job Type** - Type of job
* **Progress** - Visual progress bar showing job completion status
* **Time Elapsed** - Duration since the job started
* **Status** - Current job status with phase and message details. This also shows phases:
* **Data Sync** - Transfers billing data from your cloud provider (AWS S3, GCP BigQuery, or Azure) to CACM storage
* **Data Enrichment** - Applies post-processing such as monthly rollups, cost category stamping, label processing, currency conversion, and MSP adjustments
* **Data Load** - Completes core ingestion and final load, after which your data is fresh and available for analysis
* **Last Successful Run** - Timestamp of the most recent successful job completion for this connector
### Filter and search
You can filter the jobs list using:
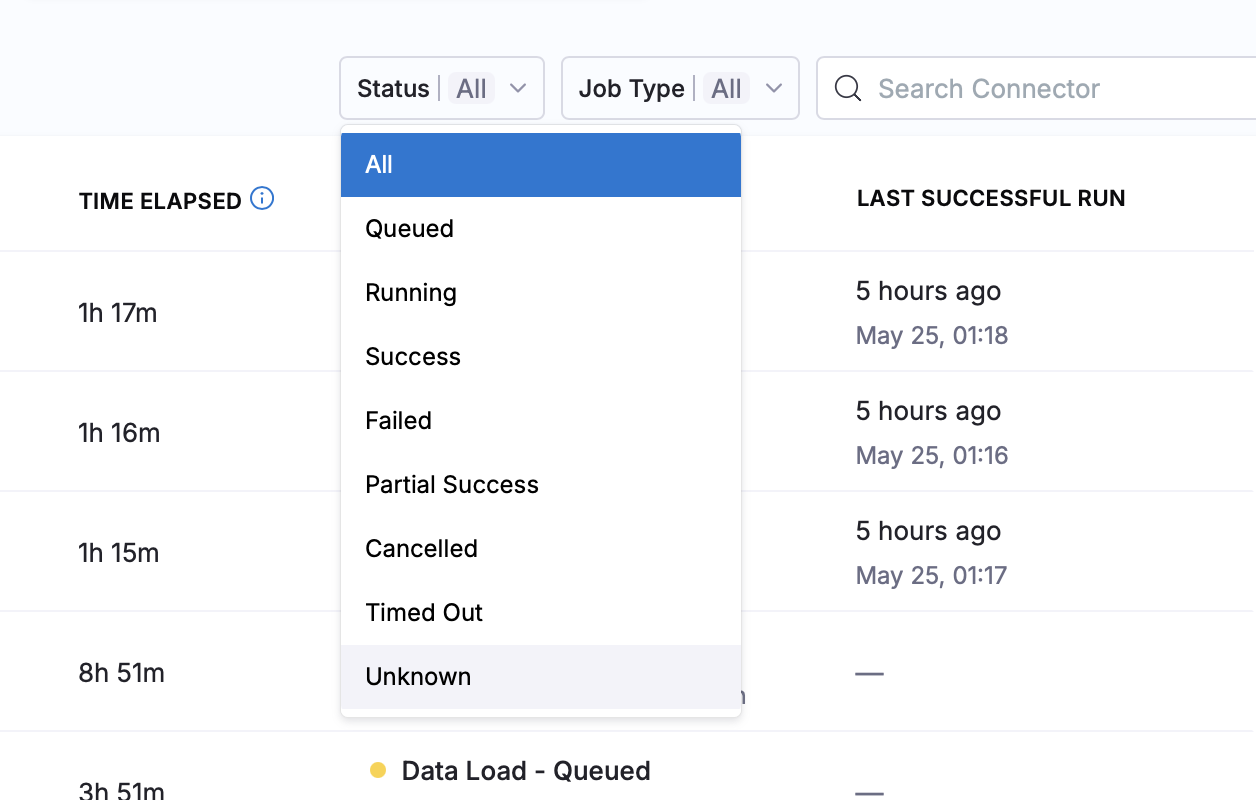
* **Status Filter** - Filter by job status:
* **All** - Shows all jobs regardless of status
* **Queued** - Jobs waiting in queue to be processed
* **Running** - Jobs currently being executed
* **Success** - Jobs that completed successfully
* **Failed** - Jobs that encountered an error and stopped
* **Partial Success** - Jobs that completed with some errors or warnings
* **Cancelled** - Jobs that were manually cancelled by a user
* **Timed Out** - Jobs that exceeded the maximum allowed execution time
* **Unknown** - Jobs with an undetermined or unrecognized status
Status Filter Options
* **Job Type Filter** - Filter by job type (All, Ingestion) Currently:
| Job Type | Description |
| ---------------------------------- | --------------------------------------------- |
| Ingestion | Ingests raw billing data from cloud providers |
| Inventory (planned for next phase) | Collects resource inventory information |
| Other | Other background processing jobs |
Job Type Filter Options
{% hint style="info" %}
**EMPTY STATES**
* No connectors: If no cloud connectors are configured, you will see a prompt to add a connector
* No matching jobs: If filters return no results, you can clear all filters to see all jobs
As stated earlier, once enabled, it takes approximately 24 hours to display all connector statuses.
{% endhint %}
## Job details drawer
Clicking on any job row opens a details drawer with two tabs:
### Job run details tab
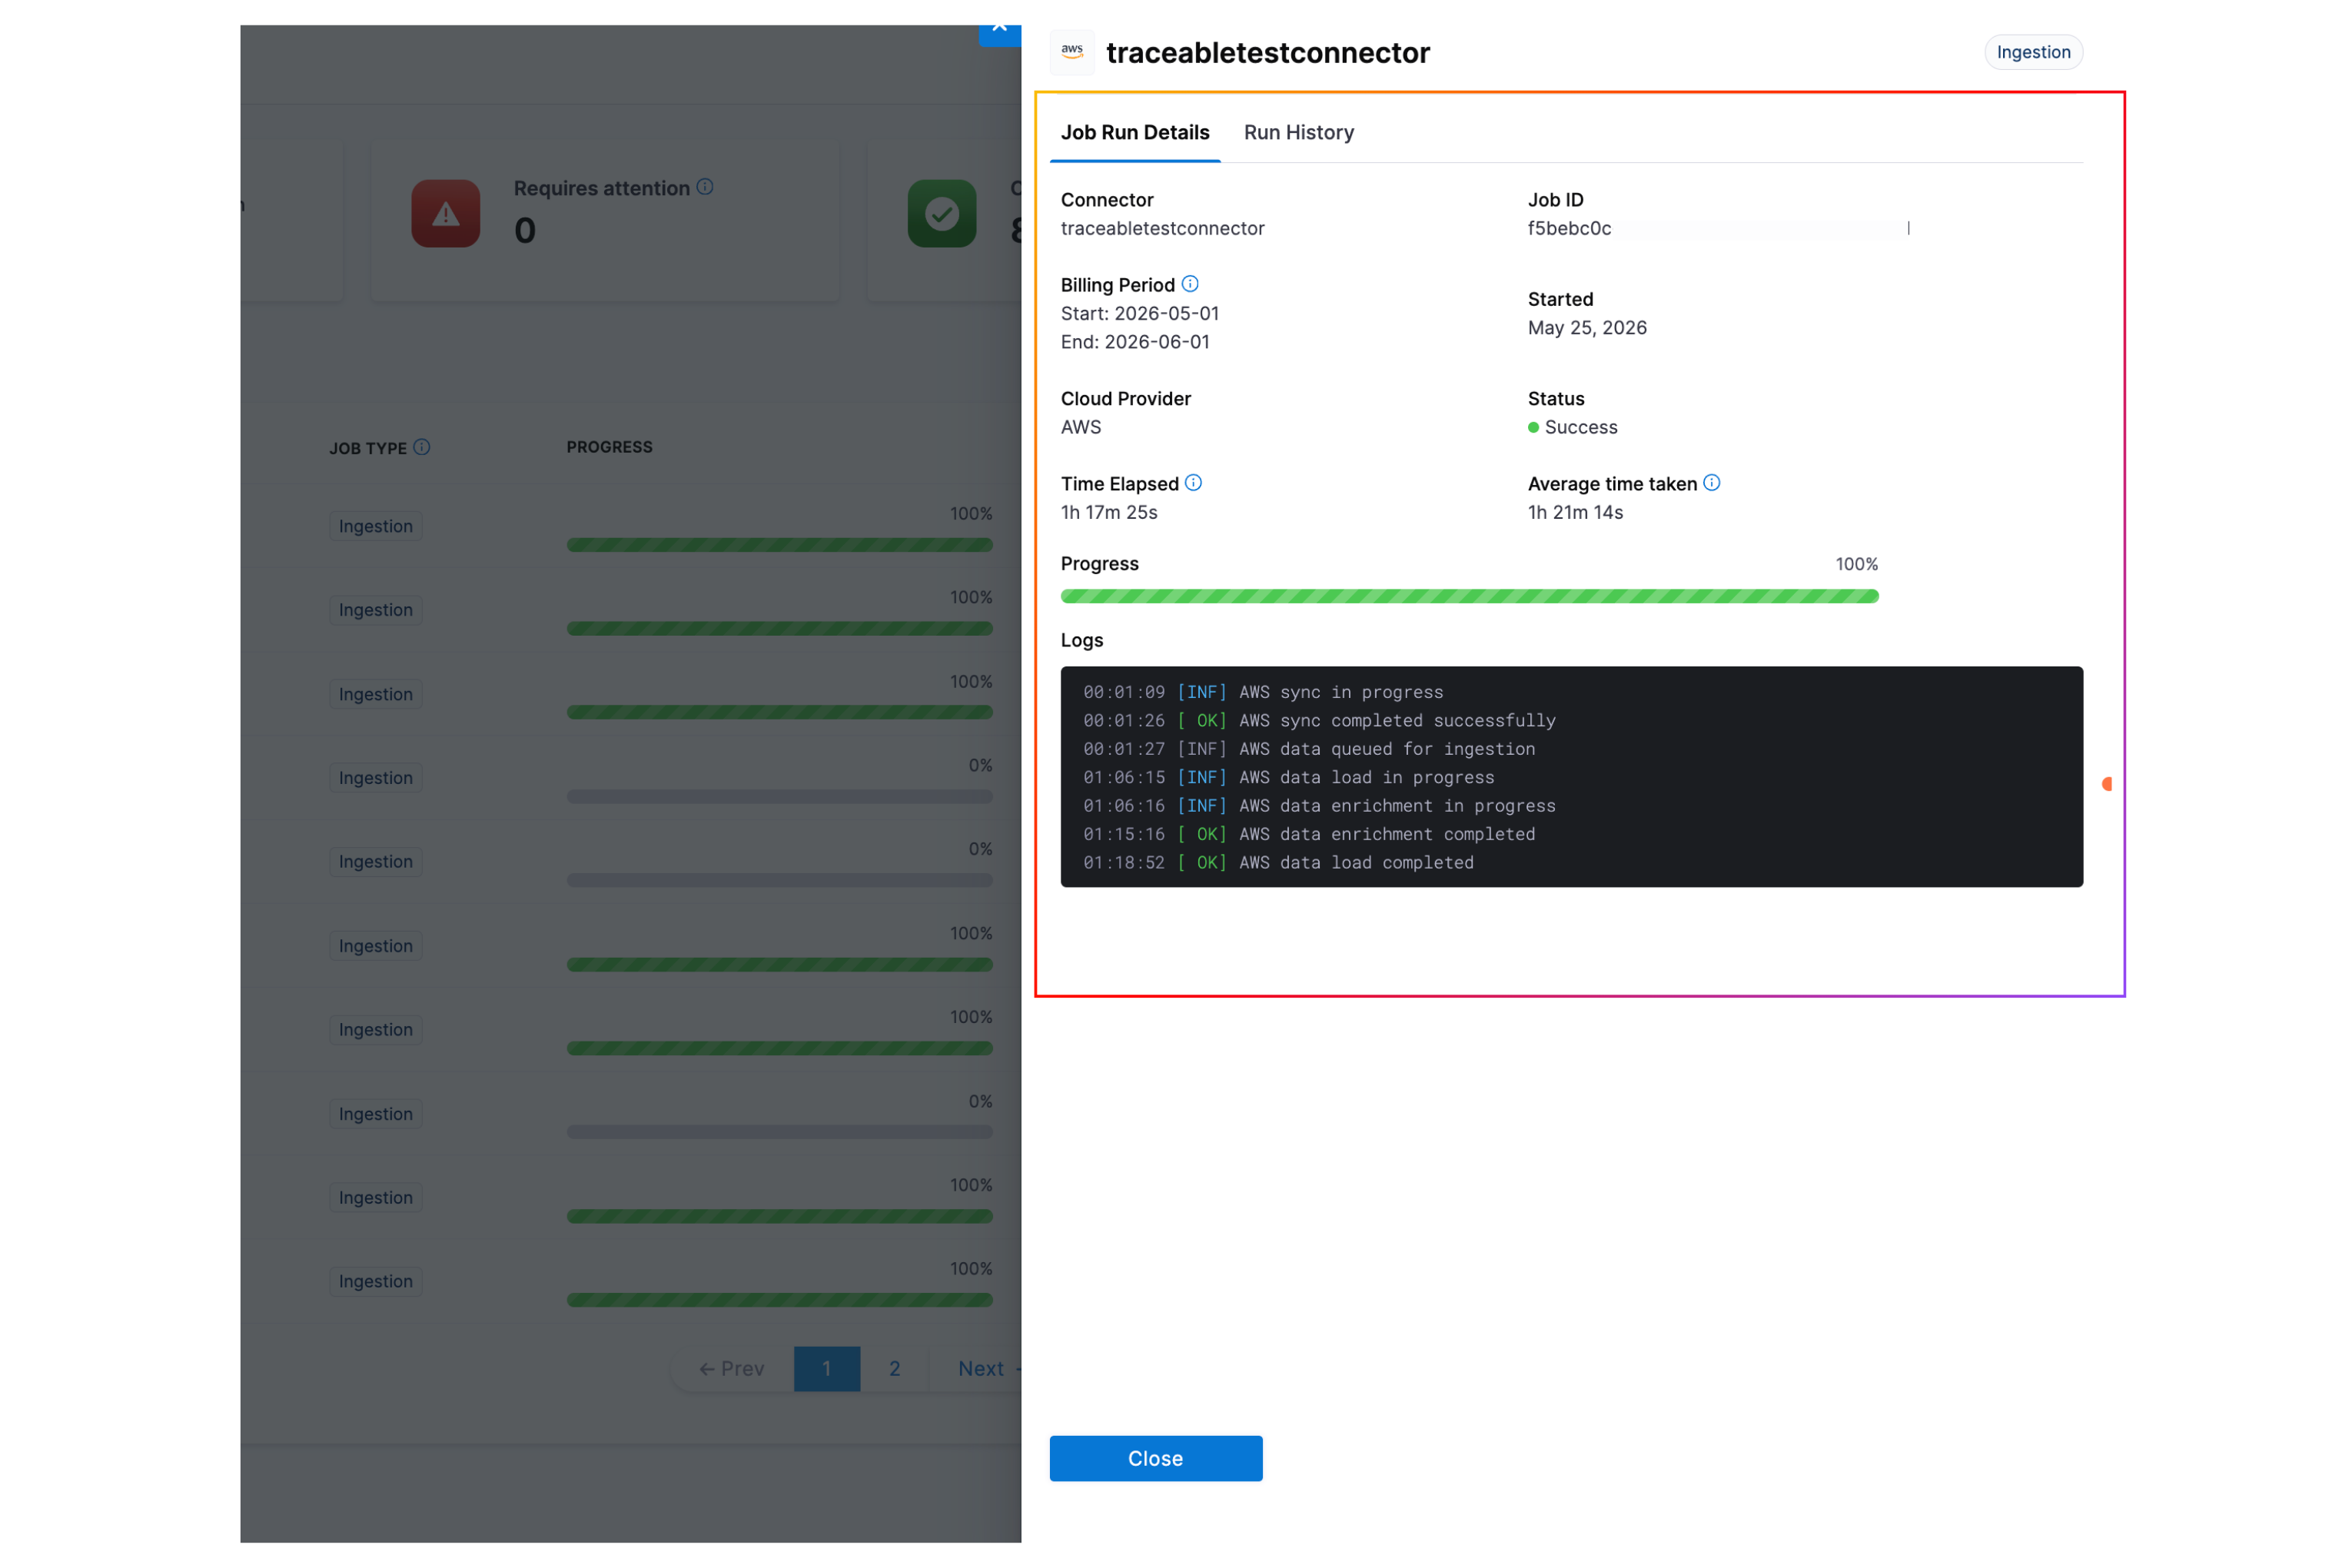
Job Run Details Panel
Displays detailed information about the current/latest job run:
| Field | Description |
| ------------------ | ------------------------------------------------------------- |
| Connector | Connector ID |
| Job ID | Unique identifier for this job run |
| Billing Period | The date range being processed (e.g., "Jan 1 - Jan 31, 2024") |
| Started | Timestamp when the job started |
| Cloud Provider | AWS, Azure, or GCP |
| Status | Current status with visual indicator |
| Time Elapsed | How long the job has been running |
| Average Time Taken | Average time taken based on last 30 days ingestion |
A progress bar visualizes the job's progress relative to its average completion time.
It also shows logs:
* What phase the job is in along with the status. Phases are:
* **Data Sync** - Transfers billing data from your cloud provider (AWS S3, GCP BigQuery, or Azure) to CACM storage
* **Data Enrichment** - Applies post-processing such as monthly rollups, cost category stamping, label processing, currency conversion, and MSP adjustments
* **Data Load** - Completes core ingestion and final load, after which your data is fresh and available for analysis
* If multiple ingestions occur in a single day, you will see multiple log entries for that execution day.
* Any errors or warnings encountered
* Processing details based on the billing month
### Run history tab
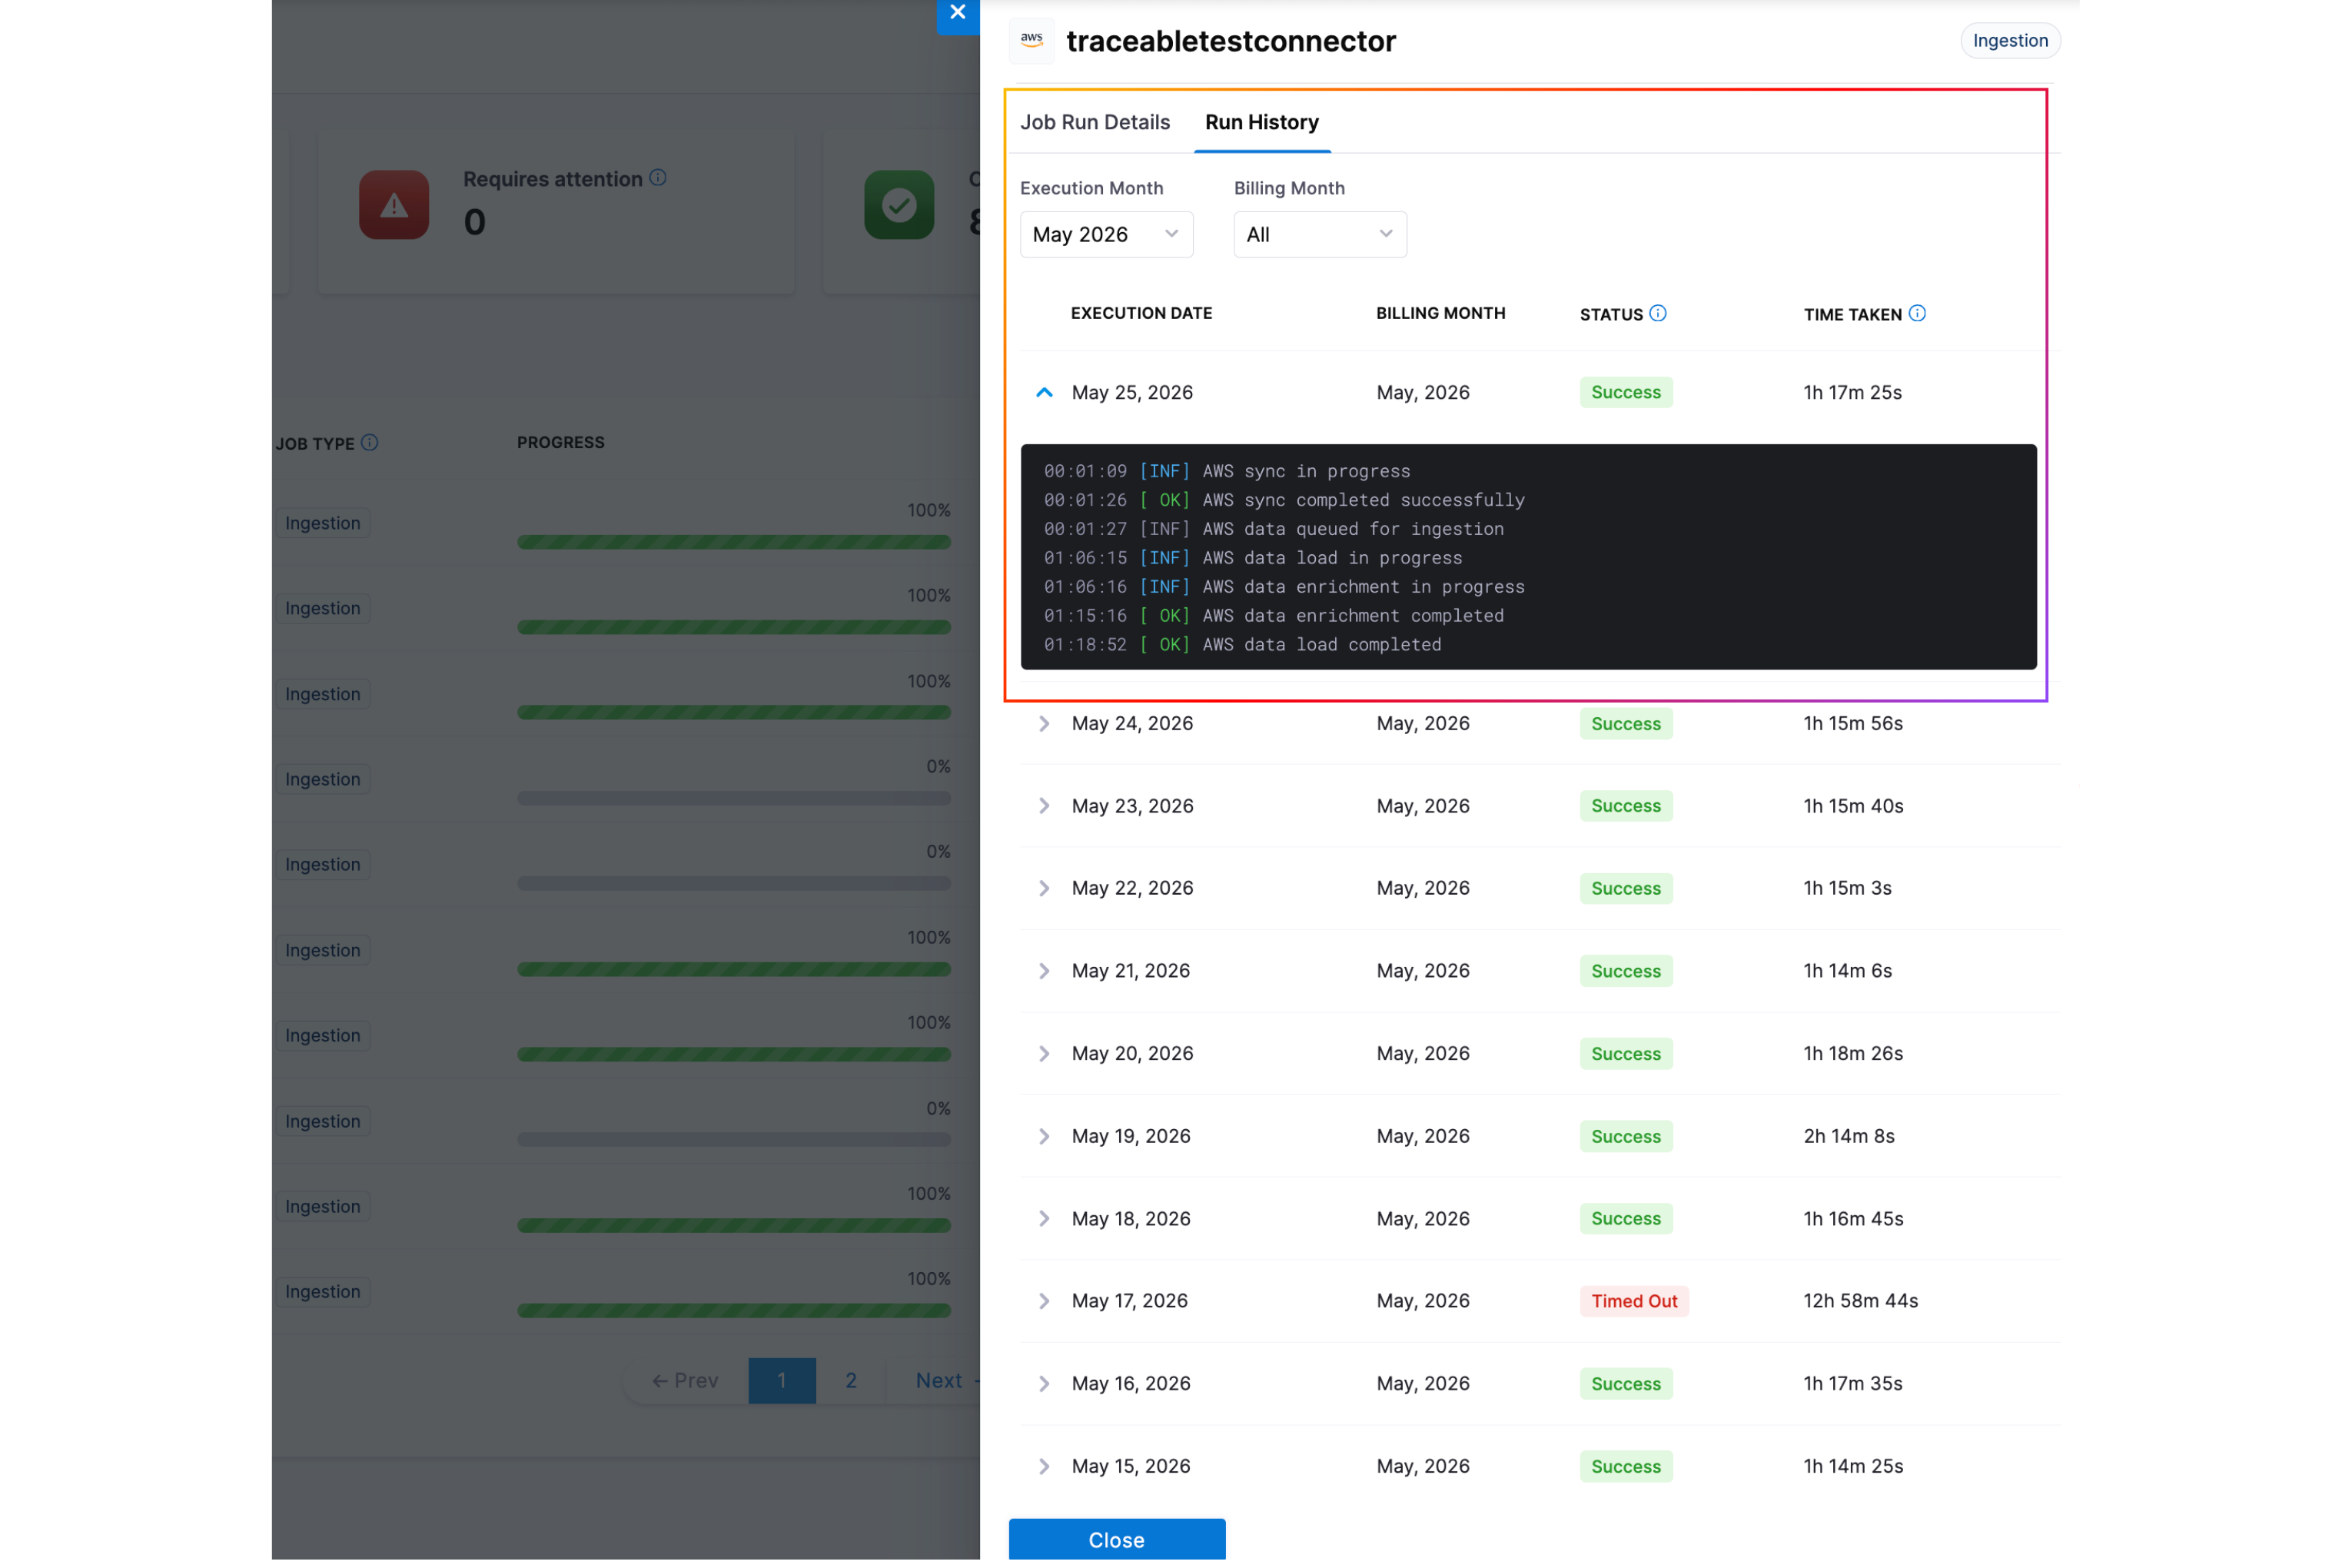
Run History Tab
View historical job runs for the selected connector and filter by:
* **Execution Month** - The month when the job was actually executed and processed
* **Billing Month** - The billing period the job was processing data for (e.g., January billing data may be processed in February)
The history table displays the following columns:
* **Execution Date** - The date and time when the job was executed
* **Billing Month** - The billing period that was processed by the job
* **Status** - The final status of the job run
* **Time Taken** - Total duration from start to completion
Click the expand icon to view detailed logs for any historical run.
## Good to know
**Enterprise Edition Only**
Data Job Status is only available for Enterprise Edition licenses.
**Supported Cloud Providers**
Only the following cloud providers are supported:
* AWS (Cost and Usage Reports)
* Azure (Cost Exports - both ACTUAL and AMORTIZED)
* GCP (BigQuery billing exports)
**SMP (Self-Managed Platform) Not Supported**
Data Job Status is not supported in SMP deployments (ClickHouse-enabled environments).
**History TTL**
History records are automatically deleted after 6 months.
**Azure Cost Types**
For Azure connectors, jobs are tracked separately for:
* ACTUAL costs (pay-as-you-go)
* AMORTIZED costs (reserved instance amortization)
When filtering history, you may need to specify the `azureCostType` parameter if you are using the API.
**Connector Name vs Connector ID**
* Jobs are stored with `connectorId` (immutable identifier)
* On connector rename, the latest name is displayed on the next sync.
* Always use `connectorId` for programmatic access
**Billing Period Alignment**
* `billingDateStart` and `billingDateEnd` represent the billing period being processed
* For monthly billing (AWS, Azure, GCP), this is typically the first and last day of the month
* Billing month data does not overlap. Multiple billing months can be ingested on the same day, but each job processes a distinct billing period without duplication.
{% @harness-feedback/feedback %}