View CPU and memory utilization metrics
Harness CI provides real-time visibility into resource utilization during CI stage execution. This feature helps you understand how your builds consume CPU and memory resources, enabling you to optimize resource allocation and troubleshoot performance issues.
This feature is only available for CI stages running on Harness Cloud build infrastructure across Linux, macOS, and Windows platforms. It is not supported on self-managed build infrastructures.
This feature requires the CI_CPU_MEMORY_INSIGHTS feature flag. To enable it, contact Harness Support.
Access resource metrics
To view resource utilization metrics for a pipeline execution:
-
Go to Builds and select a completed or running build.
-
Select the stage that ran on Harness Cloud infrastructure.
-
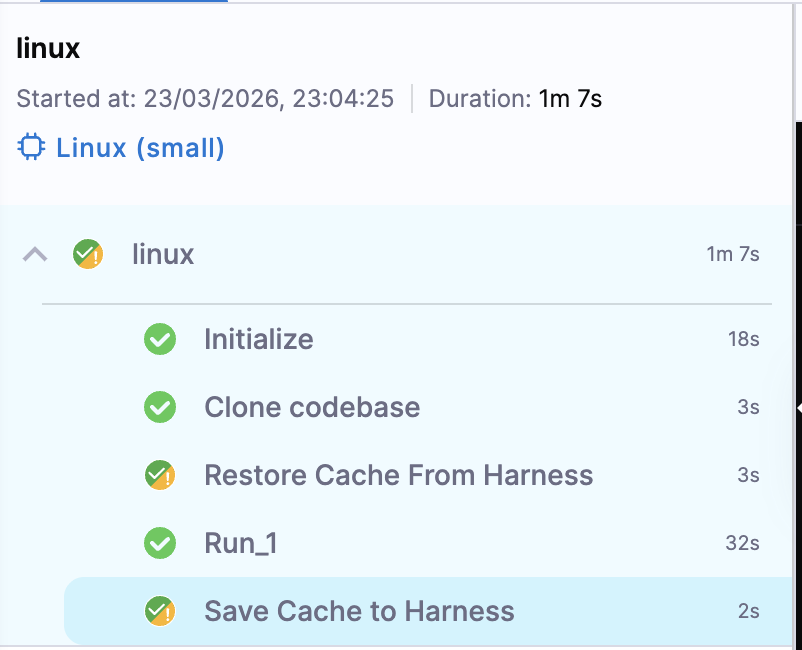
In the execution view, locate the resource info button in the stage header. The button displays the platform and resource class, such as Linux (Large) or Windows (Medium).
-
Select the button to open the Resource Insights drawer.
Understanding the metrics
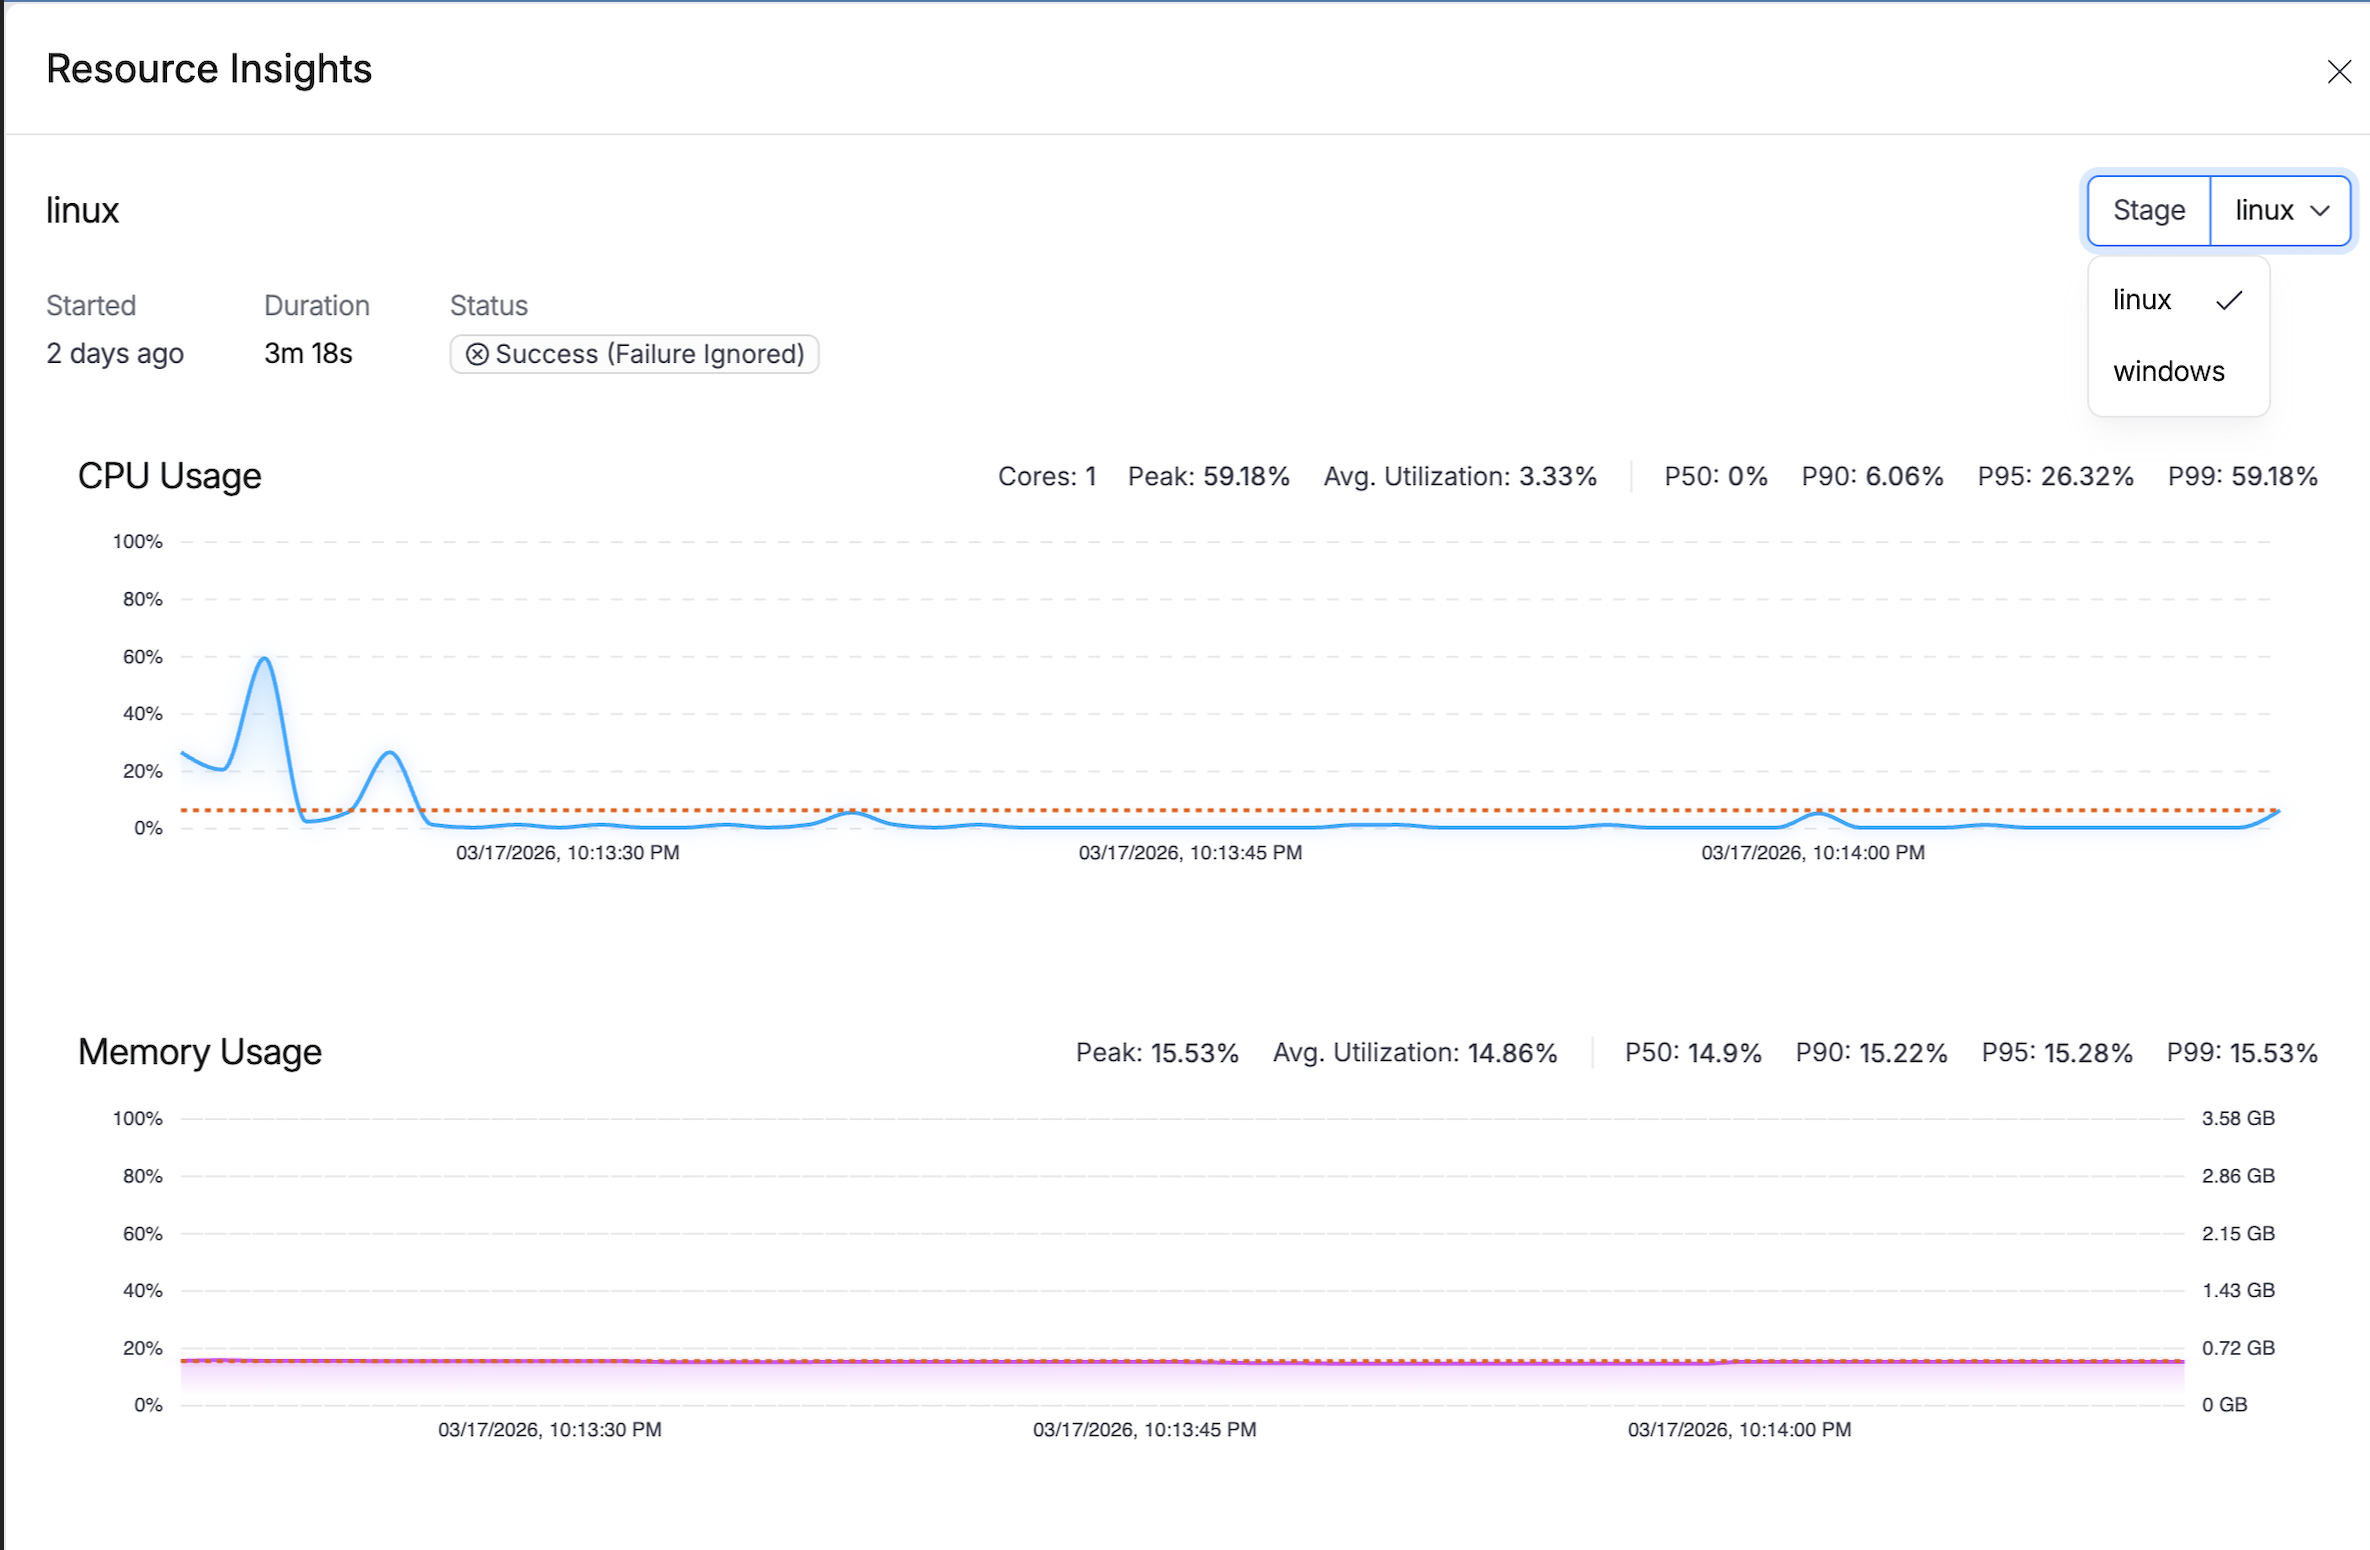
The Resource Insights drawer displays real-time and summary metrics for your build execution.
Real-time metrics
During pipeline execution, metrics are collected periodically and displayed as interactive charts:
| Metric | Description |
|---|---|
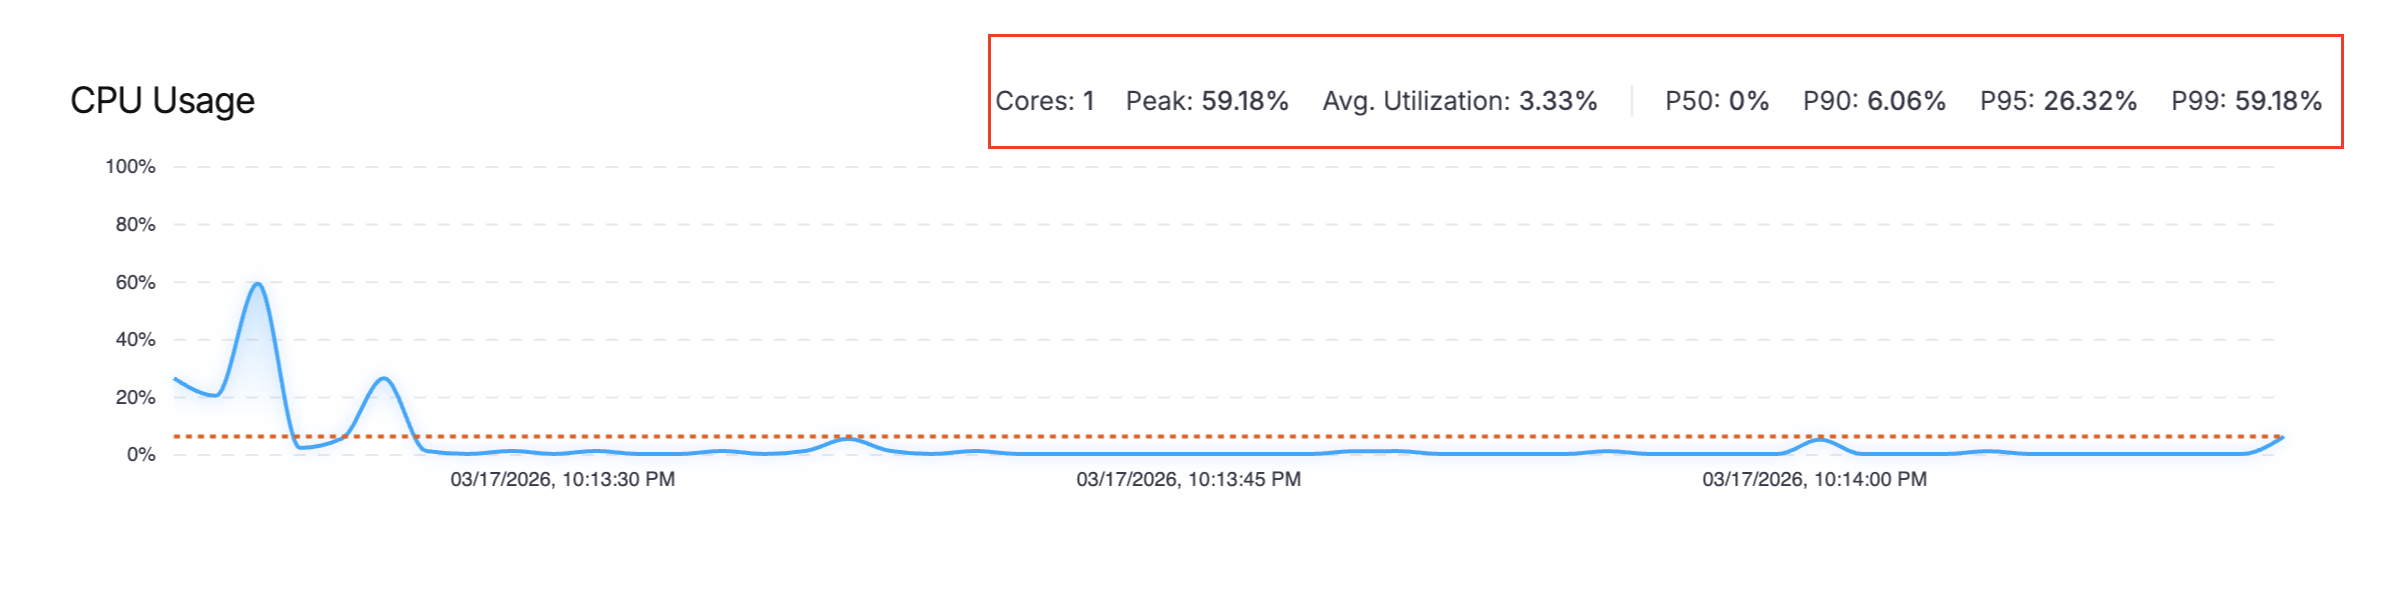
| CPU Usage | Percentage of CPU utilized over time |
| Memory Usage | Memory consumption in GB over time |
Summary metrics
After the pipeline completes, summary statistics are calculated to help you understand overall resource consumption:
| Metric | Description |
|---|---|
| Peak Usage | Maximum resource utilization during execution |
| Avg. Utilization | Mean resource utilization across the entire execution |
| P50 | 50th percentile (median) usage |
| P90 | 90th percentile usage — 90% of the time, usage was at or below this value |
| P95 | 95th percentile usage |
| P99 | 99th percentile usage |
Percentile metrics are useful for capacity planning. For example, P90 tells you that 90% of your build time had resource usage at or below this level, filtering out brief spikes that might skew the average.
Use cases
Right-size your resource class
If your P90 CPU or memory usage is consistently low (for example, below 30%), consider using a smaller resource class to reduce costs. Conversely, if you see frequent spikes near 100%, upgrading to a larger resource class may improve build performance.
For available resource classes, go to Use Harness Cloud build infrastructure.
Diagnose slow builds
High CPU or memory utilization during specific steps can indicate:
- Resource-intensive operations that might benefit from optimization
- Memory leaks in test suites
- Inefficient parallel execution configurations
Identify OOM risks
If memory usage approaches the resource class limit, your build may be at risk of Out of Memory (OOM) failures. The metrics help you proactively identify and address these issues before they cause build failures.
Data retention
Resource utilization metrics are available for up to 30 days from the pipeline execution date, consistent with the default execution data retention period.
Metrics data
The following metrics are collected during CI stage execution:
| Field | Unit | Description |
|---|---|---|
| Total Memory | GB | Total available system memory |
| Available Memory | GB | Free memory at each sample |
| Total CPU | Cores | Number of CPU cores |
| Available CPU | % | Unused CPU percentage |