View builds
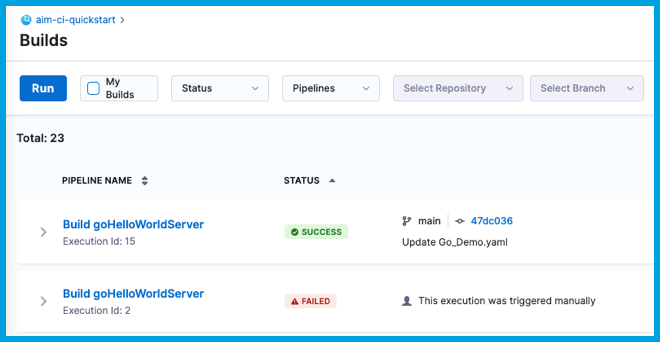
From the Builds page, you can inspect past builds and monitor the progress of ongoing builds.

The Builds page provides the following information about current and past builds:
- Pipeline Name: The name of the pipeline that ran and the build number (Execution Id). Select the pipeline name to go to the Build details page.
- Status: The build status, such as running, failed, or success.
- Trigger: How the build started, whether from a Git even, cron trigger, or manually. Builds triggered by webhooks can include the associated branch name, a link to the associated PR or commit, and the latest commit message. For more information, go to SCM status checks.
- Execution Start Time: The name of the user that started the build, whether by webhook trigger or manually, and how long ago the build started.
- Runtime: How long the build ran.
Build details
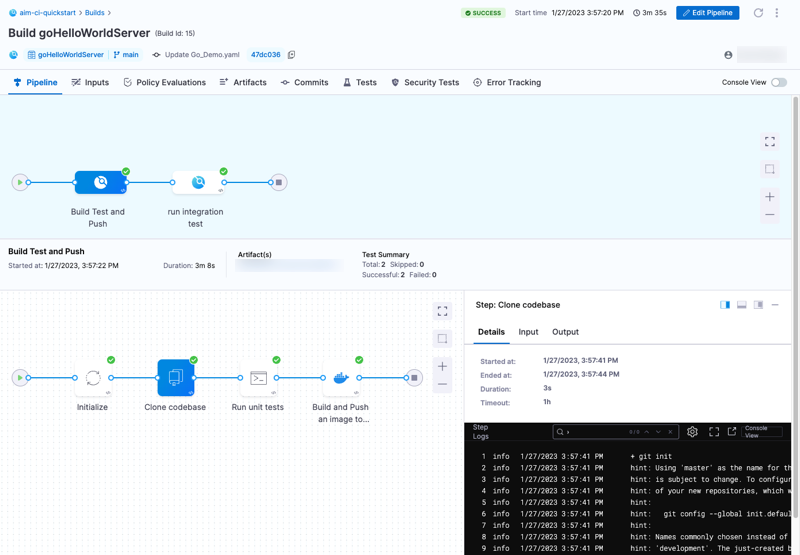
On the Build details page, you can investigate a variety of details about a specific build.

Pipeline tab (logs)
This tab shows the build stages and steps.
Select a step to investigate logs, inputs, outputs, and errors (if any) for that steps. If enabled, Harness AI can provide troubleshooting assistance.
When troubleshooting failed builds, you can switch to Console View to allocate more screen space to logs. Once you've identified a potential cause, select Edit Pipeline to go directly to the Pipeline Studio.
Troubleshoot build log issues
Go to the CI Knowledge Base for issues and questions related to build logs, such as:
- Truncated execution logs
- Step logs disappear
- CI step logs don't load in real time.
- Step succeeds even when explicitly executing exit 1 in a Bash script that is runs in script's background
- A previous execution is missing from my Builds dashboard or Project Overview page.
Inputs tab
This tab lists pipeline-level inputs. Step-level inputs are reported in the step details on the Pipeline tab.
Artifacts tab
This tab provides links to artifacts, such as images or reports, produced during the build.
Availability of artifact details depends on the upload location, build configuration, or build infrastructure. For an example and more information, go to Publish to the Artifacts tab.
Commits tab
This tab provides a list of commits that triggered the build, along with source code repo links, if applicable.
Tests tab
This tab presents test results from Run or Test steps. For more information, go to View tests.
Annotations tab
This tab presents all the annotations created during the build. Annotations provide a quick and customizable summary of critical build metrics and are sorted by priority. For more information, go to Pipeline Annotations.
Other tabs
The Policy Evaluations and Security Tests tabs report information from other Harness modules and features, such as Harness Policy As Code, if these are enabled and included in the pipeline.
Dashboards
For information about Harness dashboards, go to the Platform documentation on Dashboards.