Webhook for Metric Alerts
Use the Metric Alert webhook to automatically send Harness FME metric significance alerts and alert policy degradations to your preferred tools, such as Jira, PagerDuty, Slack, or custom systems. This webhook helps experimentation, SRE, and product teams improve visibility and reduce manual monitoring.
Whenever a metric alert or significance event is triggered in Harness FME, a JSON payload is sent as an HTTP POST to the configured webhook URL. You can filter alerts by environment and alert type to control which notifications are delivered.
You can use metric alert webhooks to automate the ingestion of experiment and feature flag alerts across your systems. For example:
- PagerDuty: automatically trigger an incident when a guardrail metric degrades.
- Slack: Notify experiment owners when a key metric reaches statistical significance.
- Jira: Create a ticket when a metric alert policy threshold is breached.
- Custom analytics pipelines: Forward metric data to a data warehouse for aggregation or visualization.
Prerequisites
- FME Administrator access is required to create webhooks
- Permission to create or edit Harness connectors (
core_connector_edit) at the account level. Metric alert webhooks are implemented as Harness connectors, which require account-level connector permissions - An HTTPS endpoint for receiving
POSTpayloads - A standardized payload schema consistent with existing webhooks for impressions and audit logs
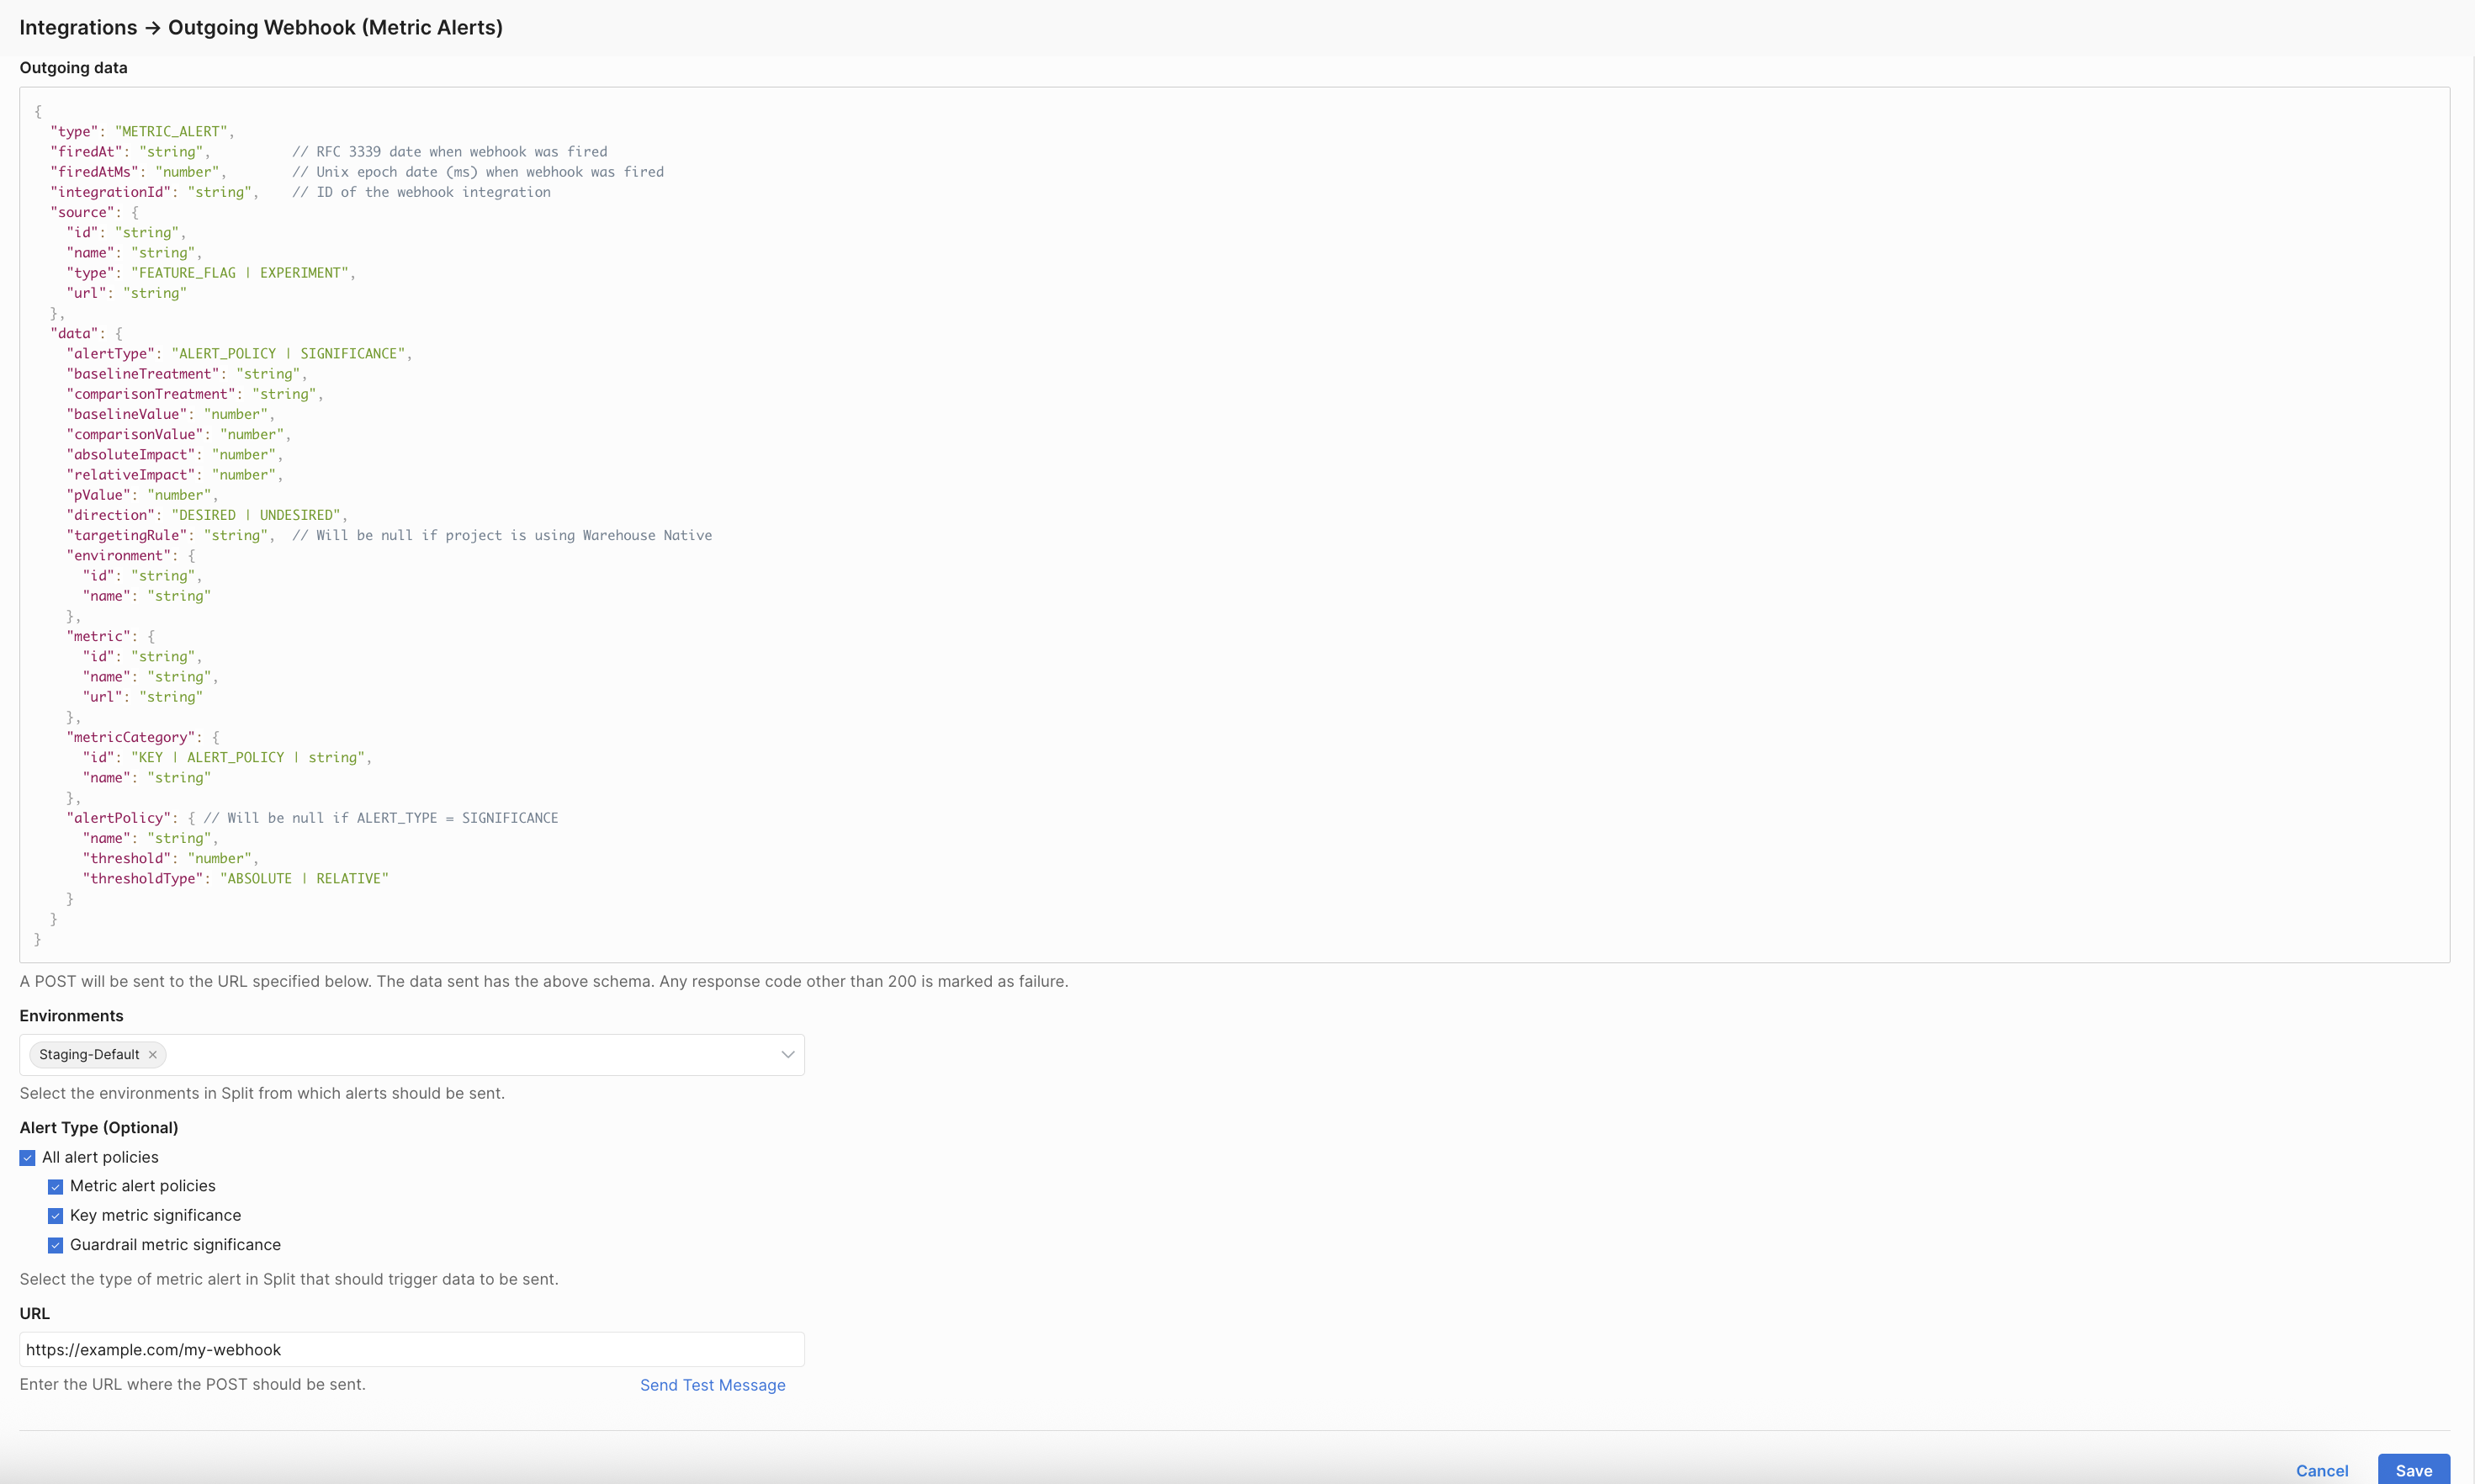
Outgoing data
When a metric alert is triggered, Harness FME sends a POST request to the specified webhook URL with the following payload schema:
{
  "type": "METRIC_ALERT",
  "firedAt": "string",          // RFC 3339 date when the webhook was fired
  "firedAtMs": "number",        // Unix epoch date (ms) when the webhook was fired
  "integrationId": "string",    // ID of the metric alert webhook integration
  "source": {
    "id": "string", // Feature flag or experiment ID
    "name": "string", // Feature flag or experiment name
    "type": "FEATURE_FLAG | EXPERIMENT",
    "url": "string" // Feature flag or experiment URL
  },
  "data": {
    "alertType": "ALERT_POLICY | SIGNIFICANCE",
    "baselineTreatment": "string",
    "comparisonTreatment": "string",
    "baselineValue": "number",
    "comparisonValue": "number",
    "absoluteImpact": "number",
    "relativeImpact": "number",
    "pValue": "number",
    "direction": "DESIRED | UNDESIRED",
    "targetingRule": "string",  // Will be null if the project is using Warehouse Native Experimentation
    "environment": {
      "id": "string",
      "name": "string"
    },
    "metric": {
      "id": "string",
      "name": "string",
      "url": "string"
    },
    "metricCategory": {
      "id": "KEY | ALERT_POLICY | string",
      "name": "string"
    },
    "alertPolicy": { // Will be null if ALERT_TYPE = SIGNIFICANCE
      "name": "string",
      "threshold": "number",
      "thresholdType": "ABSOLUTE | RELATIVE"
    }
  }
}
A 200 response indicates a successful delivery. Any other response code is marked as a failure.
Retry
If Harness FME receives a non-200 response to a webhook POST, it waits 300 milliseconds and retries delivery once.
Setup
To configure the metric alert webhook:
-
From the Harness FME navigation menu, click FME Settings > Integrations and select Webhooks from the categories menu.
-
Click Add on the Outgoing Webhook (Metric Alerts) integration and select a project to add the webhook to.

-
Select one or more environments in Harness FME from which alerts should be sent from under Environments.
-
Select the type of metric alert that should trigger webhook delivery:
- All alert policies
- Metric alert policies
- Key metric significance
- Guardrail metric significance
These alert-type selections apply to experiment alerts and feature flag alerts.
- All alert policies
-
Enter the webhook URL where
POSTrequests should be sent when an alert fires. You can click Send Test Message to verify the configuration. -
Click Save to create the webhook.
If you experience any issues with webhook delivery or payload configuration, contact Harness Support.