Multiple Comparison Correction (MCC)
Making multiple metric comparisons per experiment can substantially increase the chance of seeing a false positive result. A statistically significant metric may sometimes appear significant due to random variation rather than a real treatment effect.
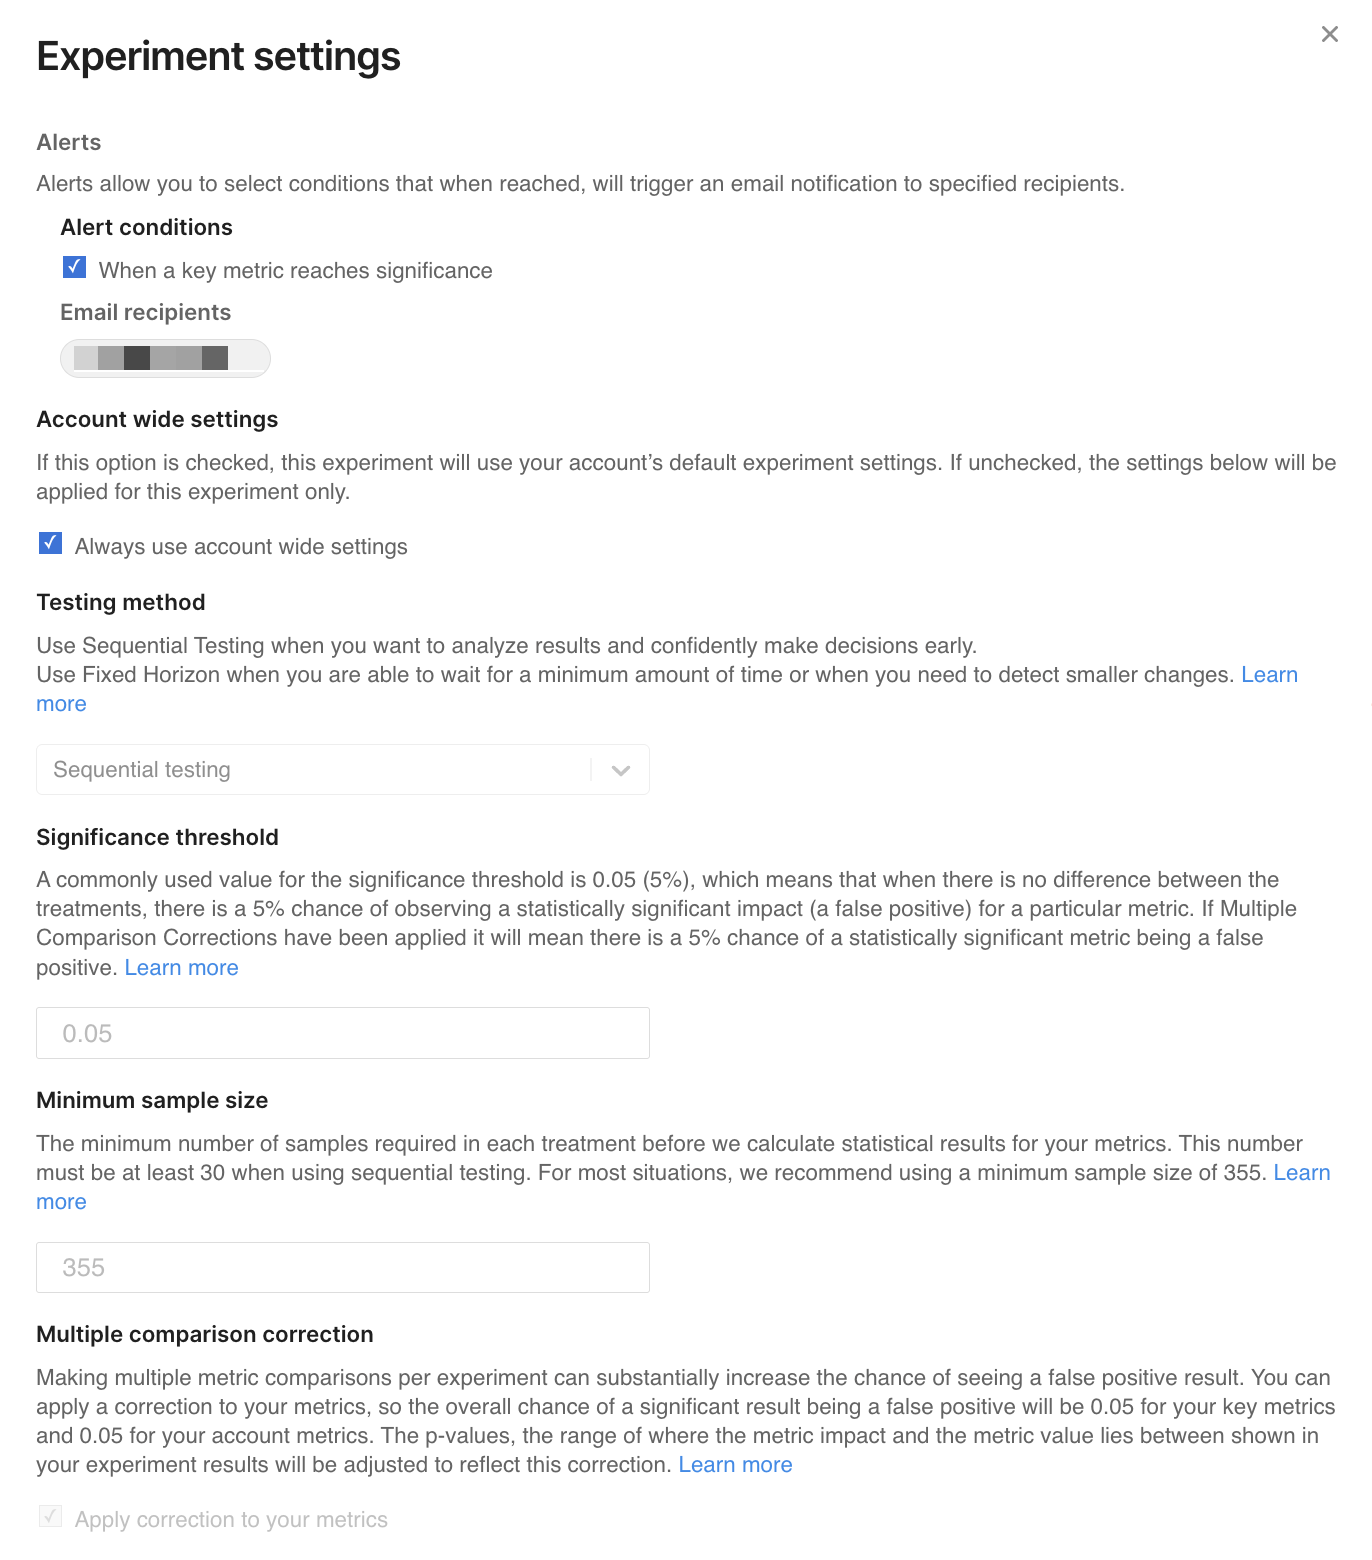
You can apply a multiple comparison correction (MCC) to your metrics to control this risk. When enabled, MCC adjusts p-values to account for multiple metric comparisons, helping ensure that the rate of false positives is controlled relative to your selected significance threshold (for example, 0.05) for key, guardrail, and supporting metrics in the experiment.
The p-values, as well as the impact lies between and metric lies between ranges shown in experiment results, are adjusted to reflect this correction.
Multiple comparison correction (MCC) in Harness FME applies to statistical testing across metrics within an experiment. It does not apply to treatment-level comparisons between experiment variants.
The likelihood of getting a false positive is controlled by the significance threshold set in your experiment settings. For example, with the default significance threshold of 0.05 and in a standard test with no multiple comparison correction (MCC), there is a 5% chance that your metric shows a statistically significant result at the end of your test when the treatment had no real impact on that metric. You could reduce this likelihood by lowering the significance threshold for your account. However, this also reduces the ability to detect true differences and may result in more false negatives.
With Harness FME, you can choose whether to have multiple comparison corrections applied to your results by selecting the Apply correction to your metrics checkbox in the Experiment settings modal. Using multiple comparison corrections is a strongly recommended best practice in experimentation whenever you are testing multiple metrics. This is because each individual metric brings its own chance of showing a false positive. If no corrections are applied then the more metrics you test, the higher your chance of getting false positive results. For example, whilst using the default significance threshold of 0.05 gives you a 5% chance of seeing a false positive when testing 1 metric, if you have 20 metrics then there is over 65% chance that at least one of those metrics would appear significant even when your treatment had no impact whatsoever.
Multiple comparison corrections solve this problem by taking into account how many metrics are being tested within an experiment group. For interpretability we adjust the p-value, this means that whether a metric is statistically significant or not still depends on whether its adjusted p-value is below your account's significance threshold.
This correction applies only to metric-level statistical testing within an experiment and does not apply to comparisons between treatment variants.
The multiple comparison correction
Harness FME applies the Benjamini–Hochberg procedure to control the False Discovery Rate (FDR).
There are a few potential ways to correct for multiple comparisons; Harness FME applies a Benjamini Hochberg correction. This controls the False Discovery Rate, or the fraction of all significant results which are false positives. Our corrections ensure that the likelihood that a statistically significant metric is a false positive is, at most, equal to your chosen significance threshold.
For example, with the correction applied, if you have 100 metrics in your account and a particular test shows 20 of those as statistically significant metrics, with the default significance threshold of 0.05, you can expect that around 1 of those 20 metrics will be a false positive; you can be confident that the others are indicative of a true impact. Without corrections applied, testing 100 metrics means we’d expect at least 5 of them to appear significant even when your treatment had no impact at all.
Scope of the multiple comparison correction
In Harness FME, MCC applies to statistical testing across metrics within an experiment. The correction adjusts p-values based on the number of metrics being evaluated in each metric group (key, guardrail, and supporting metrics).
MCC is not applied to pairwise comparisons between multiple treatment variations in multi-treatment experiments.
For example, in a three-way split (A, B, and C), MCC does not adjust for pairwise comparisons; instead, MCC is only applied within each comparison separately. This includes comparisons such as:
A vs BA vs CB vs C
This means that while MCC accounts for testing multiple metrics, it does not adjust for the increased number of statistical comparisons introduced by multiple treatment arms.
Key, guardrail, and supporting metrics
The multiple comparison correction is applied separately to your set of key metrics, your set of guardrail metrics, and your set of supporting metrics. This is to allow you the flexibility to choose metrics which are of particular importance and relevance to your test and set them as key metrics.
If you select a single key metric, no multiple comparison correction is applied to that metric. This maximizes sensitivity for your primary hypothesis metric.
If you choose a small subset of your metrics to be key metrics, these have a smaller adjustment applied and have more power and more sensitivity to detect true impacts. In fact, if you choose one single metric to be your key metric, then no correction needed and no adjustment is applied to the p-value for that metric. This gives that metric the maximum sensitivity.
When applying key metrics, we recommend that you set the metric you are most hoping to change in your hypothesis to be a key metric for your feature flag. You may also want to set a handful of other metrics as key metrics in addition to this if you have multiple metrics that are particularly important to you for that test. The more metrics there are in each set (key or supporting), the stricter the adjustment that is applied.
This means if you alter which metrics are set as key or supporting metrics during your experiment, it is possible your statistical results may change. For example, a metric might be inconclusive in a group of 10 other supporting metrics, but change to statistically significant when added as a sole key metric.
Metrics which we don’t compute statistical significance for, e.g., metrics with very low sample sizes, do not influence the correction which is applied.
We only apply the correction once for all supporting metrics. When you search and filter supporting metrics using the search box, your statistical results don't change.
How this affects your results
If you have your statistical settings set to apply multiple comparison corrections, they will be applied to all results of all of your tests by default. We will adjust the p-value for you, and in the Metric Details and Trends view the p-value shown will already have been adjusted to account for the multiple comparison correction.
We also adjust the error margins and confidence intervals of your results to be consistent with the correction applied to your p-values. These are shown as the impact lies between and metric lies between values. Rather than using the default 95% confidence to calculate these ranges, we will show the range that is calculated with a higher level of confidence. This can vary with each test as it is influenced by how many metrics are significant.
How this affects power analysis and recommended run time
The sample size and sensitivity calculators use power analysis techniques to recommend how long to run your experiments. It is difficult to account for multiple comparison corrections in these calculators, as the level of adjustment that is applied to your results is dependent on the results themselves and can’t be known in advance.
However, in the case when you have only one key metric set, these calculators are valid and highly recommended to help decide in advance how long your test should run. When you have multiple key metrics set, these calculators may underestimate the sample size needed. We recommend you use these as a guideline for the lower limit of the sample size and run time that is needed.