Custom Dashboards
Dashboards is a Harness Platform Feature, that allows you to visualize key metrics and data related to your module. You can customize the dashboards to show specific metrics and data relevant to your needs, and access them from a central location. The Harness Dashboards provide actionable insights out of your IDP, so you can enable good developer experience in your org. Dashboards also allow you to set up scheduled delivery of reporting and alerts for your executives and stakeholders.
- You can create custom dashboards at the account scope only.
- Make sure you have the
Managepermissions for Dashboards to create, edit, and delete custom dashboards. - Make sure you have the
Viewpermissions for Dashboards to view the custom dashboards.
Navigate to dashboards
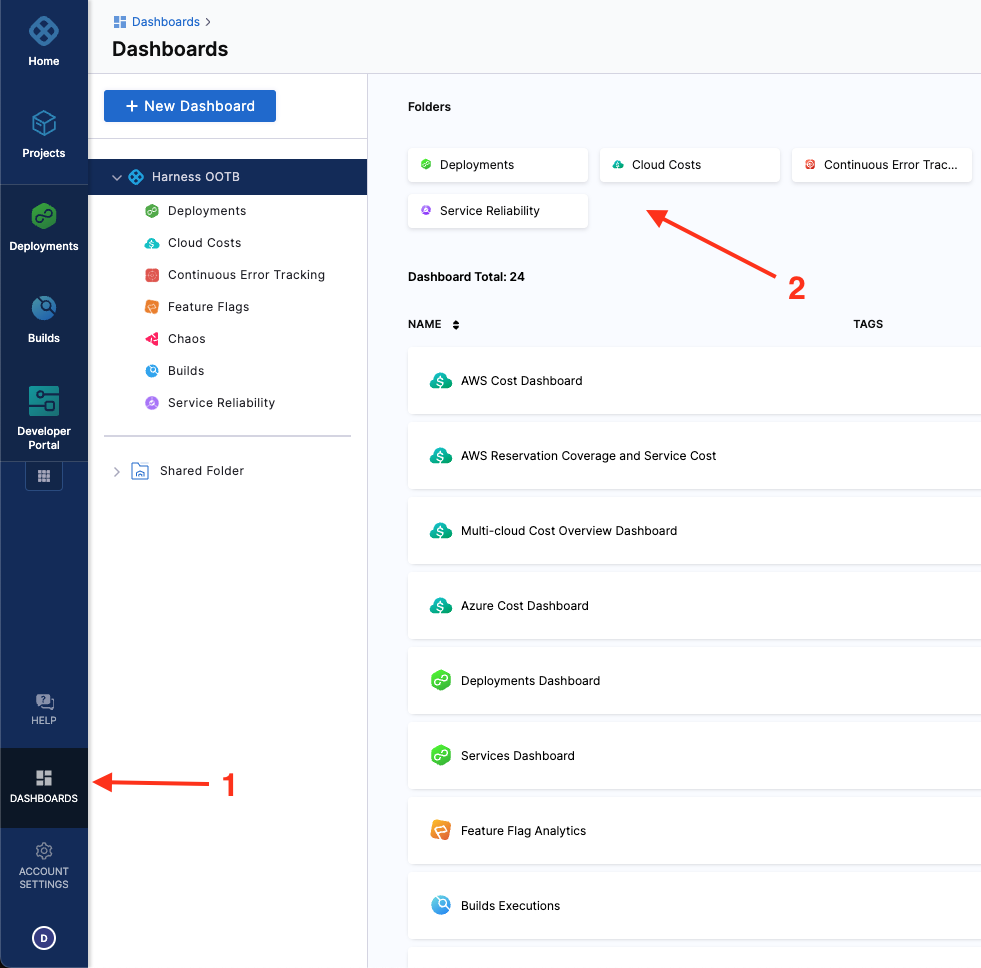
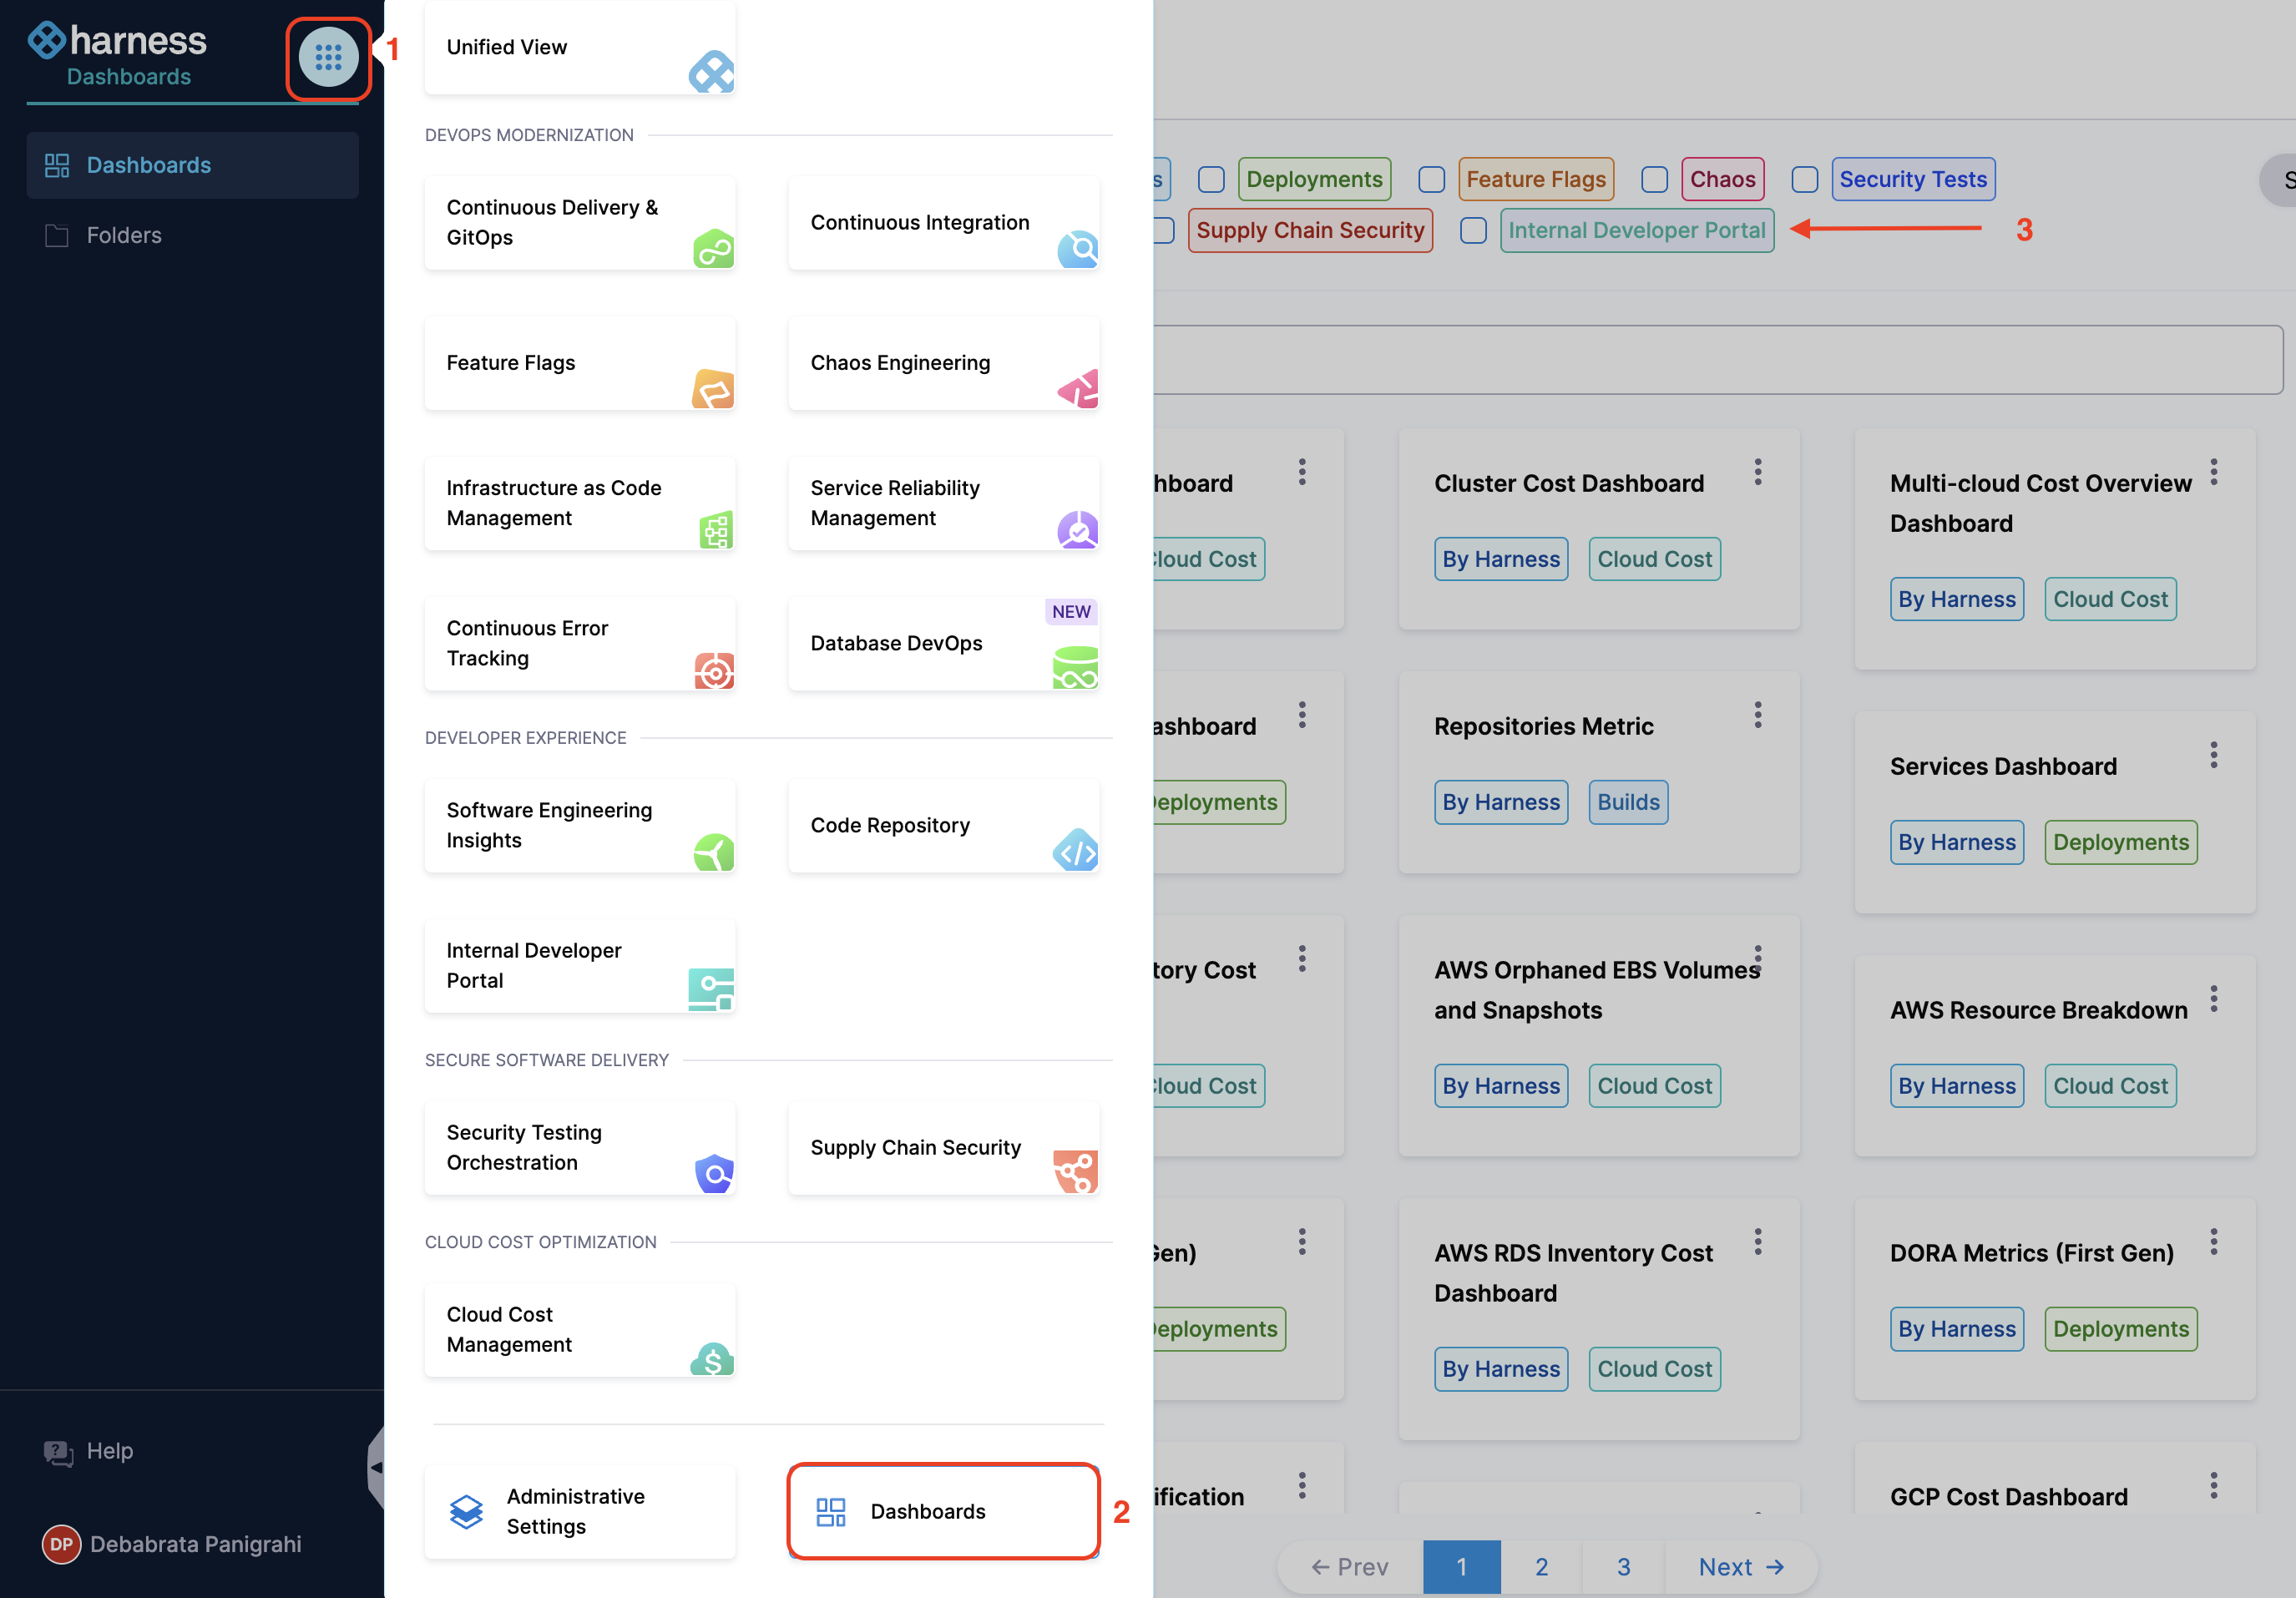
To view and access dashboards, select DASHBOARDS from the left navigation in your Harness account. You can filter the data on the dashboards for IDP module by selecting the module name from the top of the page.
Old left nav
New left nav
Out of the box dashboards
At present, we provide 3 out of the box dashboards for IDP.
- Adoption Dashboard: Track how Developers are using IDP, you get to know active users during the selected Aggregation Period along with insights on each of the key features
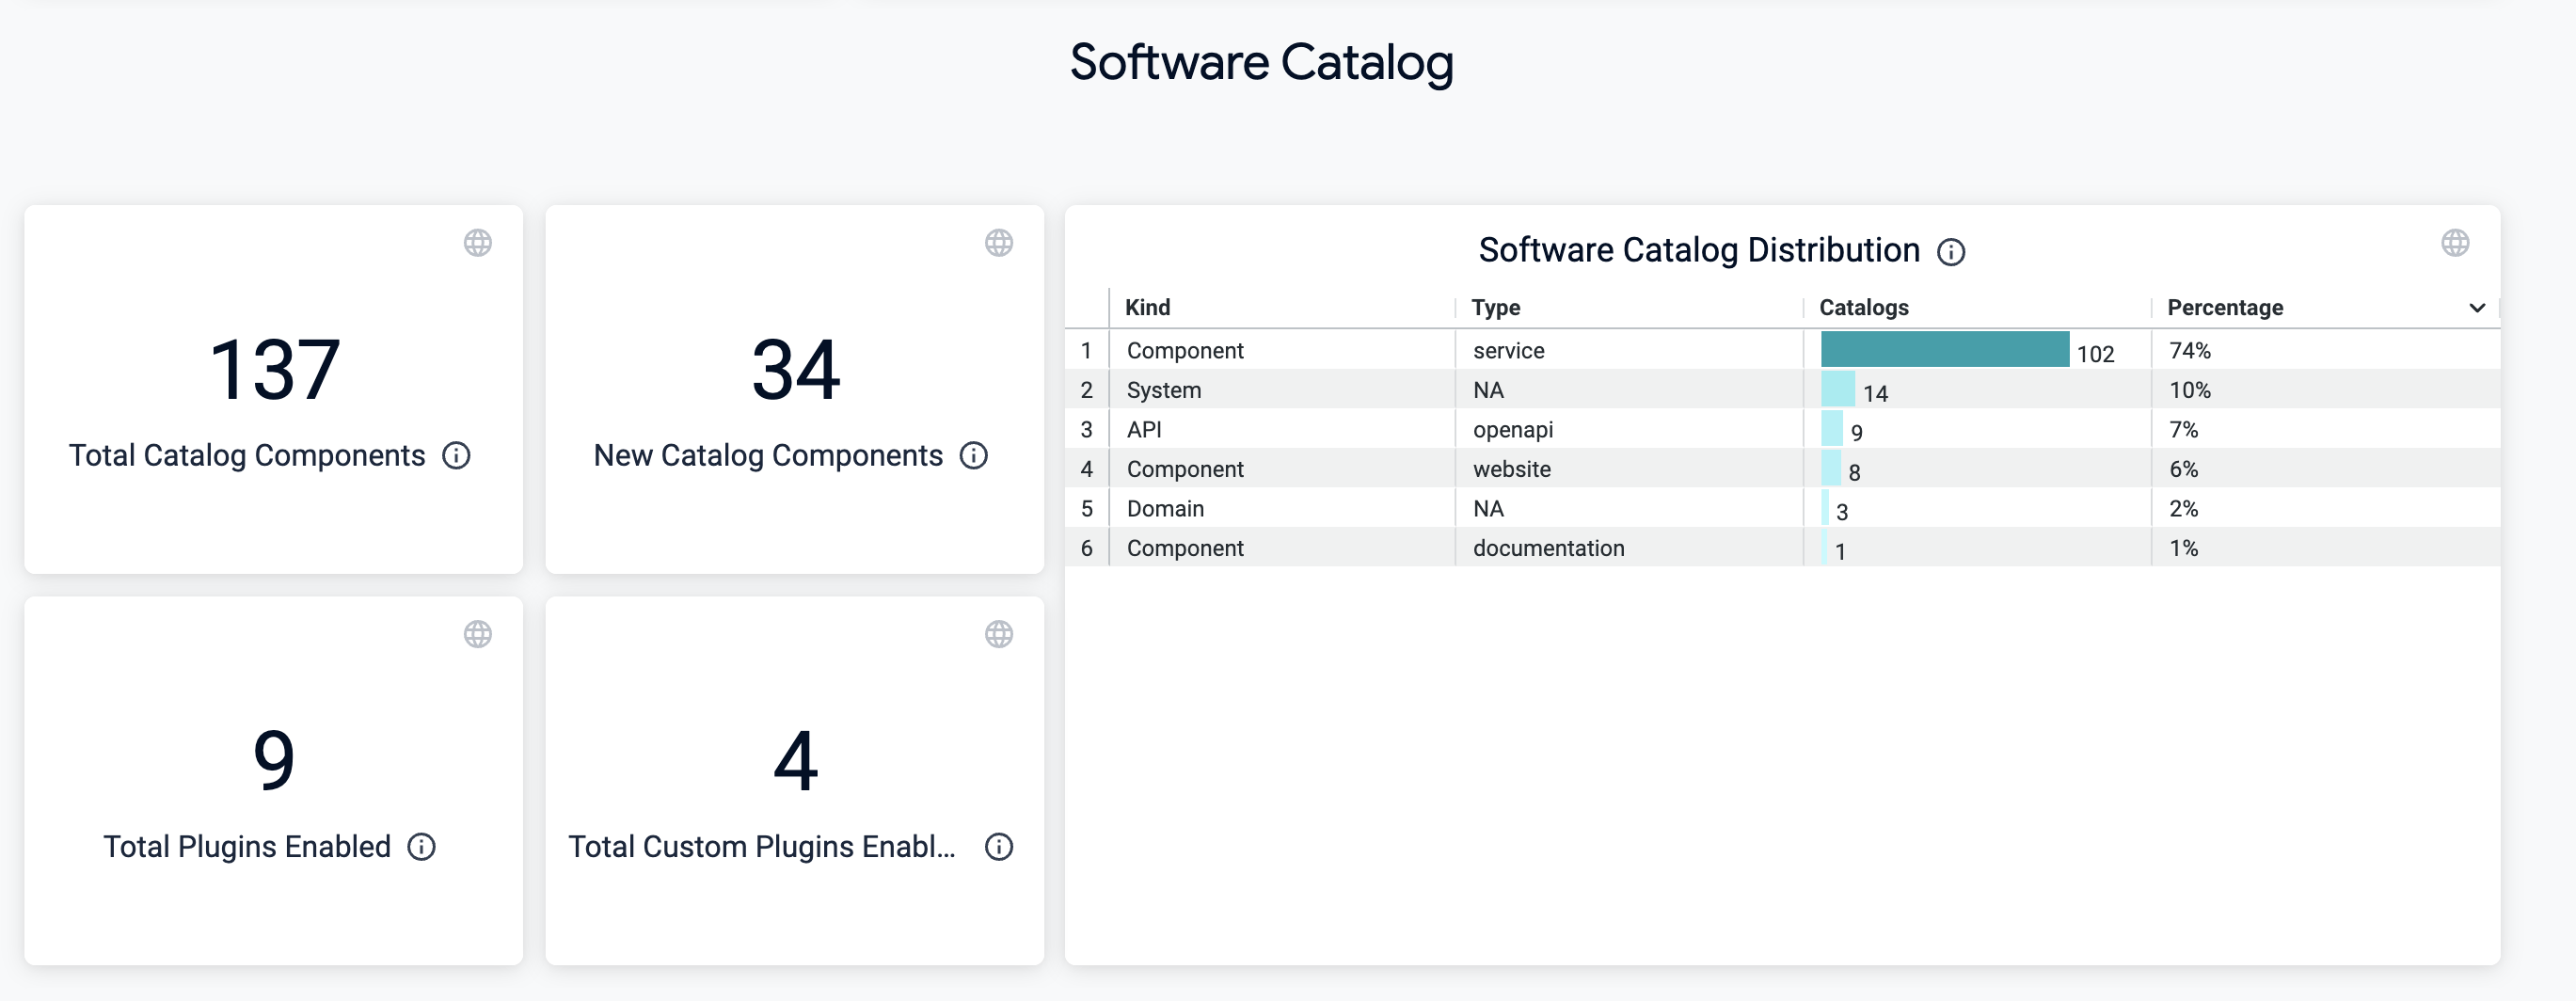
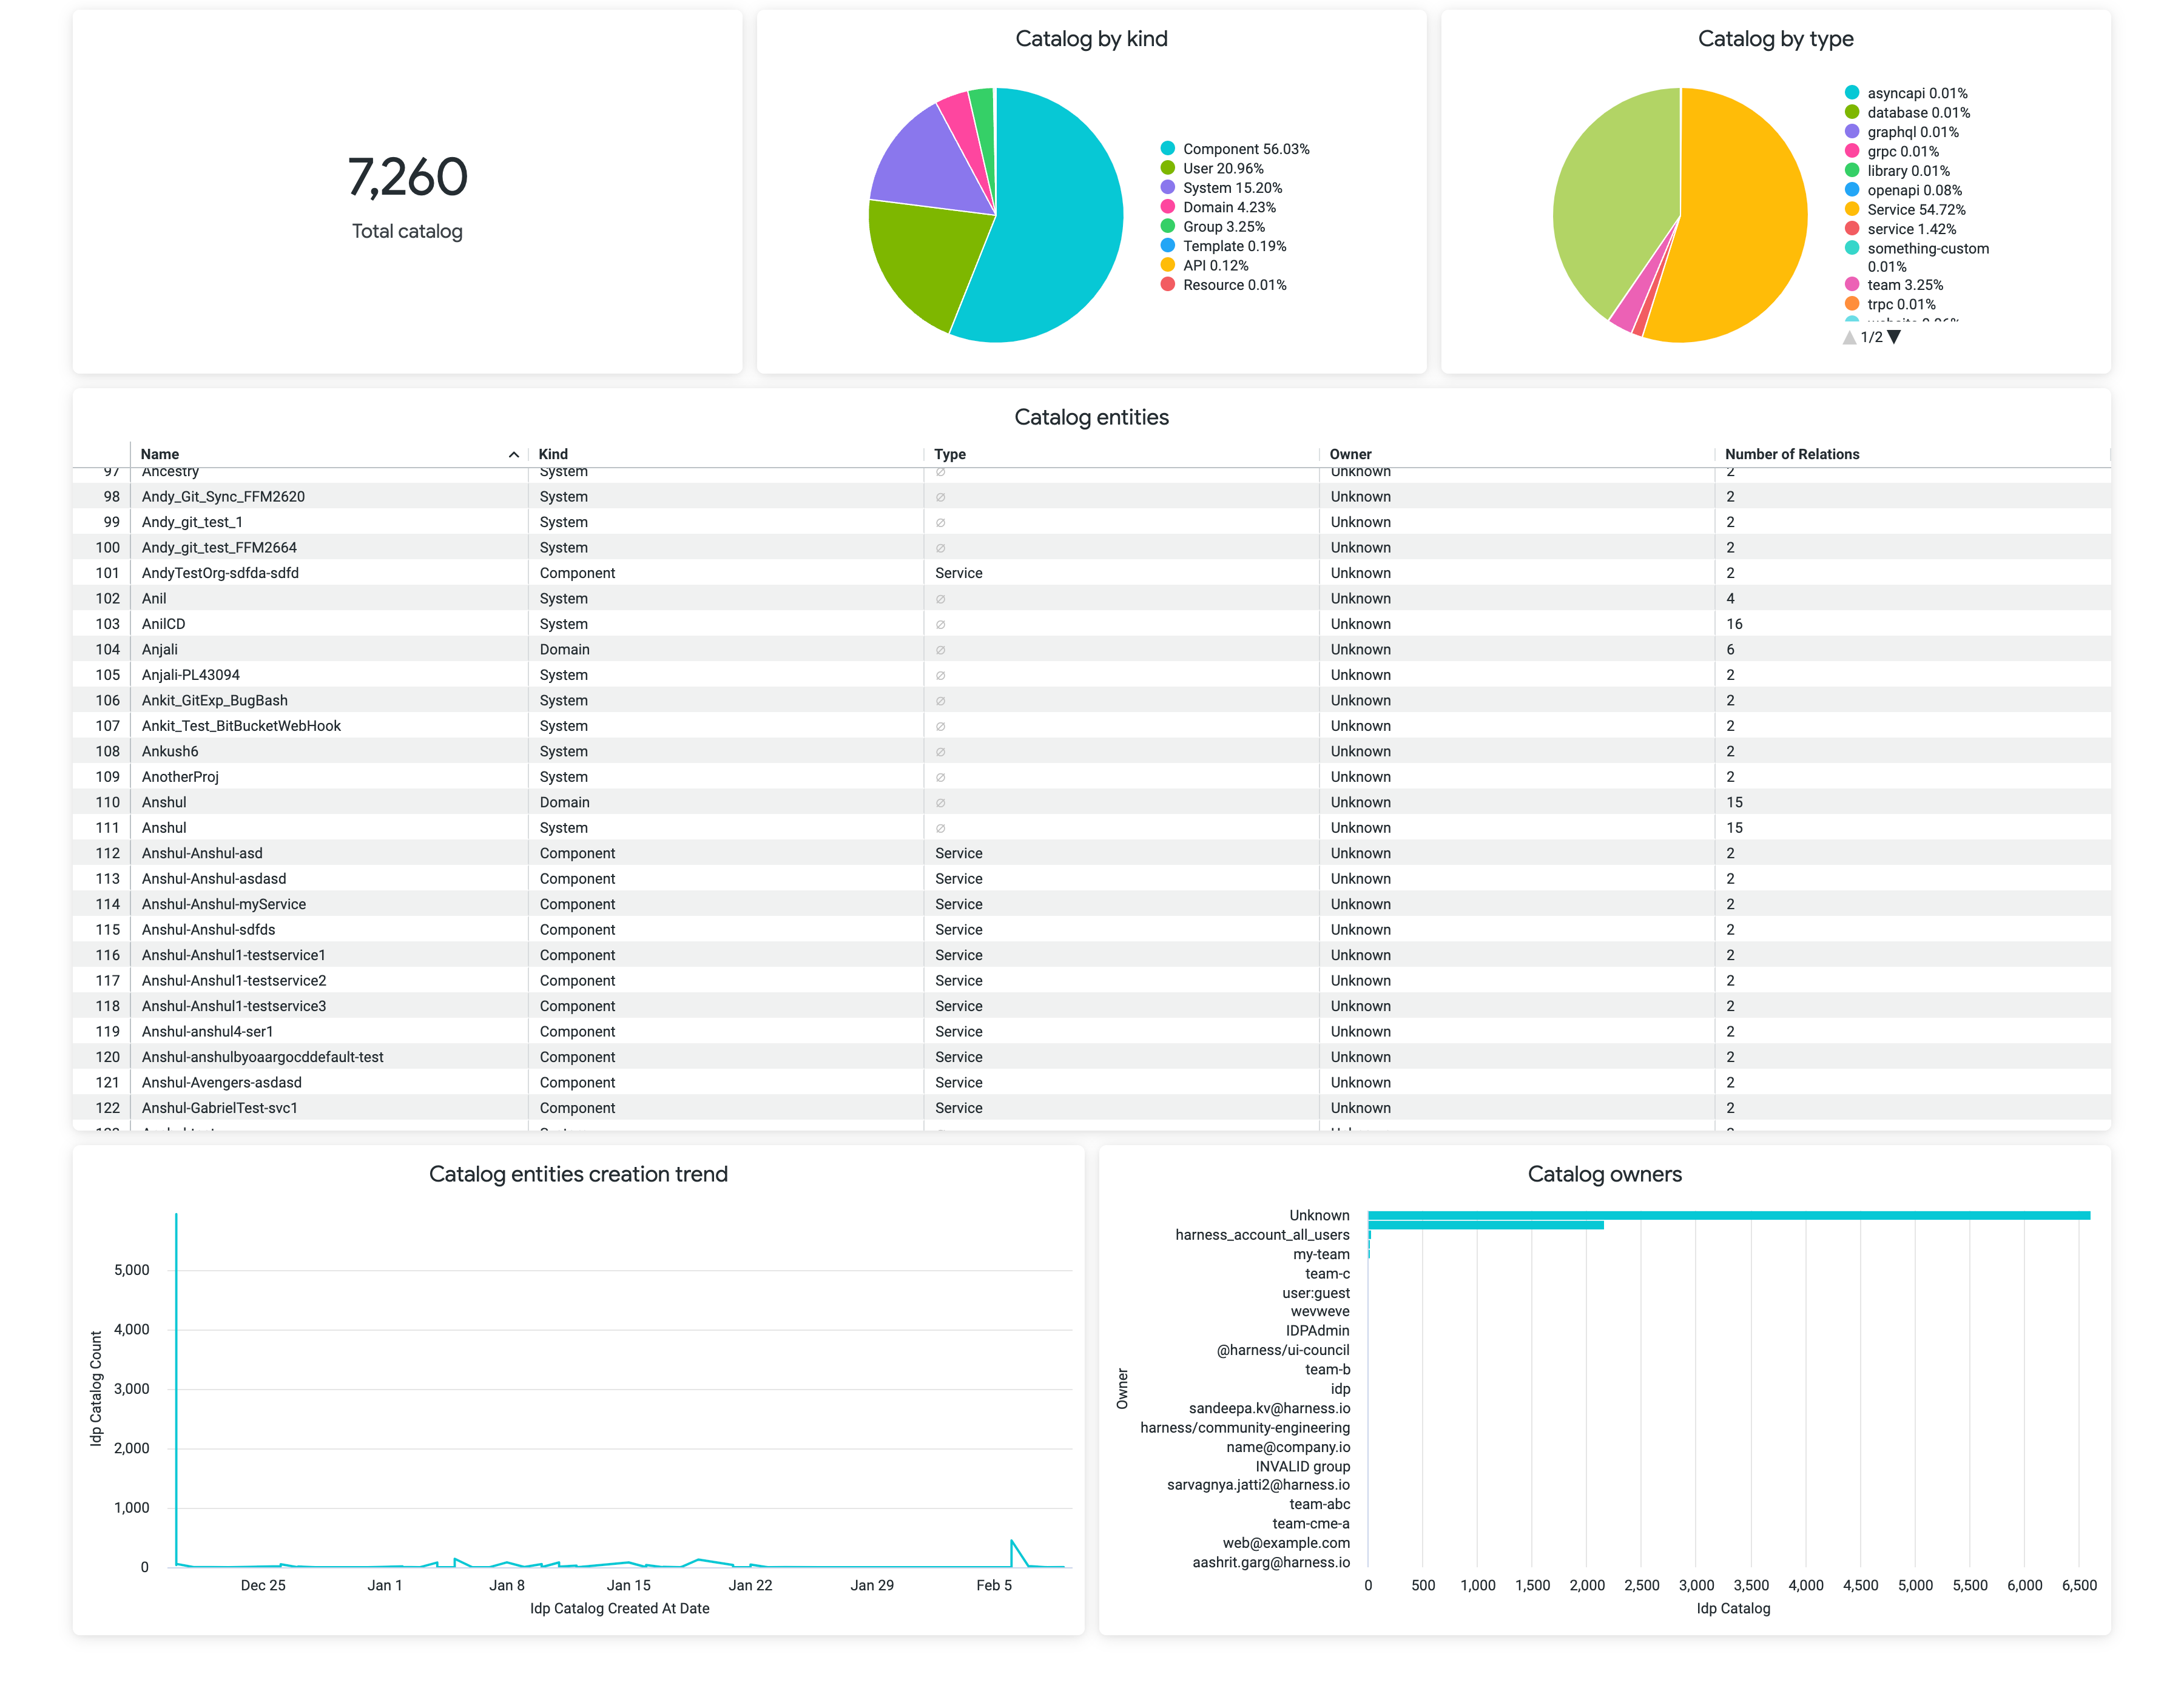
- Software Catalog
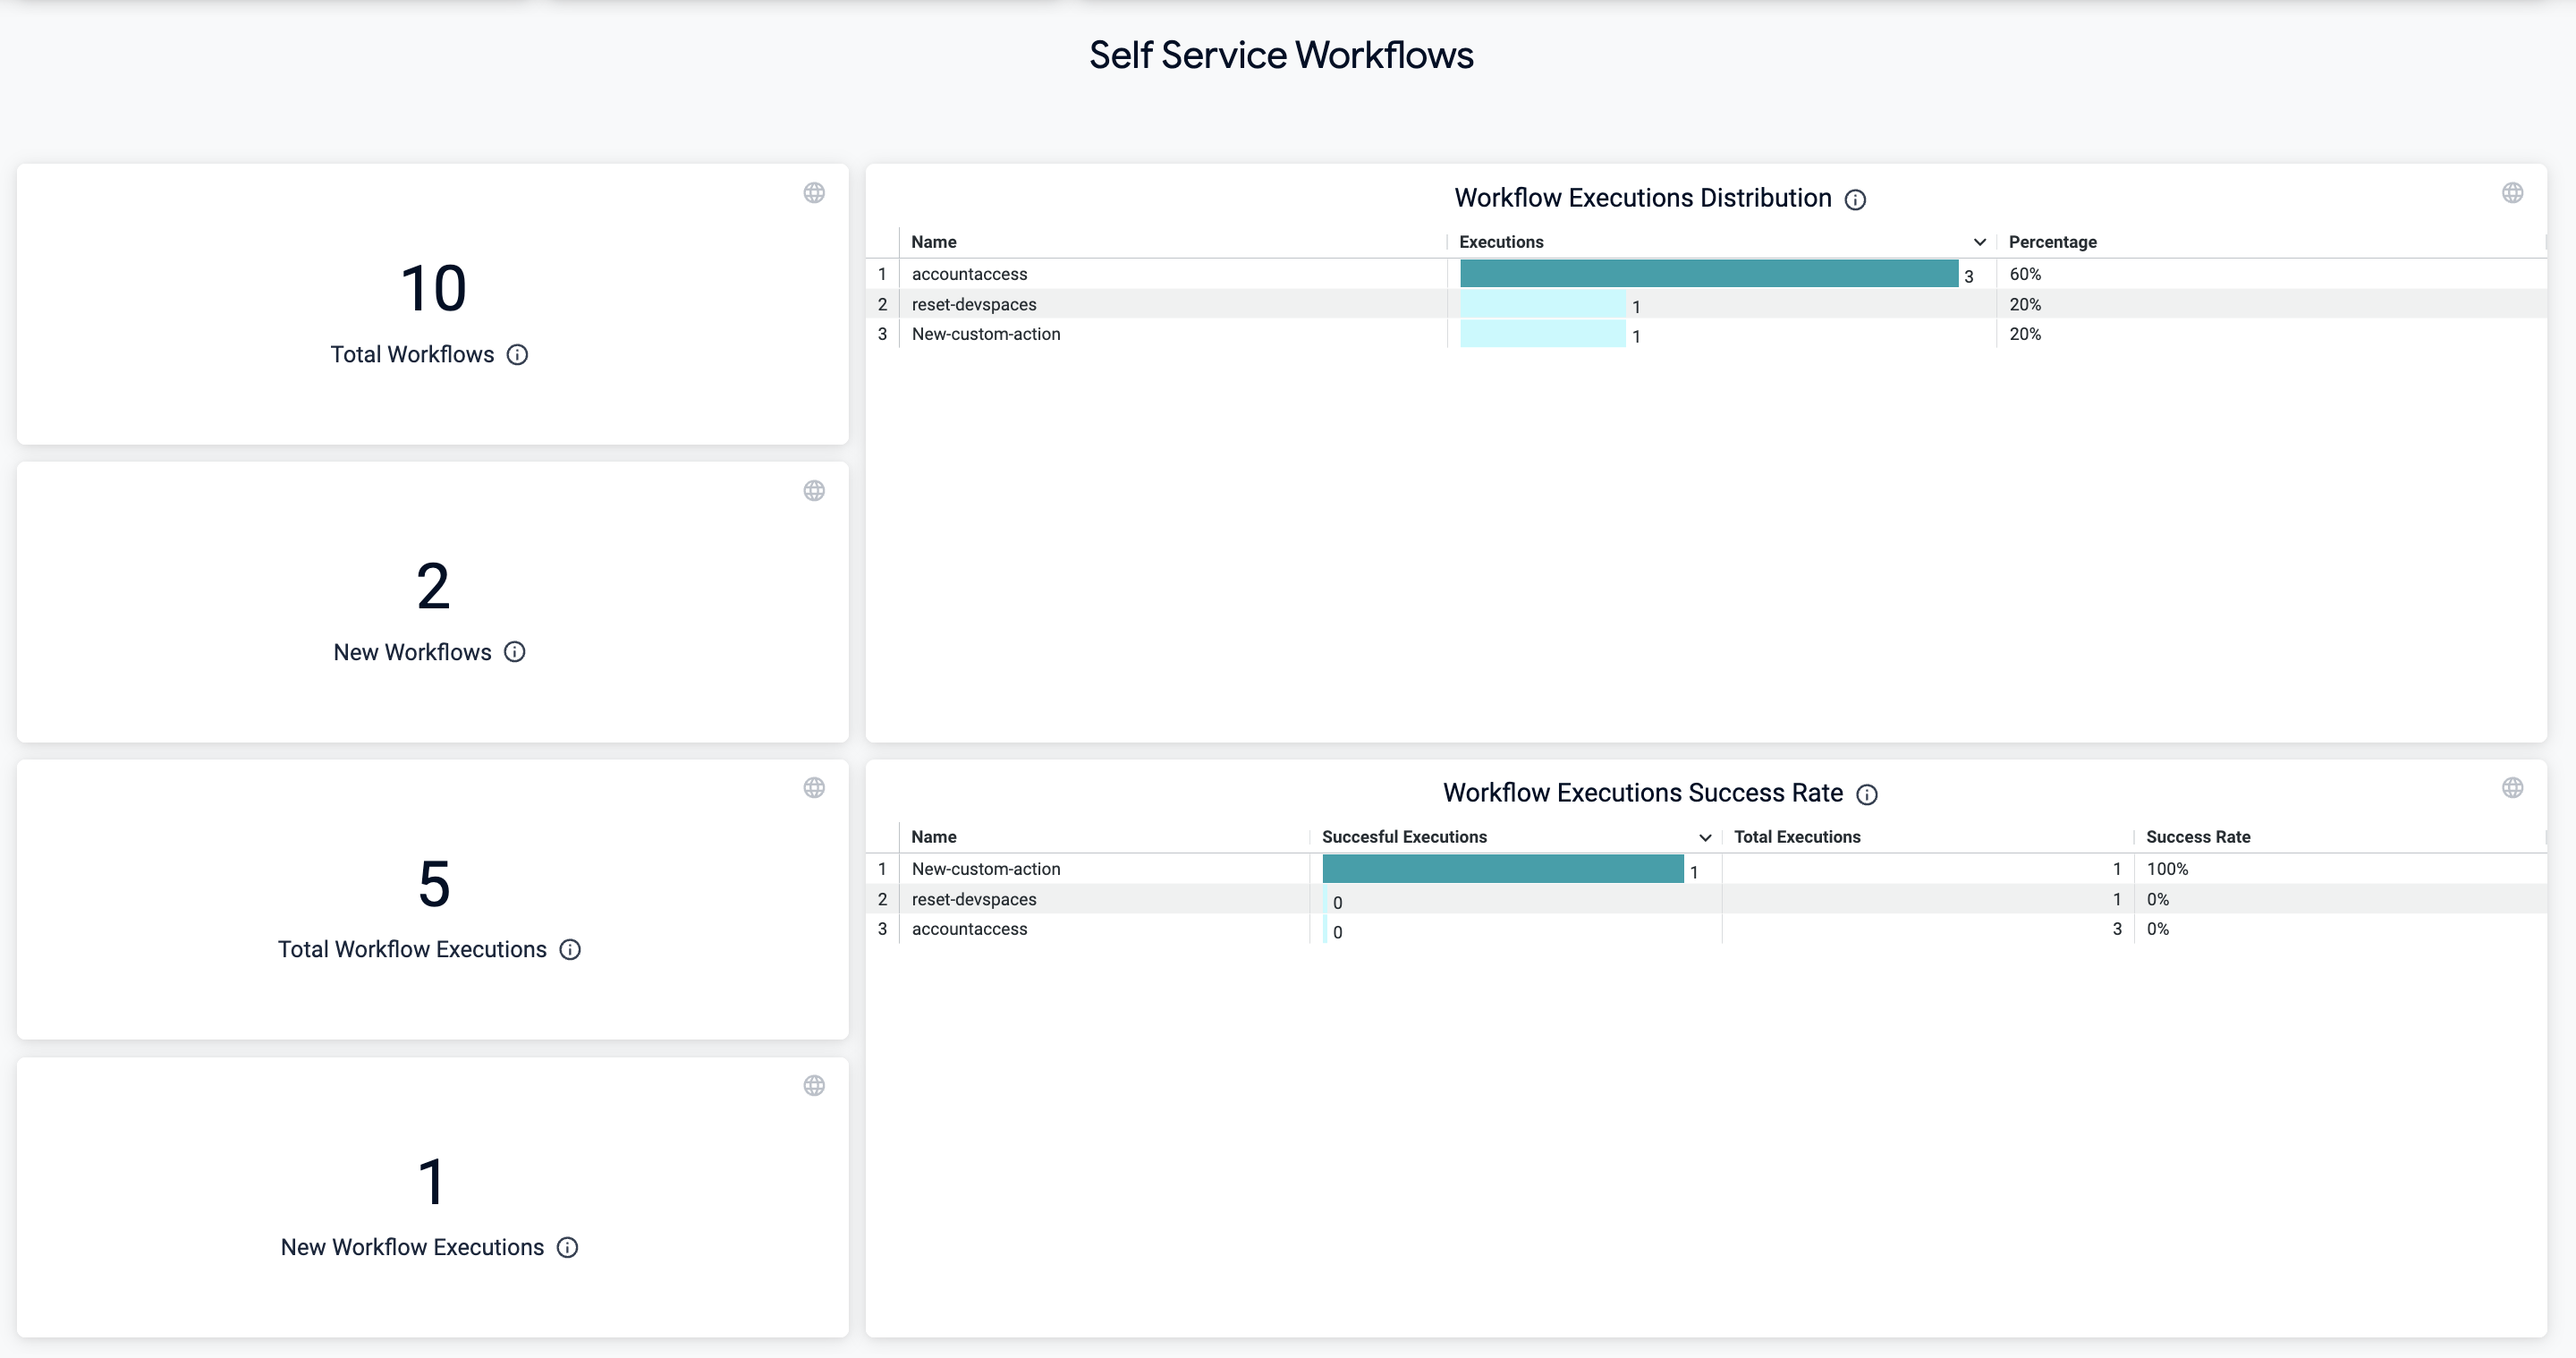
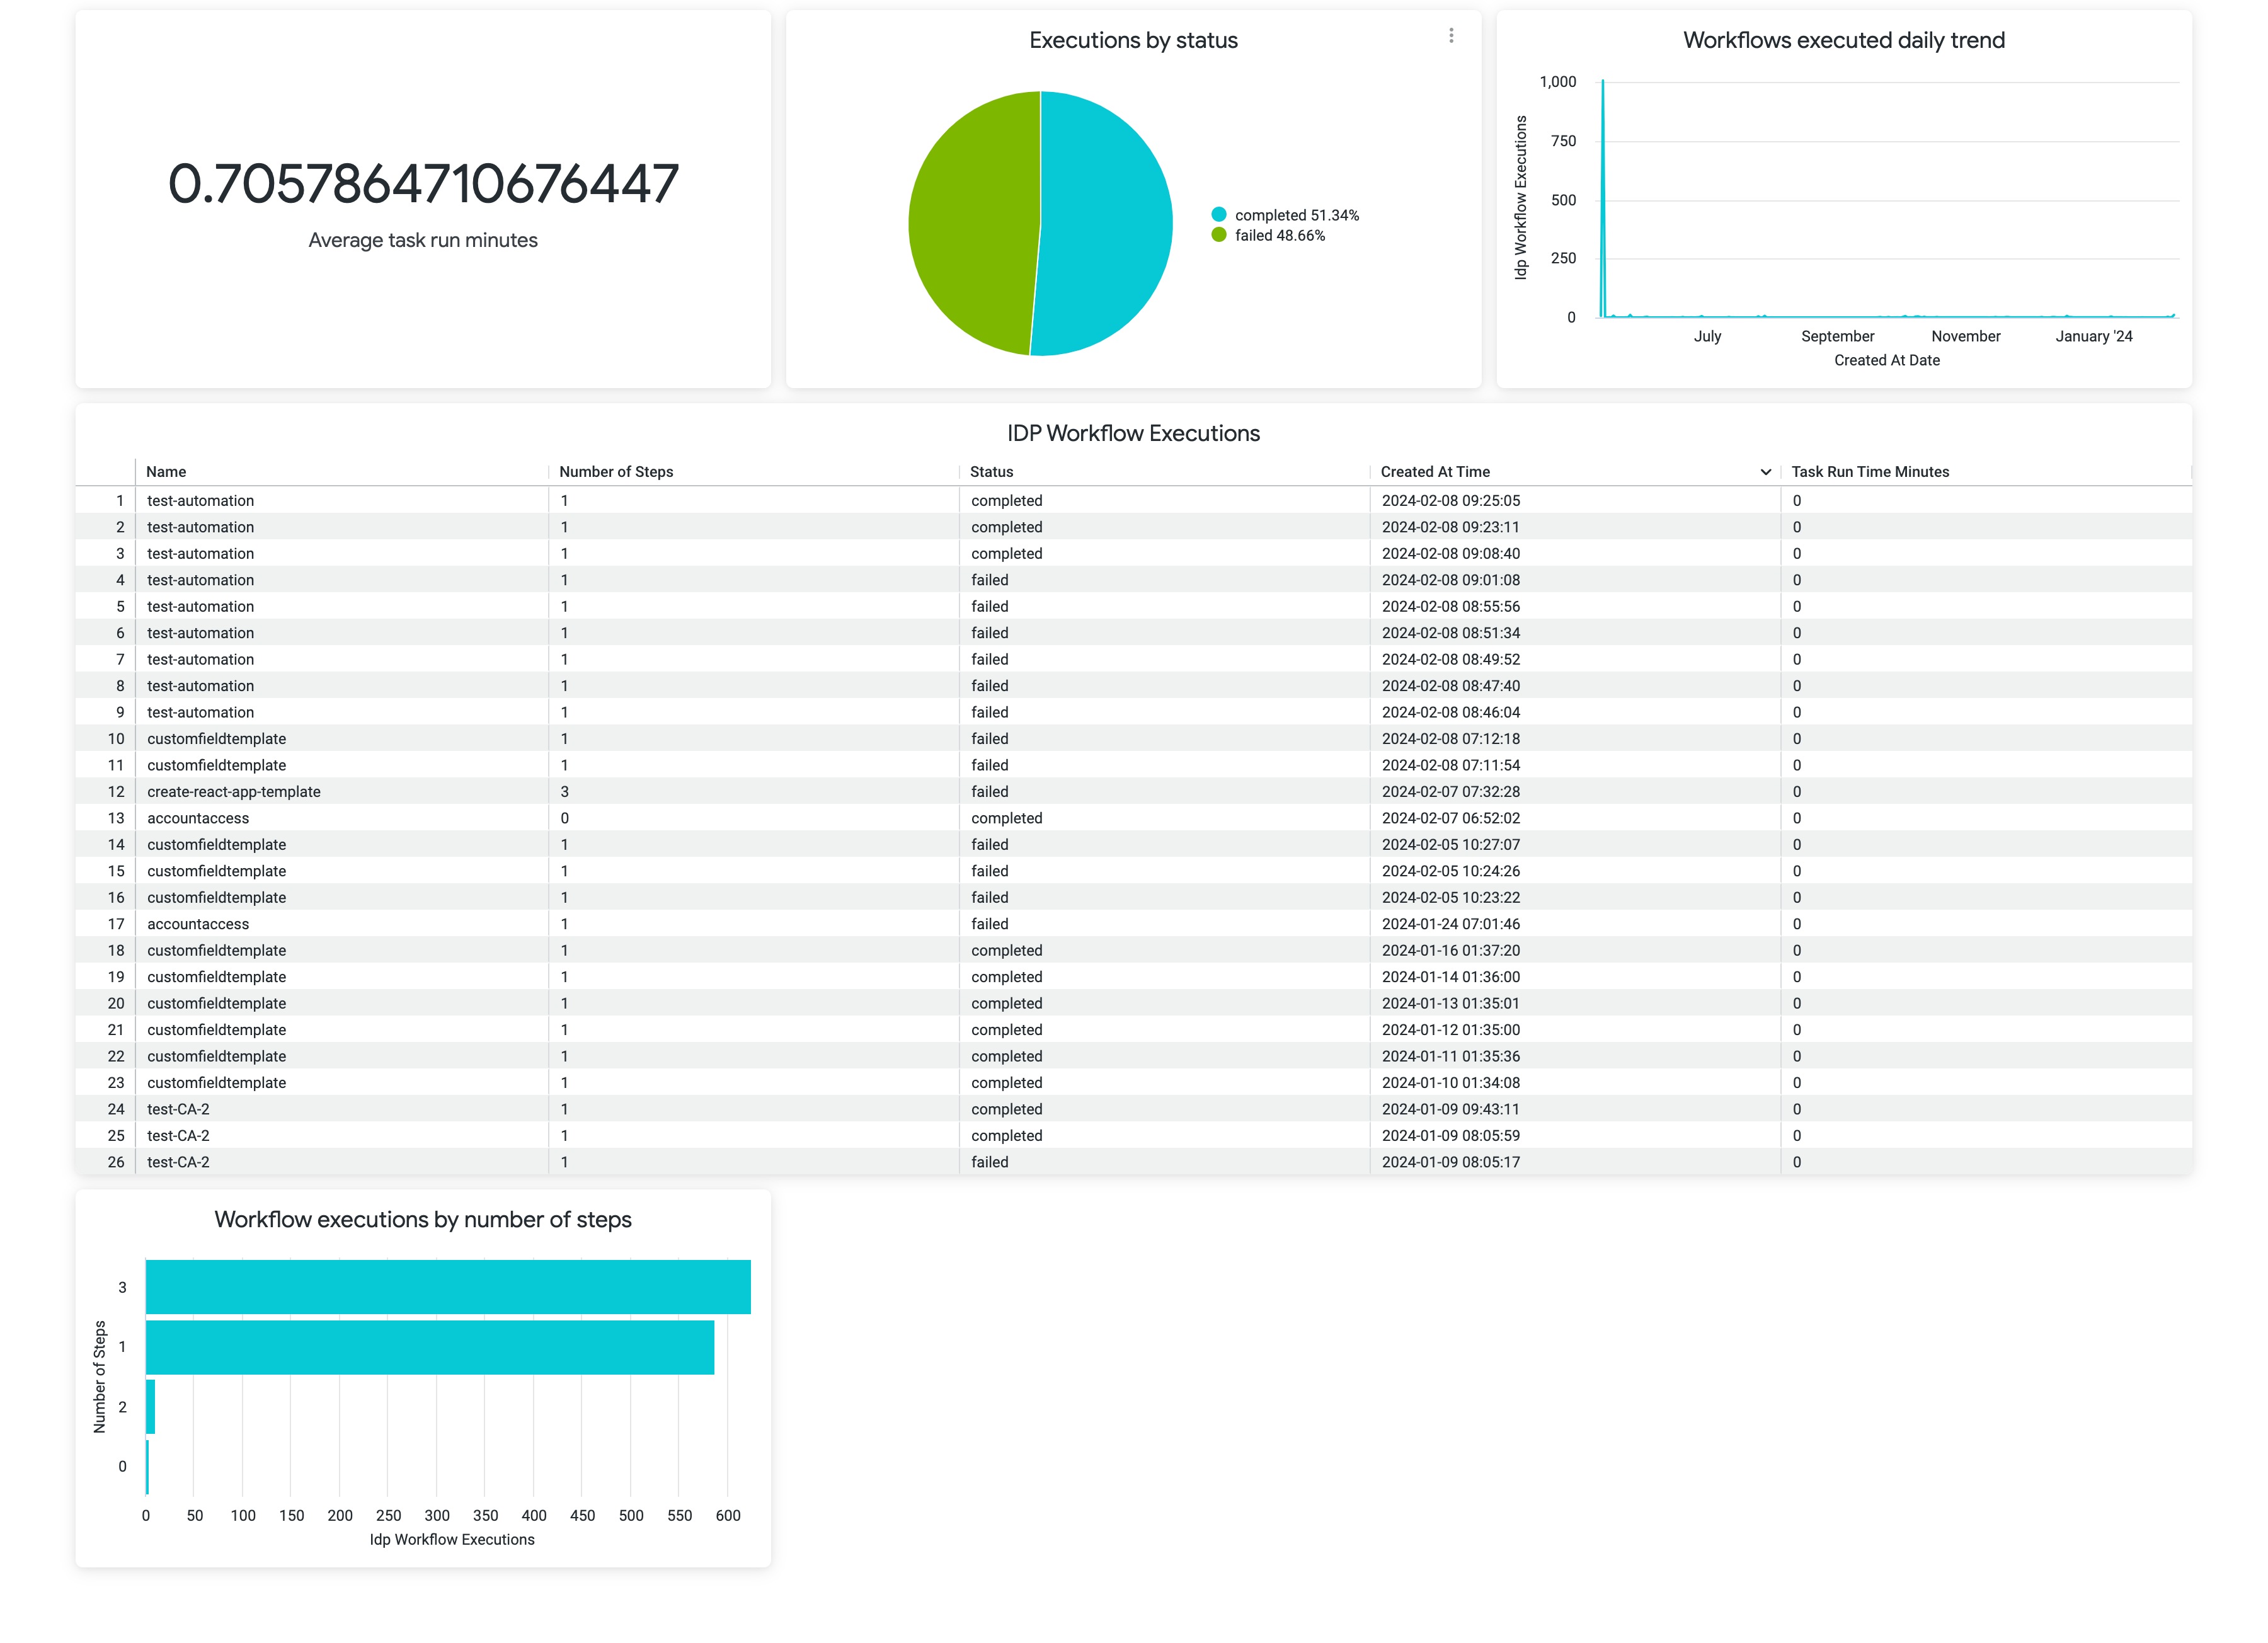
- Self Service Workflows
- Scorecards
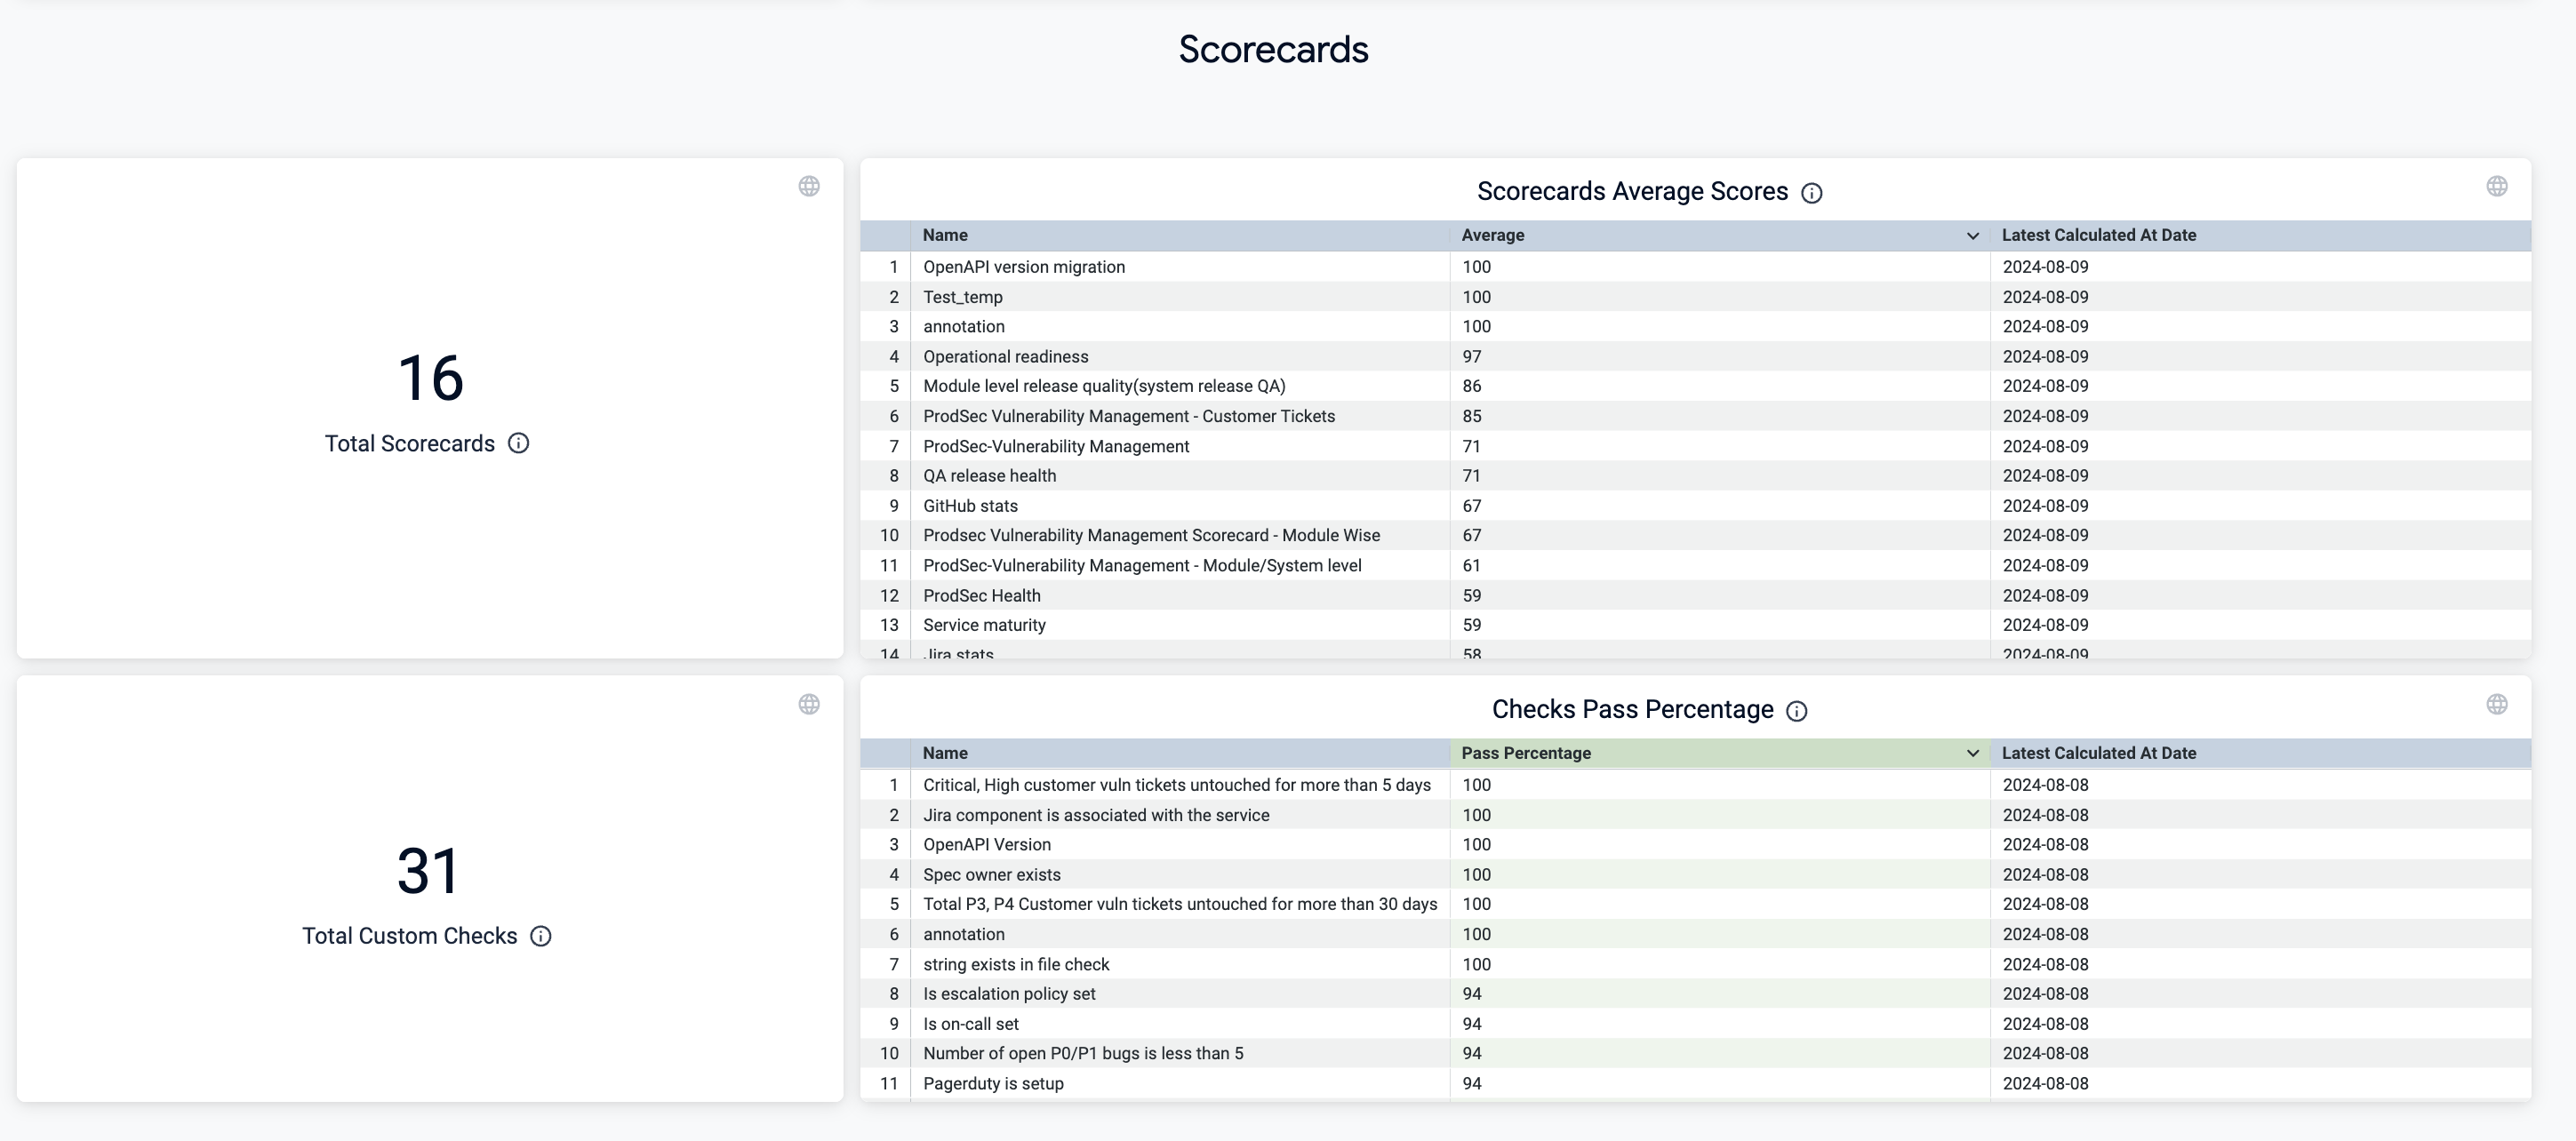
- Dashboard describing the state of catalog, which includes, Number of registered entities, catalog kind and type.
- Dashboard describing the Workflow Execution details
Create dashboard
It is recommended to refer this documentation first to get a basic overview on how to create dashboards.
Explore
An Explore is a starting point for a query that is designed to explore a particular subject area. This topic describes the various explores available for monitoring your developer portal, and the data to provide. The following is list of explores available for visualizing IDP data.
- IDP Catalog
- IDP Plugins
- IDP Workflow Executions
Follow this documentation to create visualizations and graphs
Dashboard best practices
Follow this documentation to know more.