View personalized status page
The Harness custom status portal displays real-time operational status, incidents, and maintenance windows for the modules enabled in your account. Unlike generic status pages that show all services, your custom status portal filters information to show only what matters to your organization.
The status portal uses optimized data fetching to provide near real-time updates while minimizing load times.
What will you learn in this topic?
By the end of this topic, you will be able to:
- Access your custom status portal from Harness UI.
- Understand different operational statuses.
- View module-specific incidents and subcomponents.
- Review incident timelines and postmortem reports.
- Review scheduled maintenance updates for your cluster and modules.
Before you begin
Before you access your personalized status portal, ensure you have the following:
- Harness account access: An active Harness account with at least one module enabled. Go to Get started with Harness Platform to set up your account.
- Module licenses: At least one Harness module license, such as CI, CD, or CCM. The status portal automatically detects enabled modules.
Access the status portal
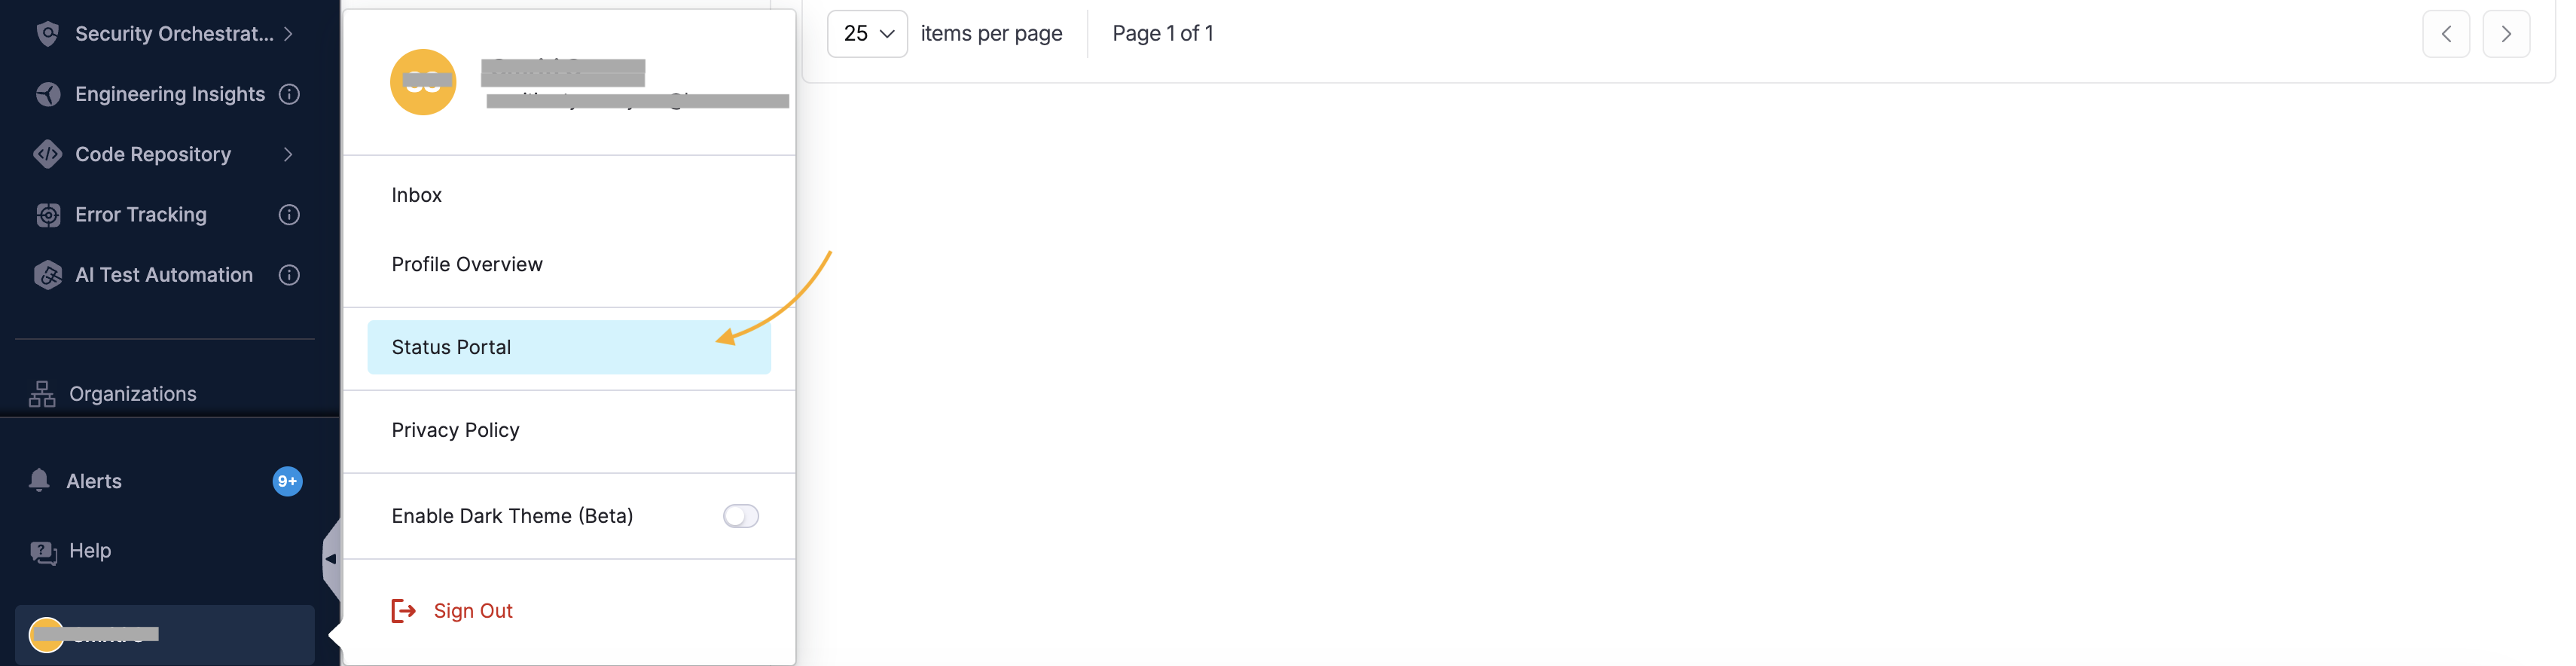
The status portal opens and displays the current operational status of your enabled modules. To access the status portal:
-
Hover over your profile icon at the bottom of the navigation bar.

-
Select Status Portal.
Status portal layout
The status portal consists of four main sections accessible via tabs: Overview, Products, Incidents, and Maintenance.
Overview tab
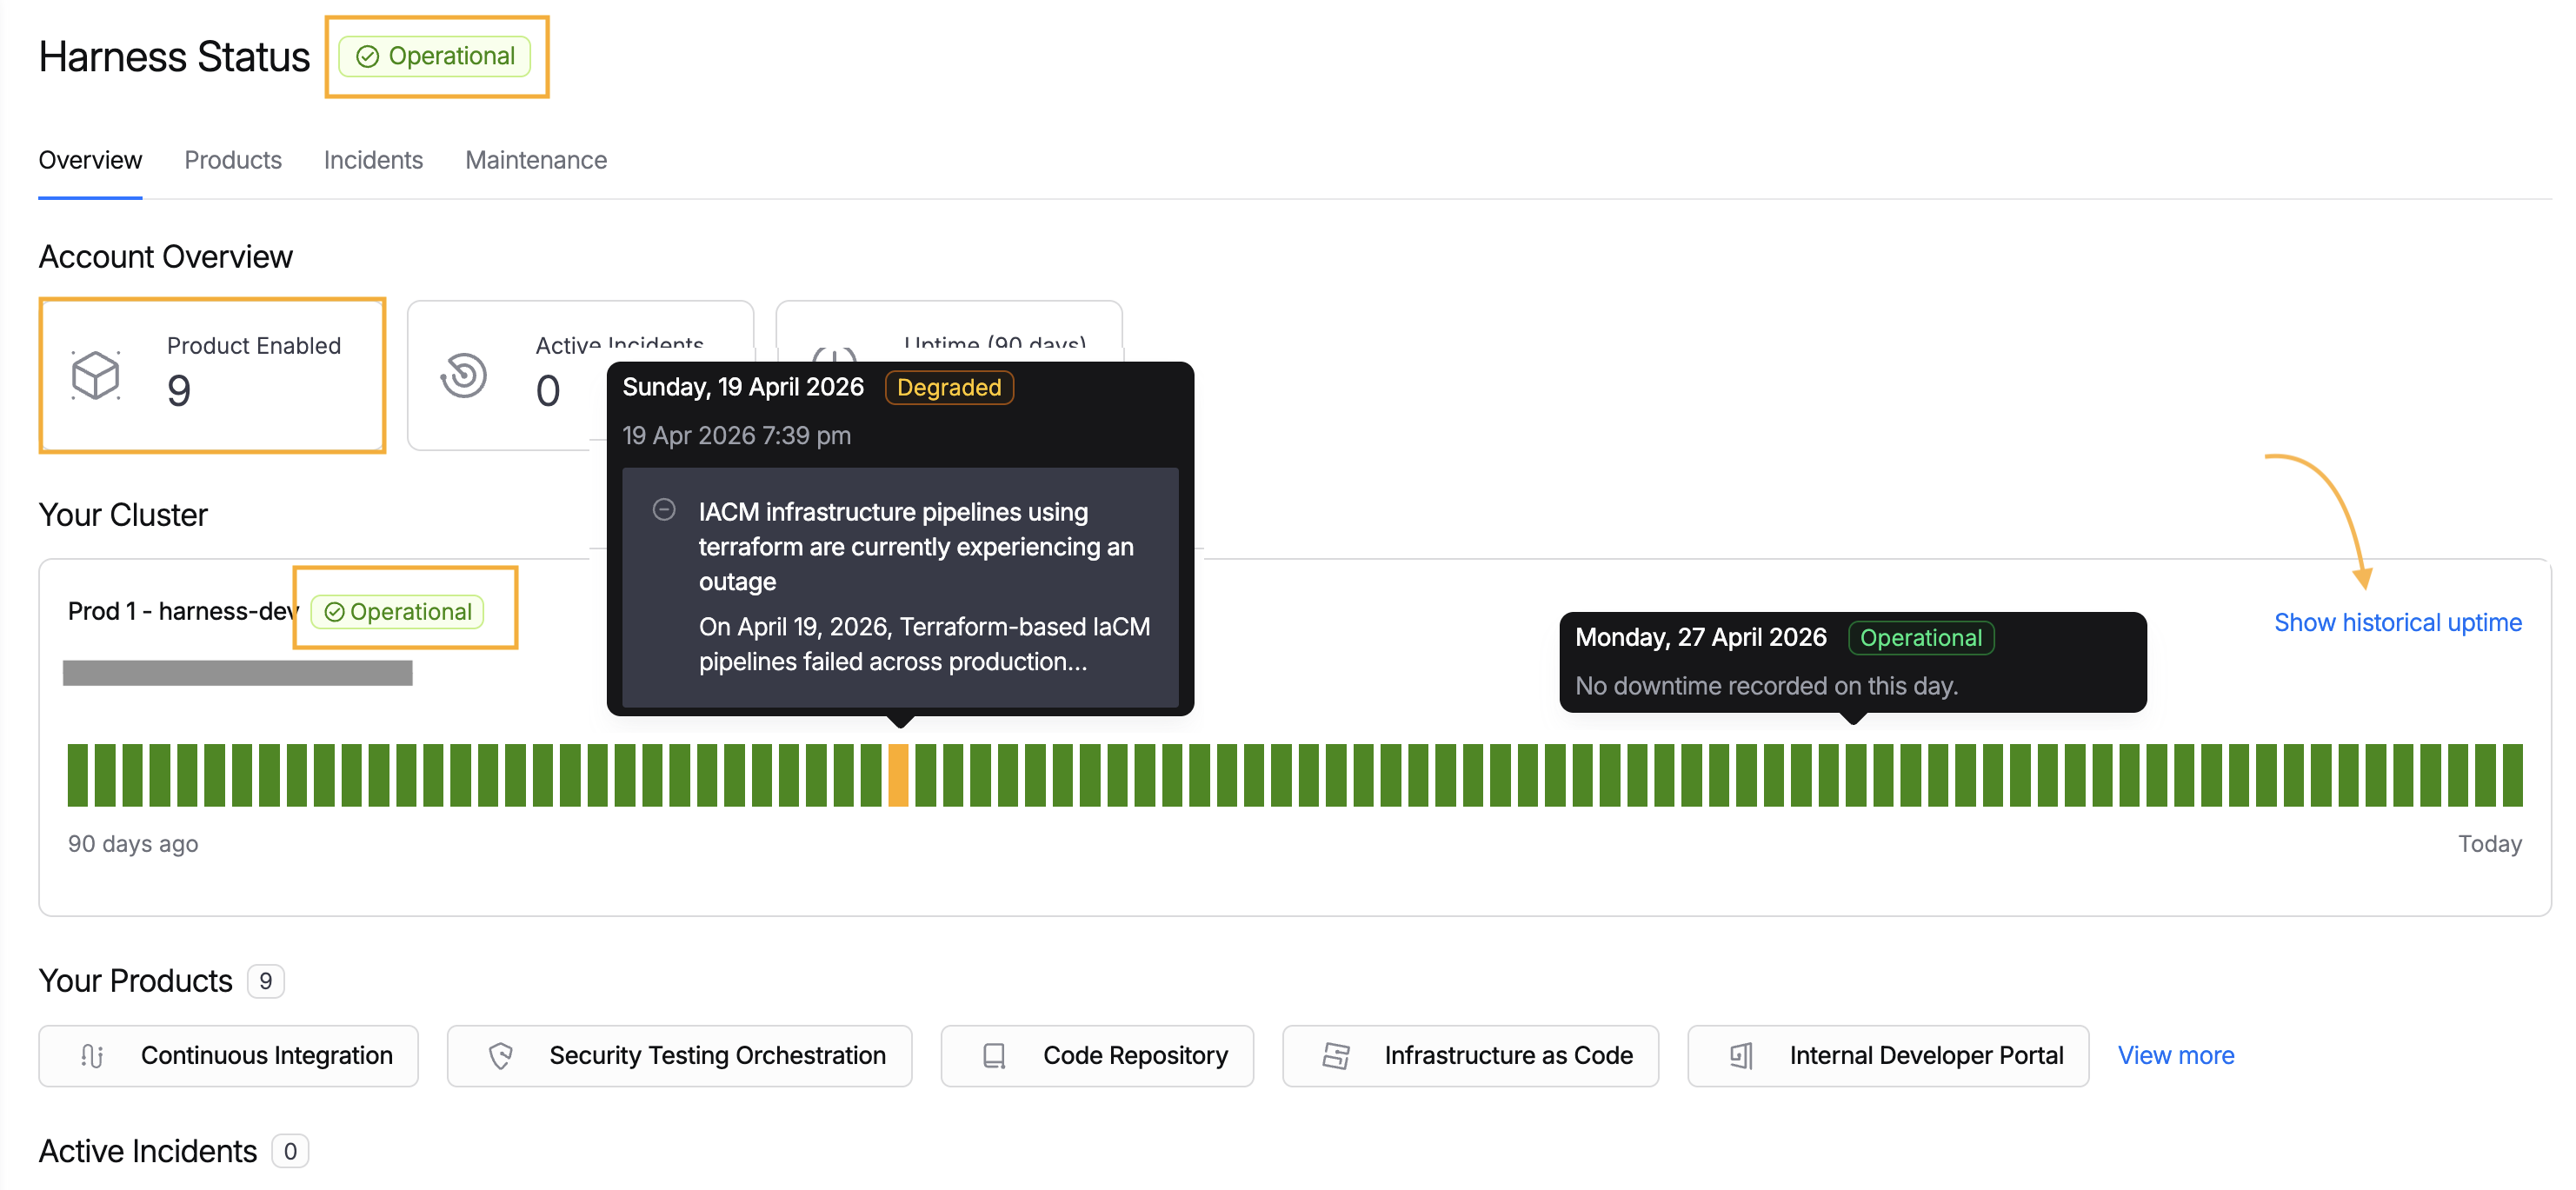
The Overview tab provides a high-level summary of your system health.
Status indicator: The portal header displays the current operational state:
- Operational: All enabled modules are functioning normally.
- Major Outage: Critical services are down.
Hover over any day in the uptime bar to view incident details for that date. Only incidents that exceed a specific duration threshold appear in the uptime visualization.

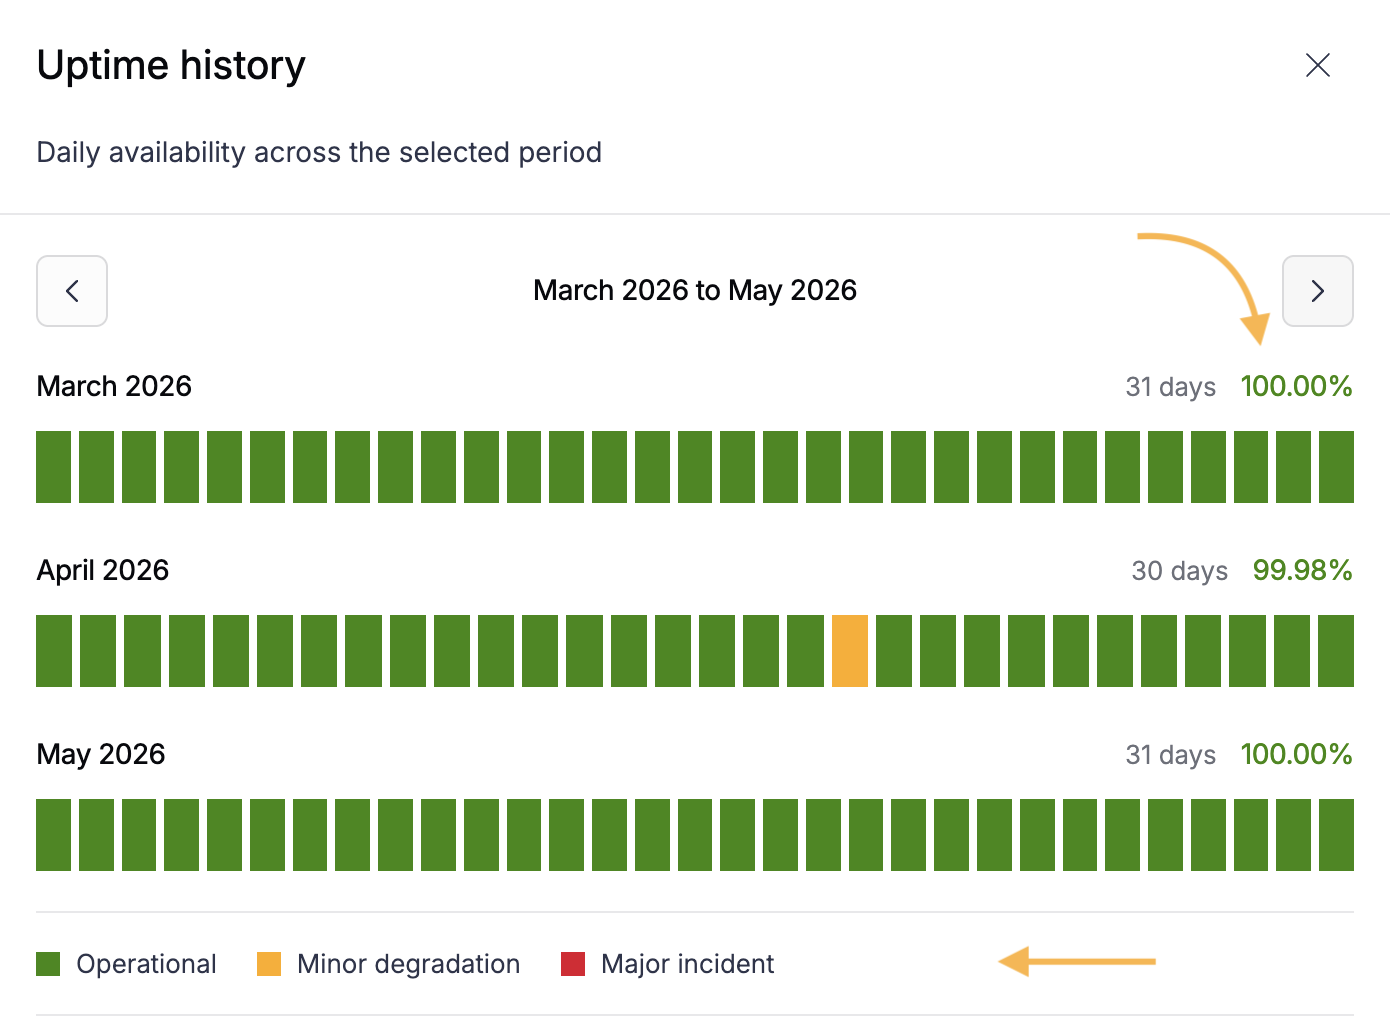
Uptime bar: A 90-day uptime visualization displays service availability. Green sections indicate operational days, while colored markers show incidents. The uptime percentage is calculated based only on your enabled modules.
Product Enabled: The portal displays the count of enabled modules and shows tiles for the top five modules. Platform and Custom Dashboards modules are always included by default because they are present in all Harness accounts.
Active Incidents: If any incidents are currently affecting your services, they appear in this section with the incident title, affected module, status, and reported time.
View module-specific information
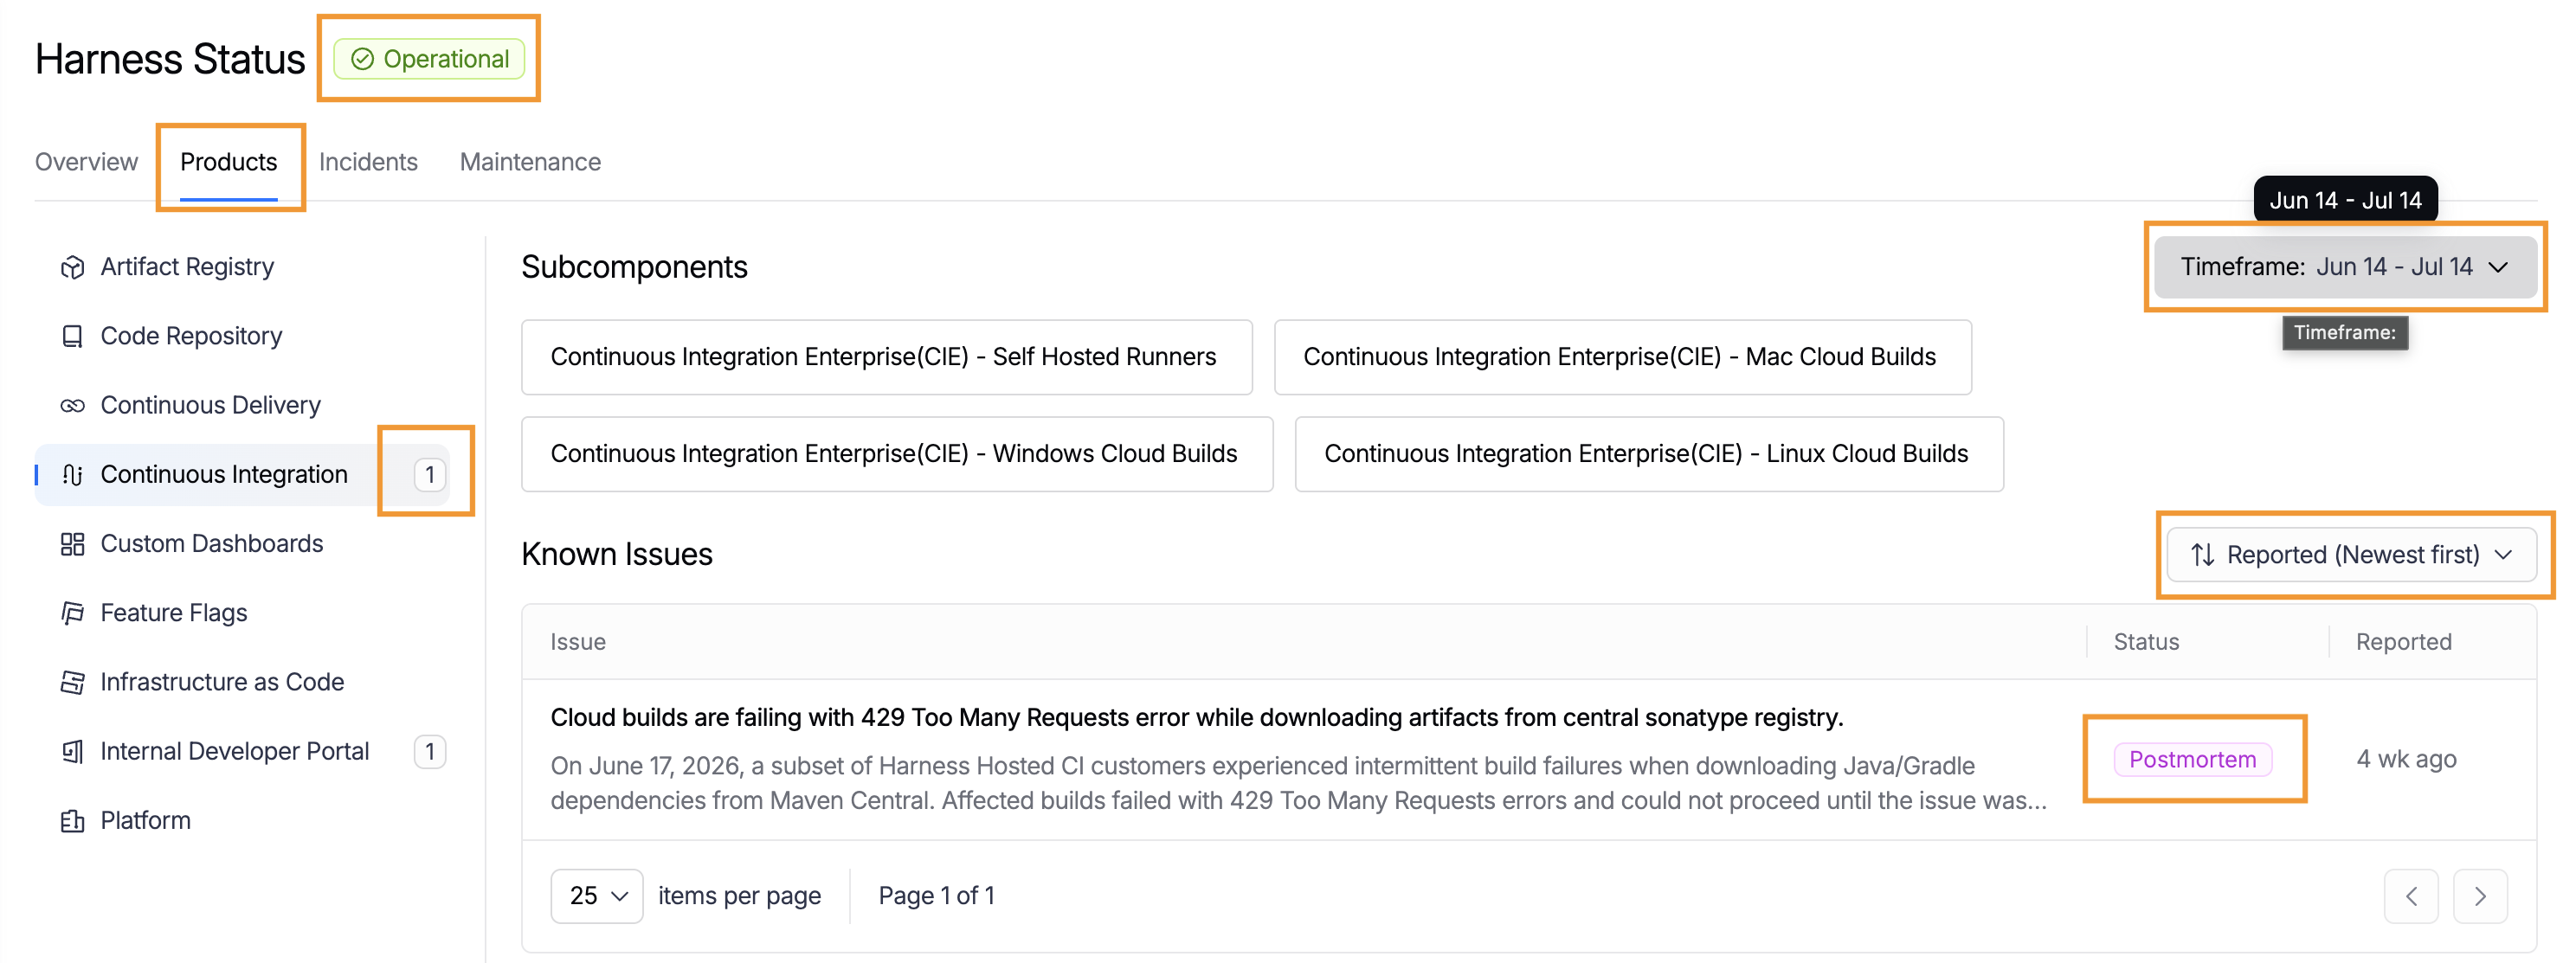
The Products tab organizes operational data by module.

- Select the Products tab.
- Select a time filter from the dropdown menu. The default time filter is 30 days. Select Select custom range to customize your filter.

-
Review the list of enabled modules. Each module tile displays the following:
- Module name: The Harness module (for example, Continuous Integration, Continuous Delivery).
- Subcomponents: Specific services within the module (for example, Self-Hosted Runners, Mac Cloud Builds, Windows Cloud Builds, Linux Cloud Builds for CI).
- Known Issues: The number of known issues or incidents that occurred in the selected time period.
- Operational status: Current health state of the module.
-
Select any module tile to expand details.
-
Select an issue title to view the incident timeline.
Module tiles in the Overview tab are clickable and navigate to the corresponding module in the Products tab when selected.
Review incident history
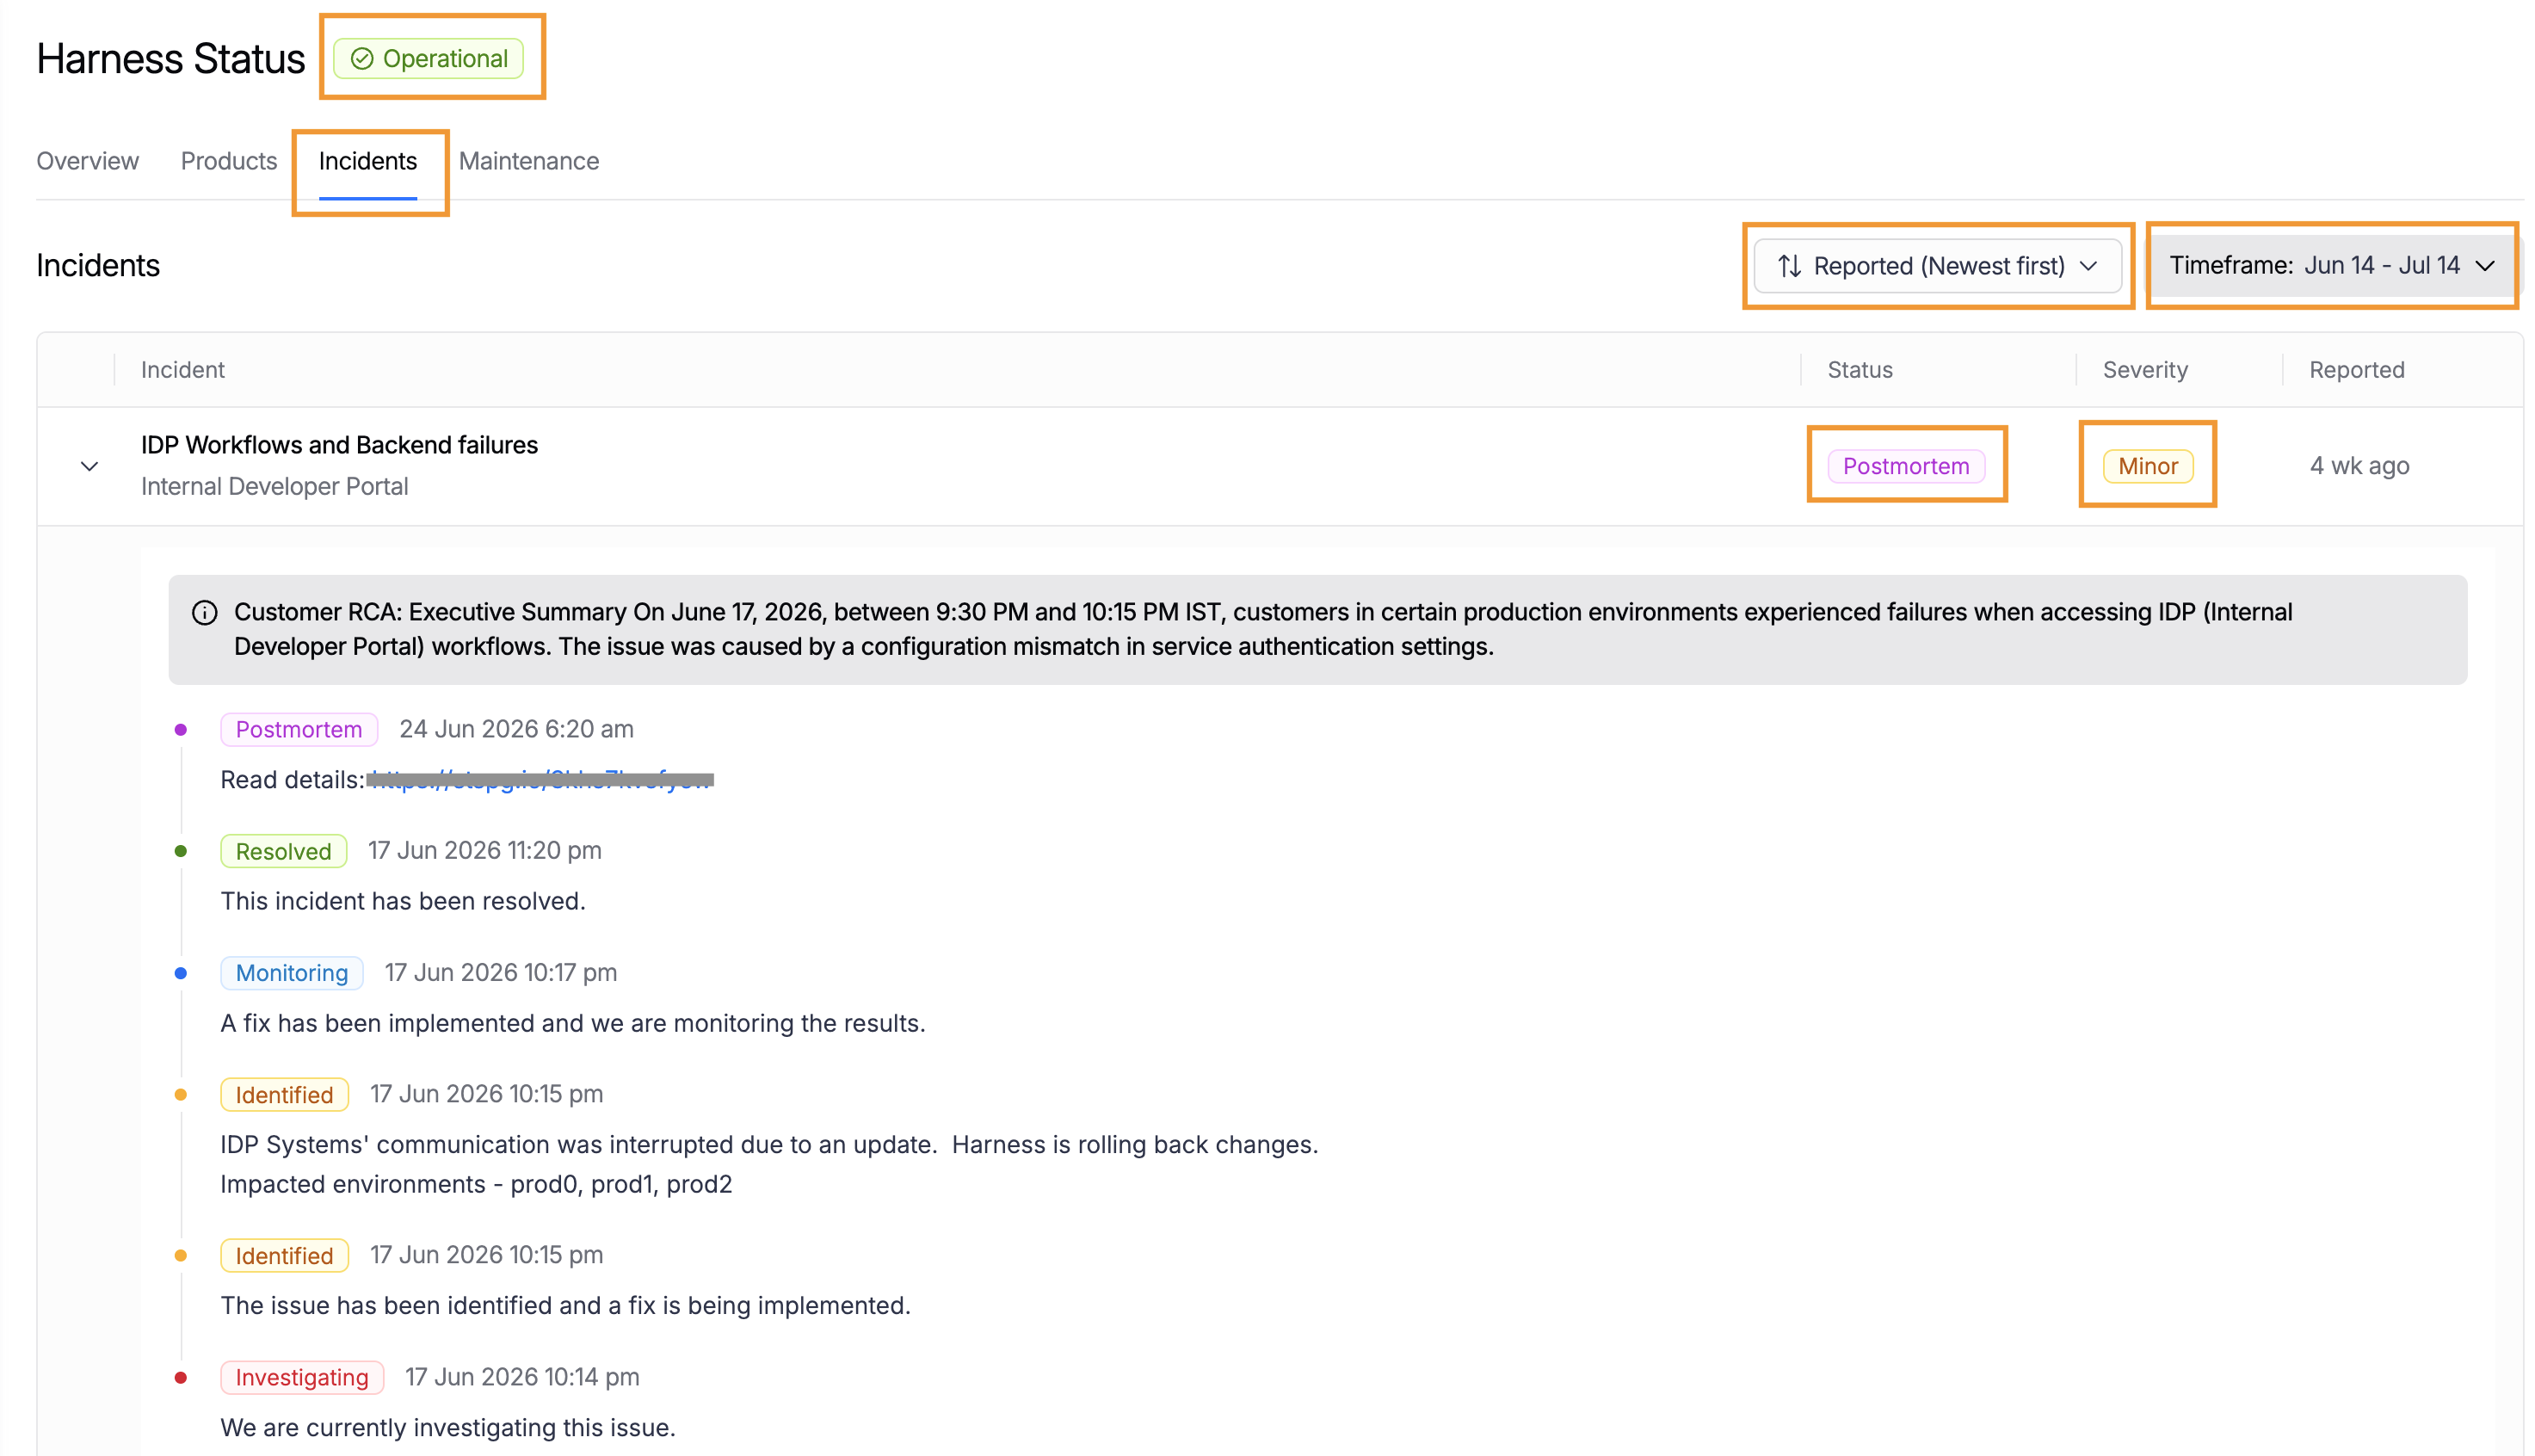
The Incidents tab provides detailed timelines for all service disruptions. If no incidents occurred in the selected time frame, the portal displays All systems are operational..
Each incident displays the affected module names below the title. If multiple modules are impacted, they appear as a comma-separated list.

-
Select the Incidents tab.
-
Apply time filters from the dropdown menu to narrow the view. The default time filter is 30 days. Use Select custom range to customize your filter. You can filter incidents based on their chronological order, status, severity, and order of reporting.
-
Select any incident to expand the timeline. The timeline shows all stages the incident passed through:
- Investigating: The issue is being diagnosed.
- Identified: The root cause is known.
- Monitoring: A fix is deployed and being observed.
- Resolved: The issue is confirmed fixed.
- Postmortem: A detailed analysis is available.
-
Follow the link under the Postmortem status for the incident to view the full incident report.
Track maintenance windows
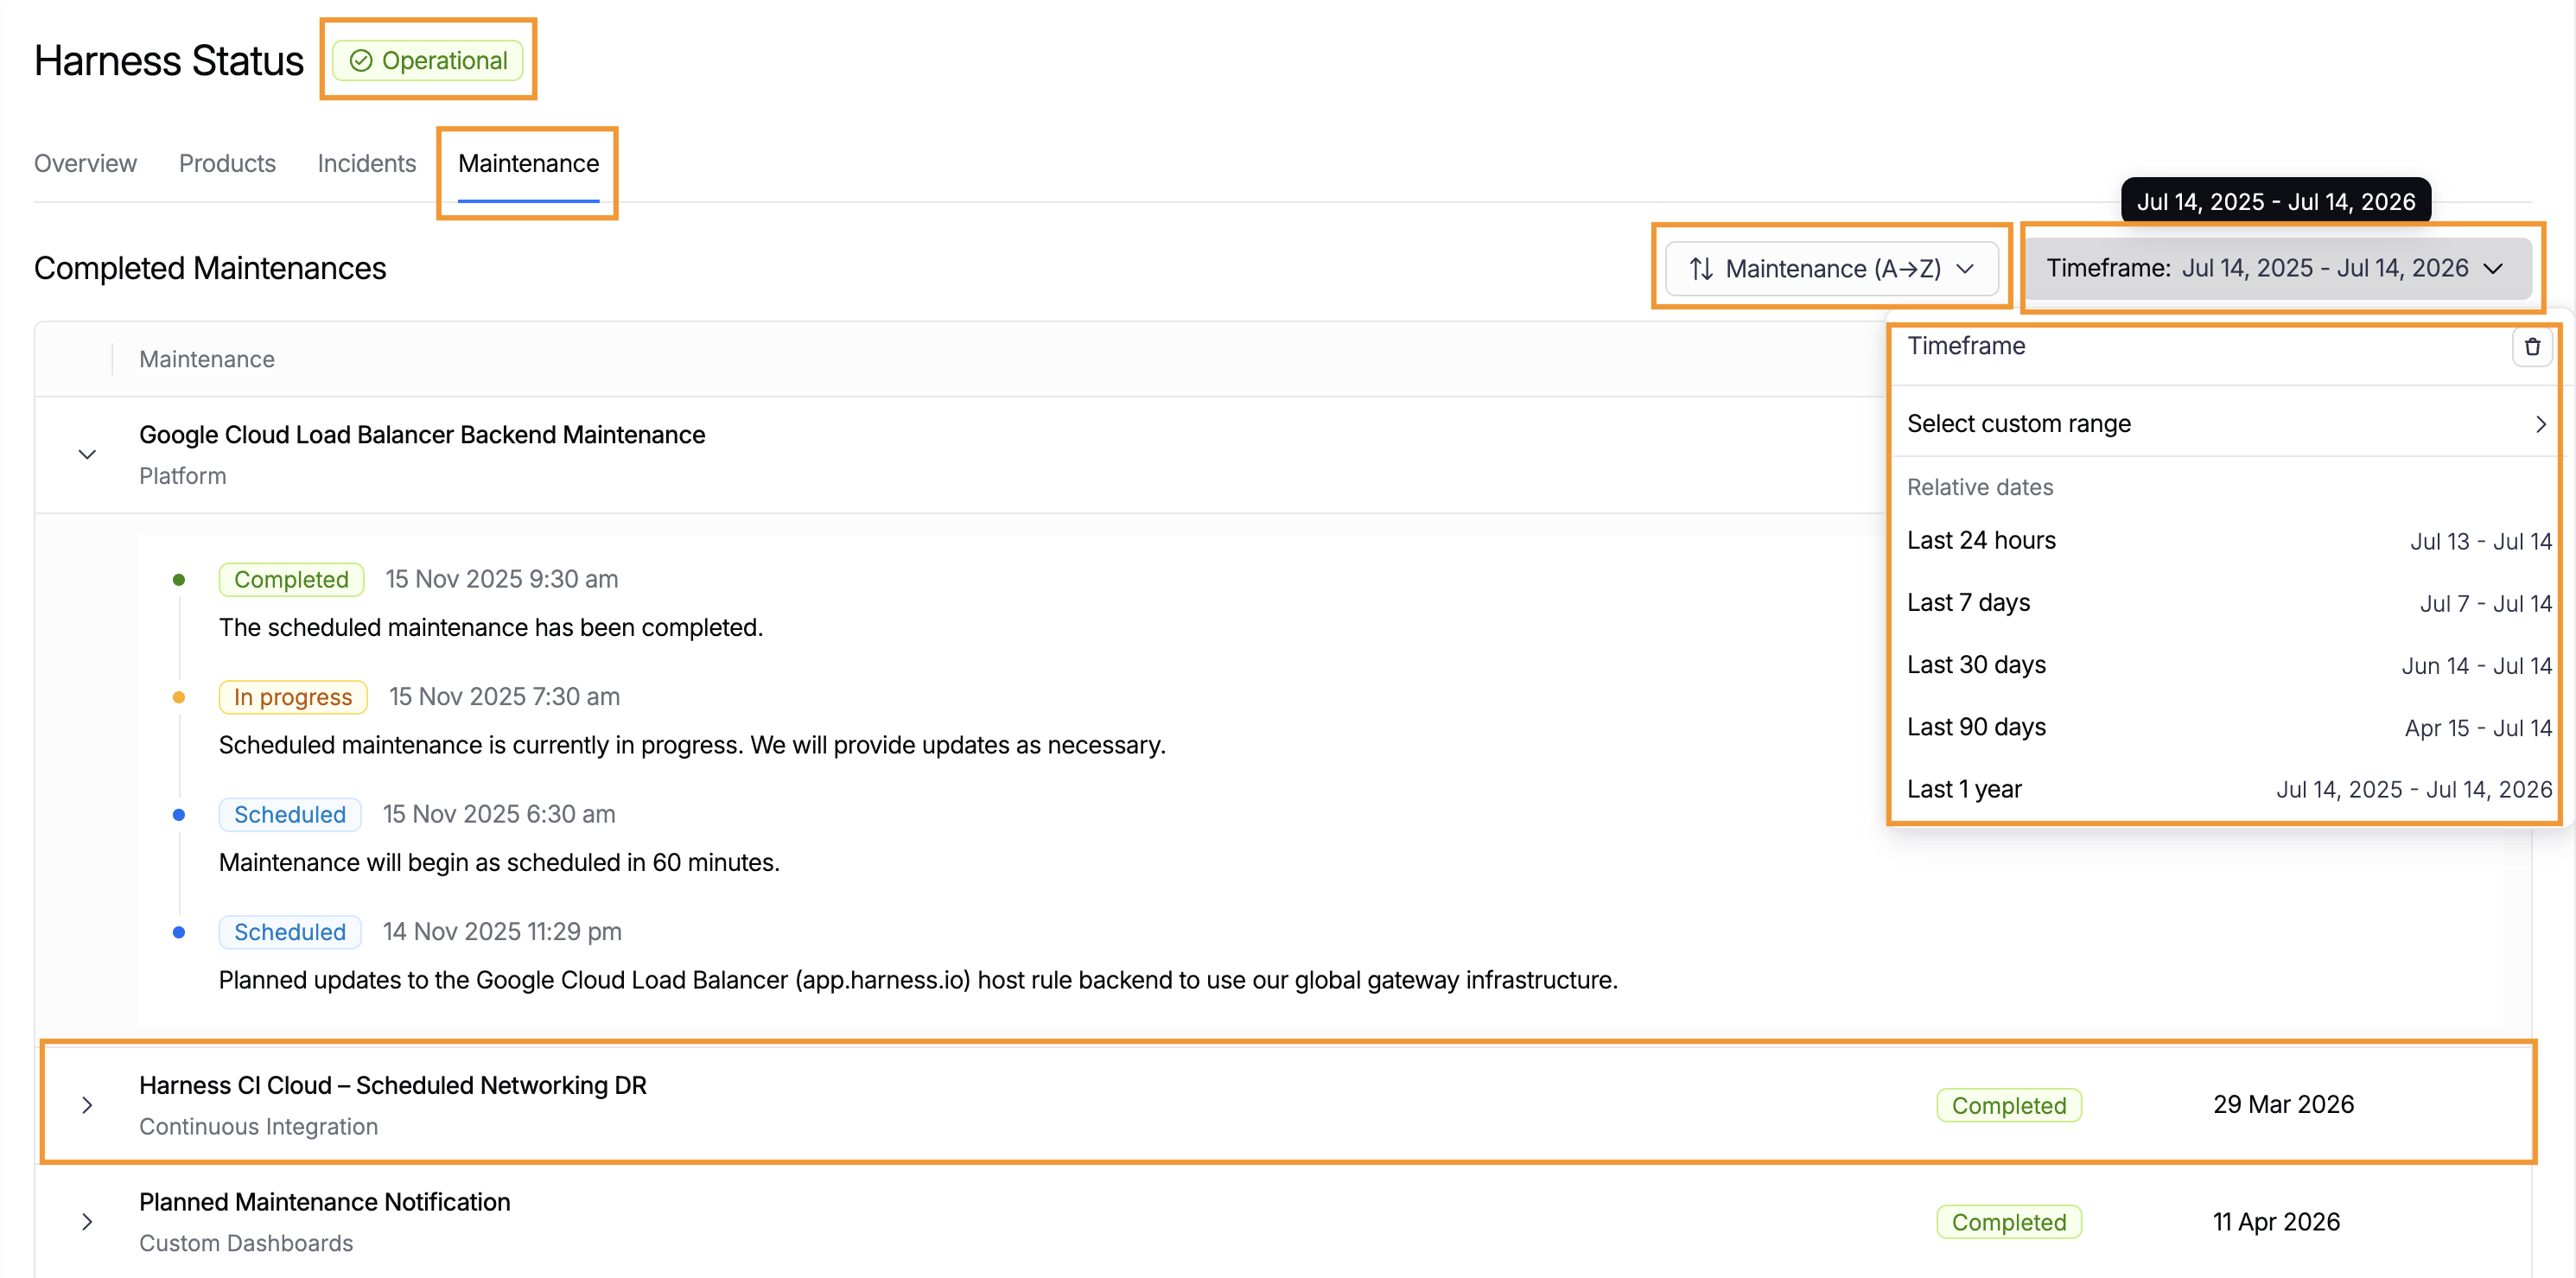
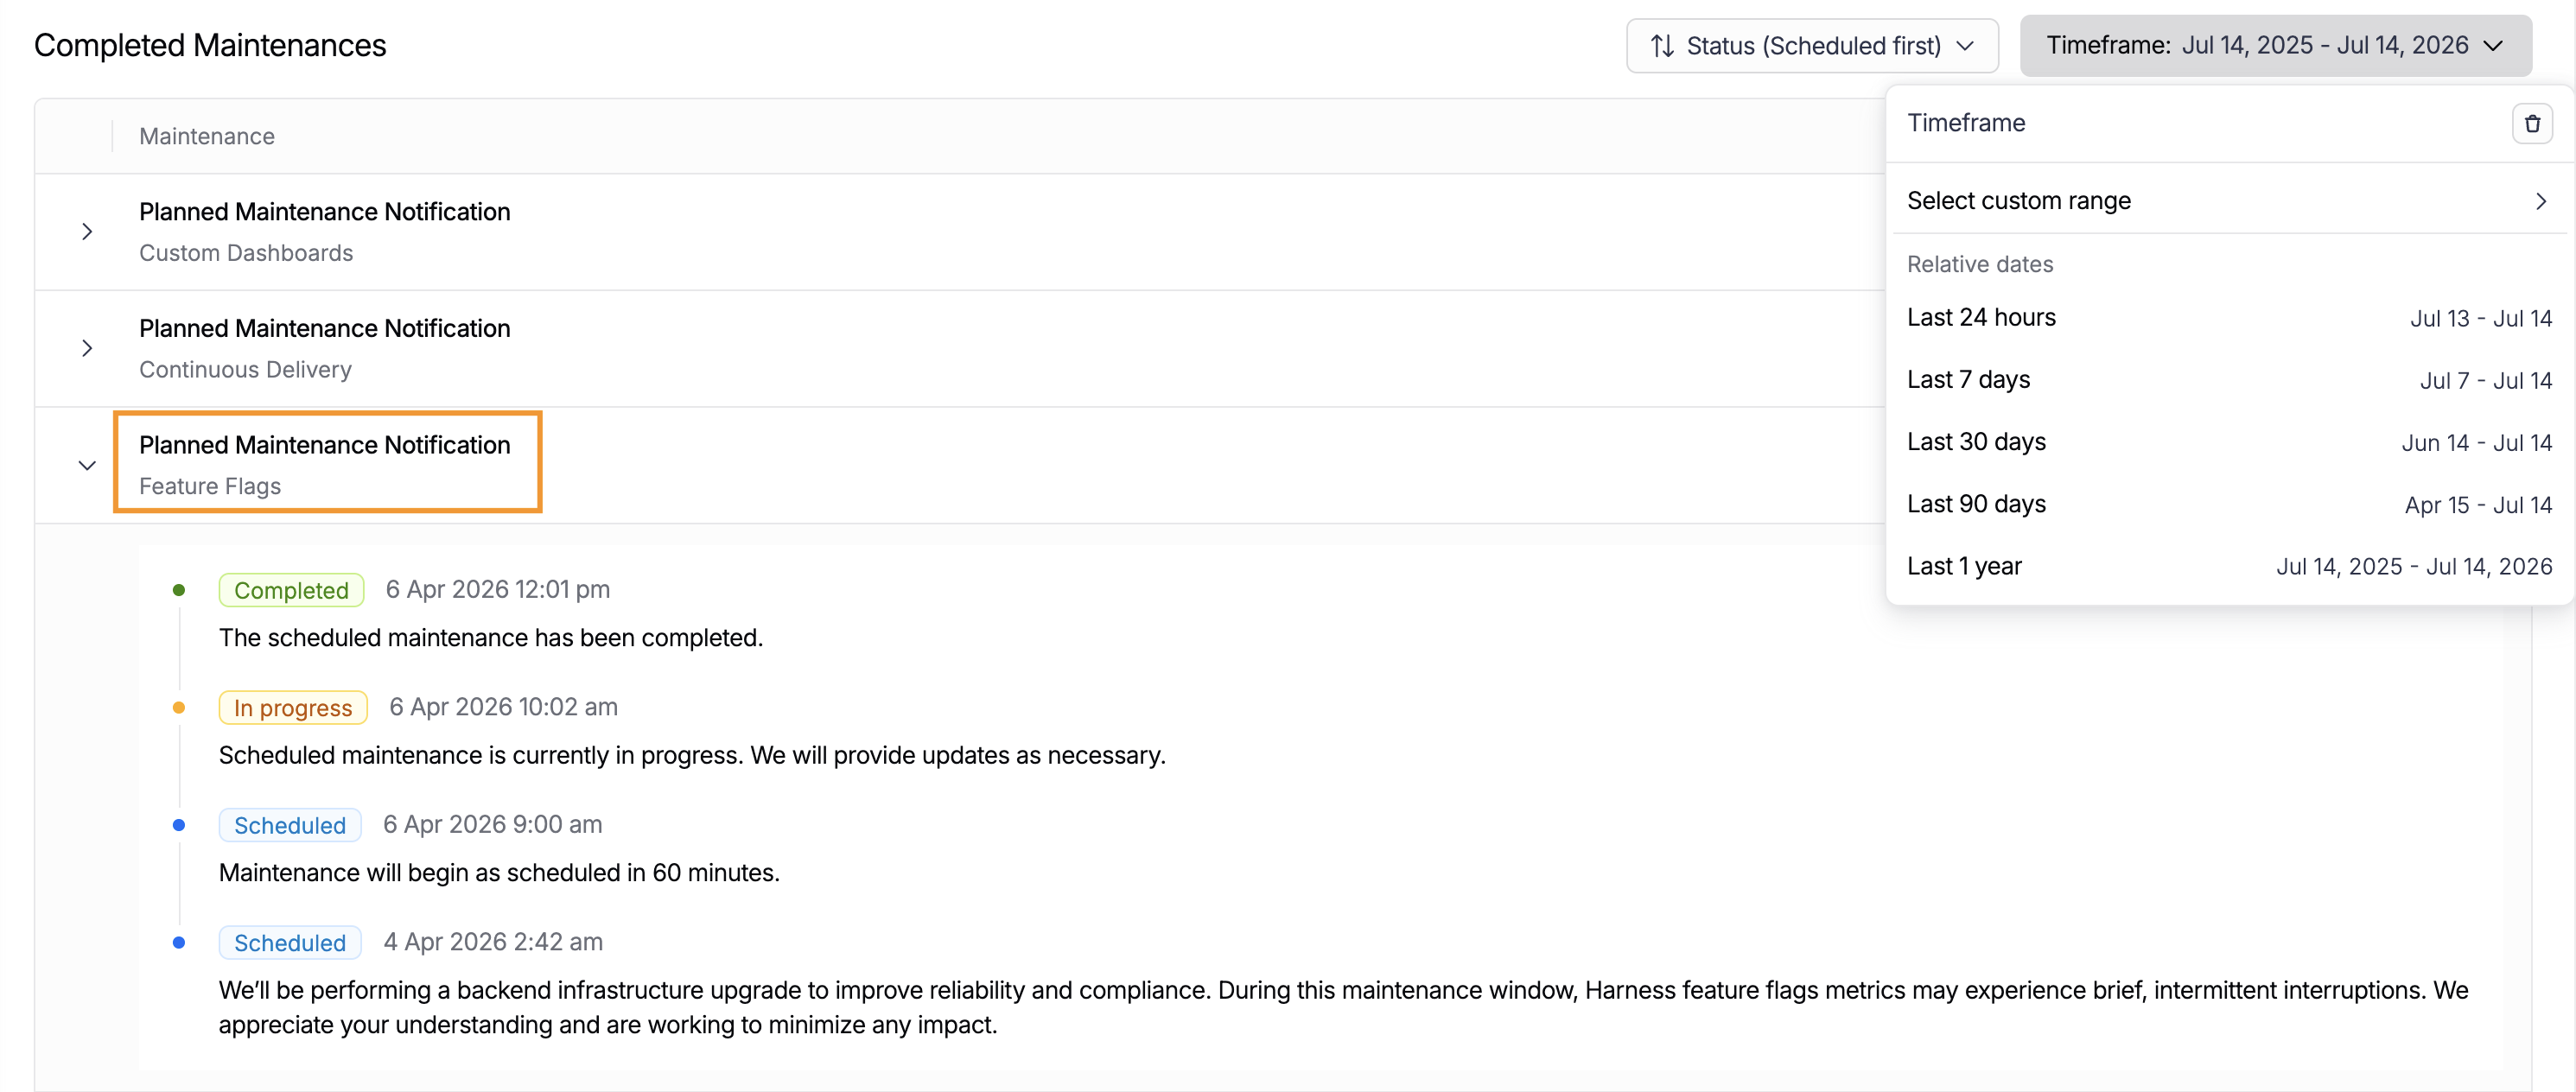
The Maintenance tab shows scheduled and completed maintenance activities.

- Select the Maintenance tab. Apply time filters to narrow the view. You can filter maintenance windows by chronological order and by whether they were completed or scheduled first or last.
- Review the Planned Maintenance notification and Scheduled Maintenance items for upcoming maintenance windows. This table includes the following:
- Title: Description of the planned work.
- Affected modules: Which services will be impacted.
- Created date: When the maintenance was scheduled.
- Scheduled date: When the maintenance is planned to begin.

If there are no scheduled maintenance windows, only the Completed Maintenance table appears. If no maintenance has occurred recently, the tab displays No maintenance activity at this time..
Respond to active incidents
When an incident occurs, the status portal automatically alerts you. A notification appears at the bottom right corner of the Harness UI when an incident is active.

-
Click View Incident to navigate directly to the status portal.
-
In the Incidents tab, select the incident title to view the complete timeline and updates. This includes the following:
- Incident title: What is affected.
- Status: Current investigation stage.
- Reported: When the incident began.
- Affected modules: Which services are impacted.
-
Apply time filters to narrow the view.
The status header changes color and displays the severity level (Major Outage) when incidents are active.
Troubleshooting
The enabled module count shows 2 more modules than I have licensed
Platform and Custom Dashboards are always included in the enabled module count because they are present in all Harness accounts by default, even though they do not appear in your license manager. Add 2 to your licensed module count to determine the total displayed count.
An incident does not appear in the uptime bar visualization
Only incidents that exceed a specific duration threshold appear in the uptime bar. Short incidents that were quickly resolved may not display in the visualization but will still appear in the Incidents tab.
The status portal shows incidents for modules I do not have enabled
Verify that the incident actually affects one of your enabled modules. Some incidents may impact shared infrastructure components like Platform, which is enabled for all accounts. Check the incident details to see all affected modules.
Related articles
- Manage Subscriptions: Review and update the module licenses that determine which services appear in your status portal.
- Manage account information: View account details and subscribe to alerts for status and billing updates.