> For the complete documentation index, see [llms.txt](https://developer.harness.io/llms.txt). Markdown versions of documentation pages are available by appending `.md` to page URLs; this page is available as [Markdown](https://developer.harness.io/harness-platform/subscriptions-and-licenses/usage-analytics.md).
# Usage Analytics
Understand how your teams engage with each Harness module through feature-level adoption metrics, and connect that engagement to your license usage.
License counts tell you what you paid for, but not whether your teams use it. Modules can sit unused for months, and adoption gaps can go unnoticed. Usage Analytics closes this gap by showing how your teams engage with each Harness module, in the Harness UI.
Usage Analytics is a central place for cross-module adoption information. It measures adoption depth, which features are used and how often, and connects that engagement to your license usage so you can validate the value you get from Harness.
{% hint style="info" %}
**FEATURE AVAILABILITY**
Currently, Usage Analytics is behind the feature flag `PL_ENABLE_USAGE_ANALYTICS`. Contact [Harness Support](mailto:support@harness.io) to enable it.
{% endhint %}
***
### What you will learn in this topic
By the end of this topic, you will be able to:
* Explain what [usage analytics measures](#what-usage-analytics-measures) and how it differs from operational dashboards and the subscriptions page.
* Identify [which modules surface adoption metrics](#modules-supported).
* Compare [Usage Analytics with Dashboards and Subscriptions](#how-usage-analytics-compares-to-dashboards-and-subscriptions) to choose the right one.
* Connect [feature usage to license usage](#feature-usage-and-license-usage) to measure value.
***
### What Usage Analytics measures
Usage Analytics focuses on how your teams interact with Harness modules, and visualizes platform metadata about engagement
It answers questions such as:
* "Are we using this feature?"
* "How often do teams use it?"
Use Usage Analytics to quantify adoption and value at the account and organization level.
#### Access Usage Analytics
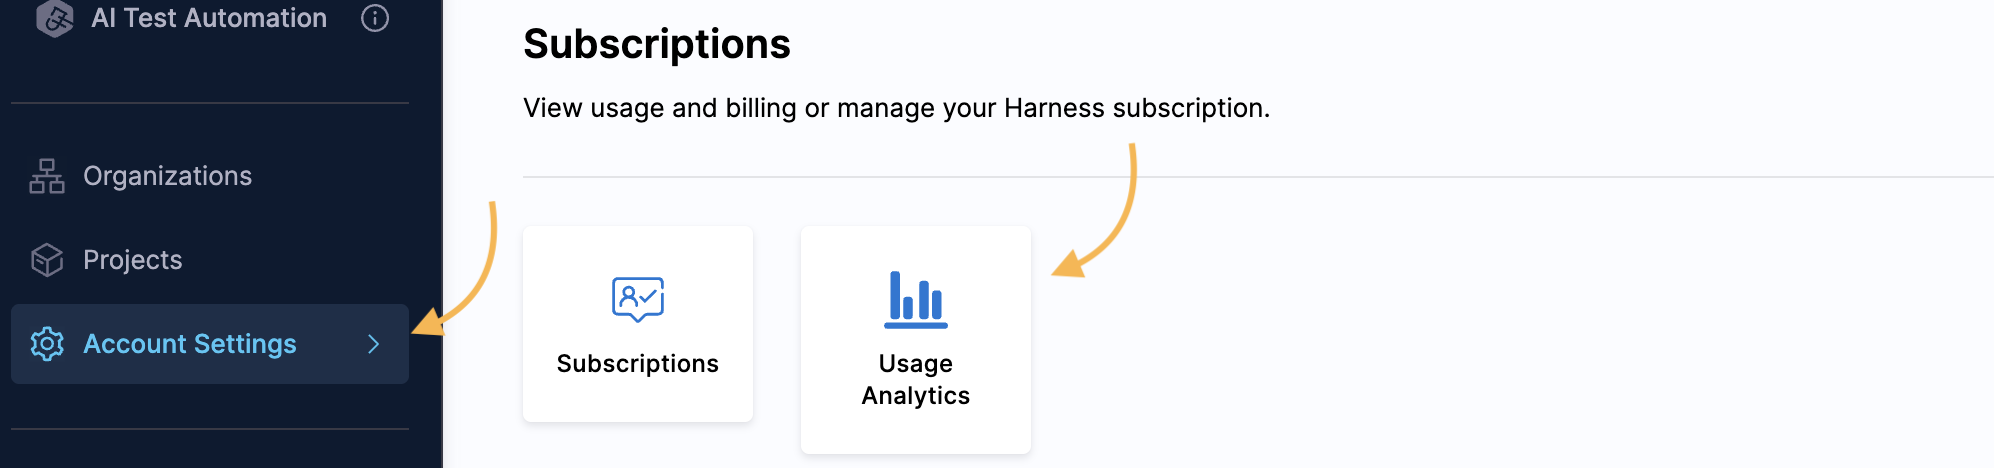
Navigate to **Account Settings** -> **Subscriptions** -> **Usage Analytics** or directly navigate from **Account Settings** to **Usage Analytics**.
Click to view full size image
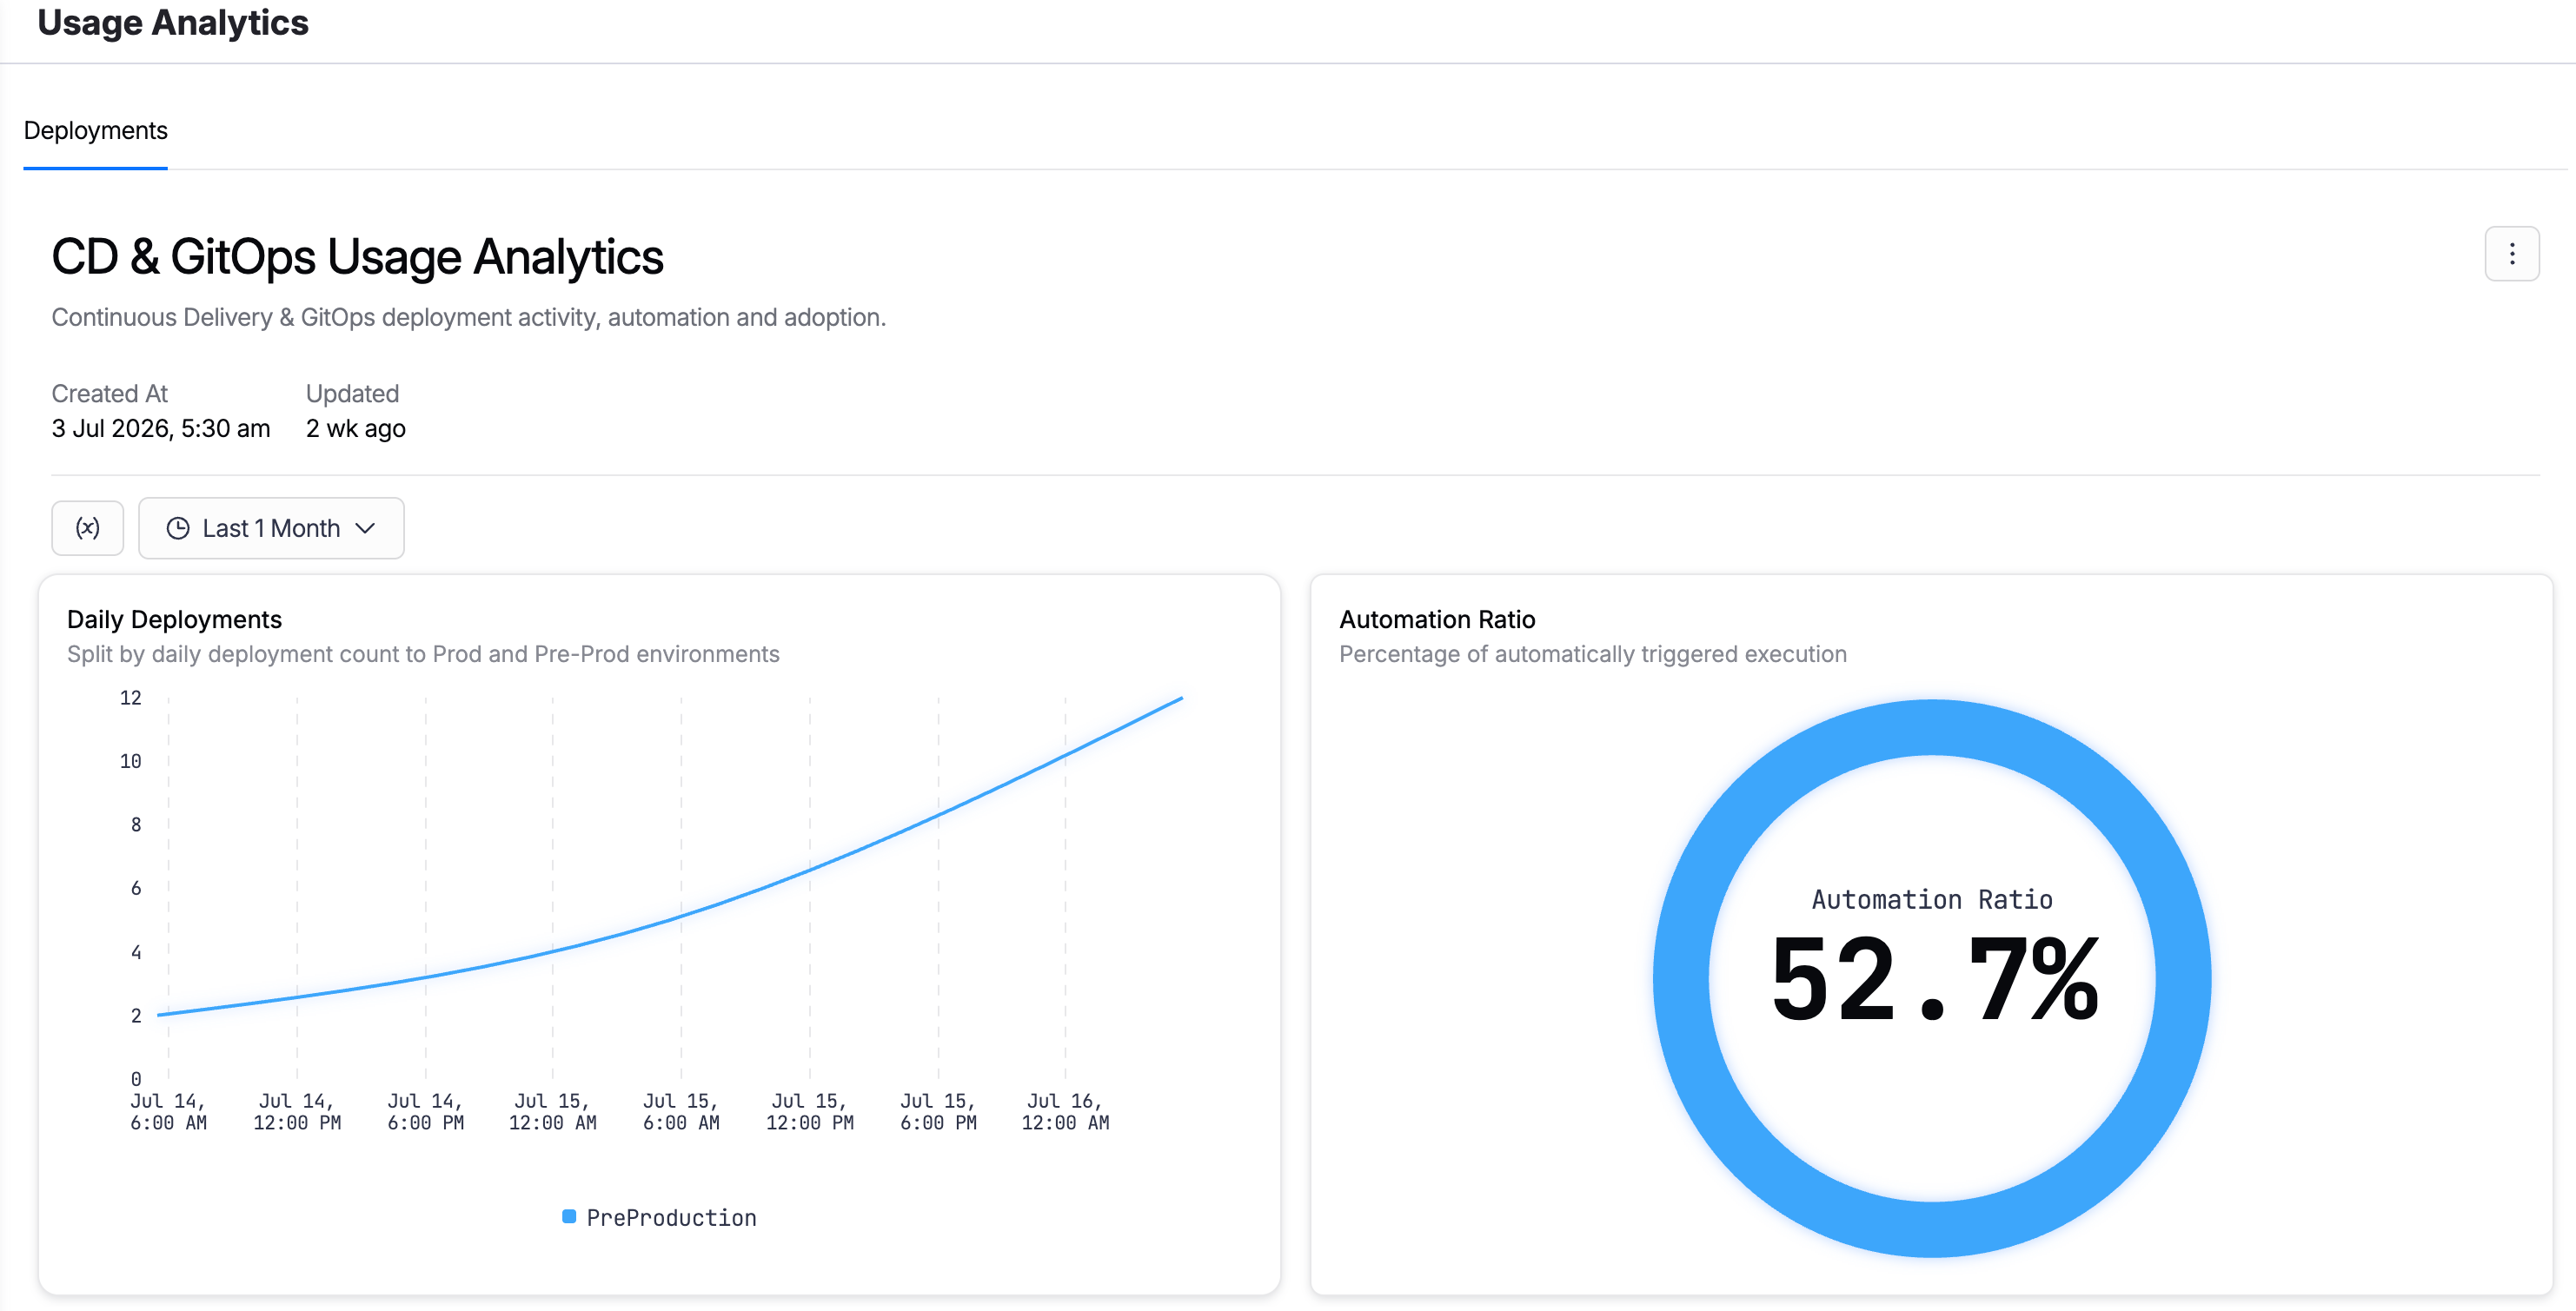
Under the **Deployments** tab, adoption metrics such as **top 10 most deployed services**, **Automation ratio**, and others are displayed.
Click to view full size image
***
### Modules supported
Usage Analytics organizes adoption metrics by module so you can assess each part of the platform independently. It describes metrics for the following modules:
* [Harness Platform](/harness-platform/new-to-harness-platform/overview.md)
* [Continuous Delivery & GitOps (CD)](https://developer.harness.io/continuous-delivery/)
* [Continuous Integration (CI)](https://developer.harness.io/continuous-integration/)
* [Security Testing Orchestration (STO)](https://developer.harness.io/security-testing-orchestration/)
* [Supply Chain Security (SCS)](https://developer.harness.io/software-supply-chain-assurance/)
This page describes the feature usage that is most relevant to that module, so you can assess adoption for one module without mixing in signals from another.
***
### How Usage Analytics compares to Dashboards and Subscriptions
Harness provides different ways to report on activity, and each answers a different question. Use the following comparison to choose the right view for your goal.
| View | Primary question | Data context |
| ----------------------------------------------------------------------------------------------------------------------- | -------------------------------------- | ----------------------------------------------------------------------------------------------- |
| [Harness Dashboards](/harness-platform/use-harness-platform/harness-dashboards/dashboard-legacy/dashboards-overview.md) | Is my pipeline or application healthy? | Operational metrics, such as failure rates and costs |
| [Subscriptions page](/harness-platform/subscriptions-and-licenses/subscriptions.md) | Am I within my license limits? | Contract limits, such as license counts and credits |
| Usage Analytics | How are teams adopting each module? | Adoption depth, such as feature usage frequency, and a central hub for cross-module information |
***
### Feature usage and license usage
Usage analytics reports on features and functionality, and it relates that activity to your license usage. This connection moves you to a measure of value:
* **Validate value realization**: The licenses you pay for translate into actual usage, so you can measure the value you get from each license.
* **Identify adoption gaps**: See where a module has low adoption.
***
### FAQ How is Usage Analytics different from Harness Dashboards?
Harness Dashboards visualize operational output, such as deployment health and build results. Usage Analytics visualizes engagement, showing which features are used and how often, to prove adoption depth.
How is Usage Analytics different from the subscriptions page?
The subscriptions page reports license counts and limits. Usage Analytics correlates those licenses to actual activity, so you can see how much of your entitlement translates into engagement.
***
### Related articles
* [Harness Flex pricing](/harness-platform/subscriptions-and-licenses/flex-pricing.md): Unit-based pricing model to use any Harness module without purchasing separate licenses.
{% @harness-feedback/feedback module="harness-ai" pagePath="harness-ai/subscriptions-and-licenses/usage-analytics" %}