STO Usage Dashboard
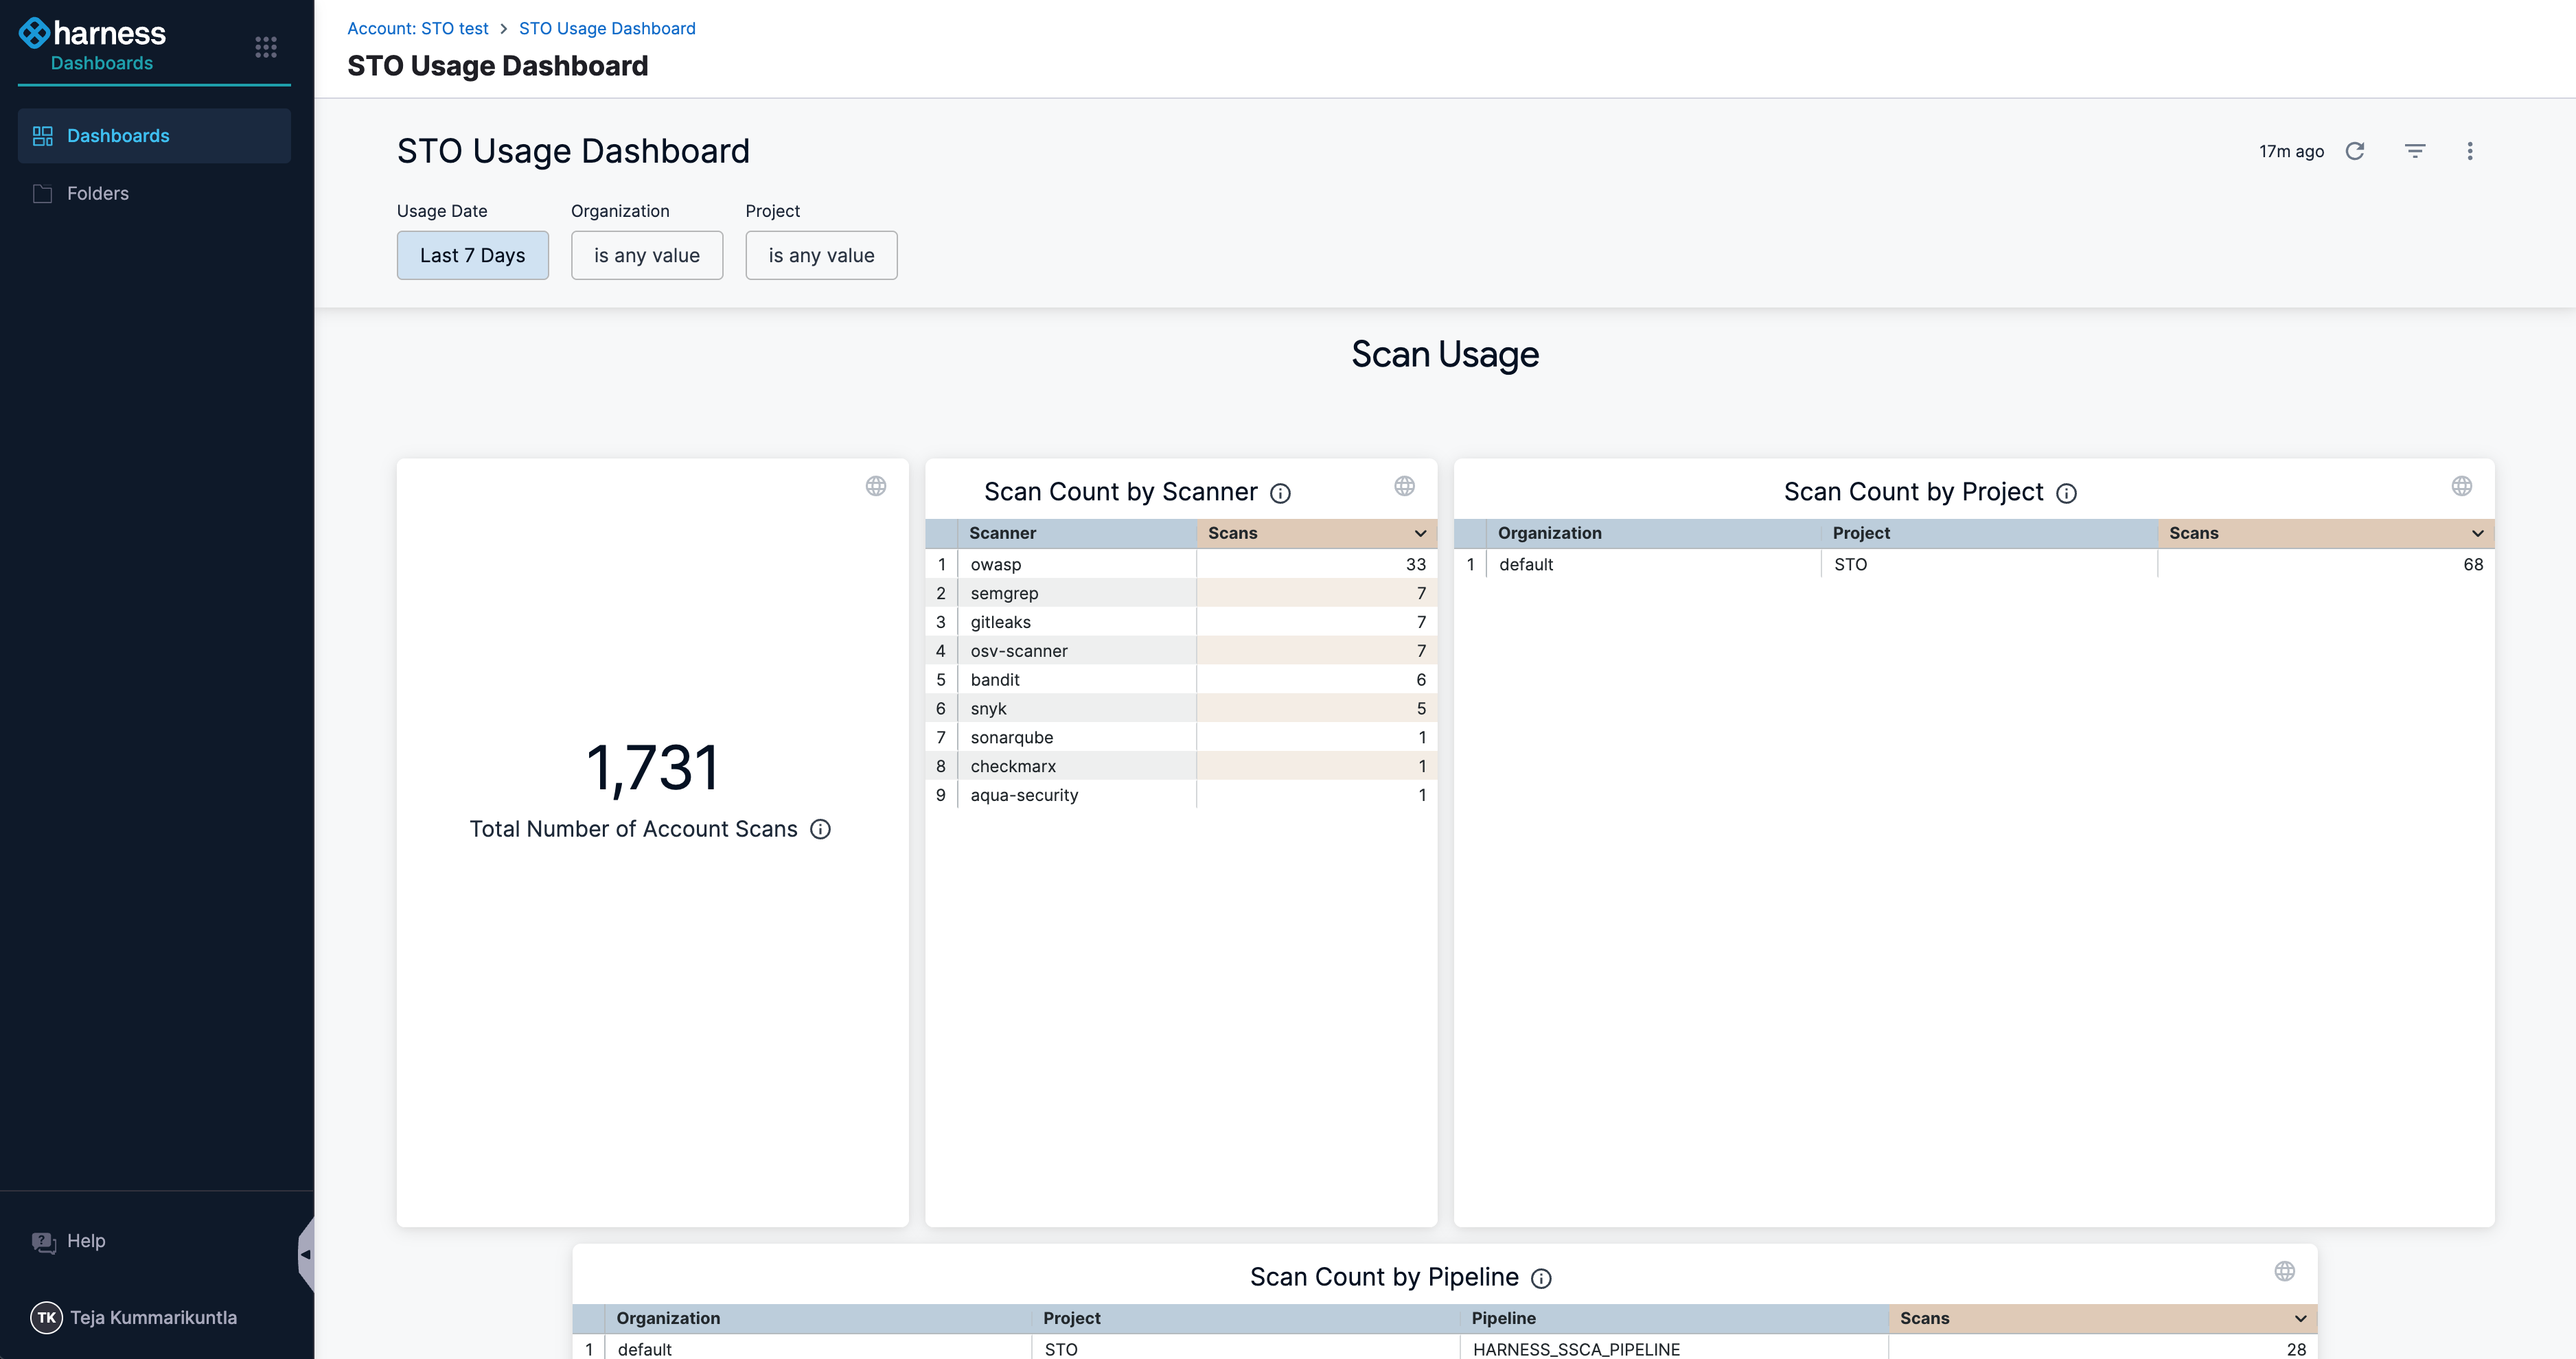
The STO Usage Dashboard provides visibility into scan activity and user engagement across the account. It helps track how frequently scans are run, which users are initiating them, and how different scanners and projects contribute to overall usage. This dashboard is useful for understanding scan distribution, identifying inactive users, and reviewing AI feature adoption. For steps to navigate to this dashboard, refer to View STO dashboards.
It includes filters to narrow down usage data by Organization, Project, and date range. The dashboard components are interactive. You can hover over charts, graphs, and other visual elements to view tooltips with additional context. Clicking on a component lets you drill down into related data or navigate to specific detail pages within STO for deeper investigation.
This dashboard requires an Enterprise account.
The dashboard includes the following sections:
Scan Usage
- Total Number of Account Scans: Displays the total number of scans across the account, including those associated with deleted projects and pipelines.
- Scan Count by Scanner: Shows the total number of scans, categorized by the scanner used.
- Scan Count by Project: Displays the number of scans initiated under each project.
- Scan Count by Pipeline: Lists the scan counts grouped by pipeline.
- Scan Usage Over Time: A daily time series showing the number of scans executed each day.
User-Based Insights
- Inactive Users in the Last 30 Days: Lists users who have not triggered any scans in the past 30 days.
- AI Usage Counts: Displays how many AI remediation requests have been made by each user.
- User Scan Counts: Shows the number of scans initiated by each user.

Filters on STO Usage Dashboard
The STO Usage Dashboard includes filters to help you narrow down the usage data based on specific criteria. After applying any filter, you must click Reload at the top right of the dashboard for the changes to take effect.
The available filters include:
- Usage Date: Filters scan data based on time. You can select from preset ranges (e.g., last 7 days) or define a custom date range.
- Organization: Filters data by the selected Harness Organization.
- Project: Filters data by the selected Project under the chosen Organization.