Monitoring options
You can monitor the infrastructure components of your Harness Self-Managed Enterprise Edition installation by bringing your own open-source monitoring system, such as Prometheus, and integrating with observability tools, such as Grafana.
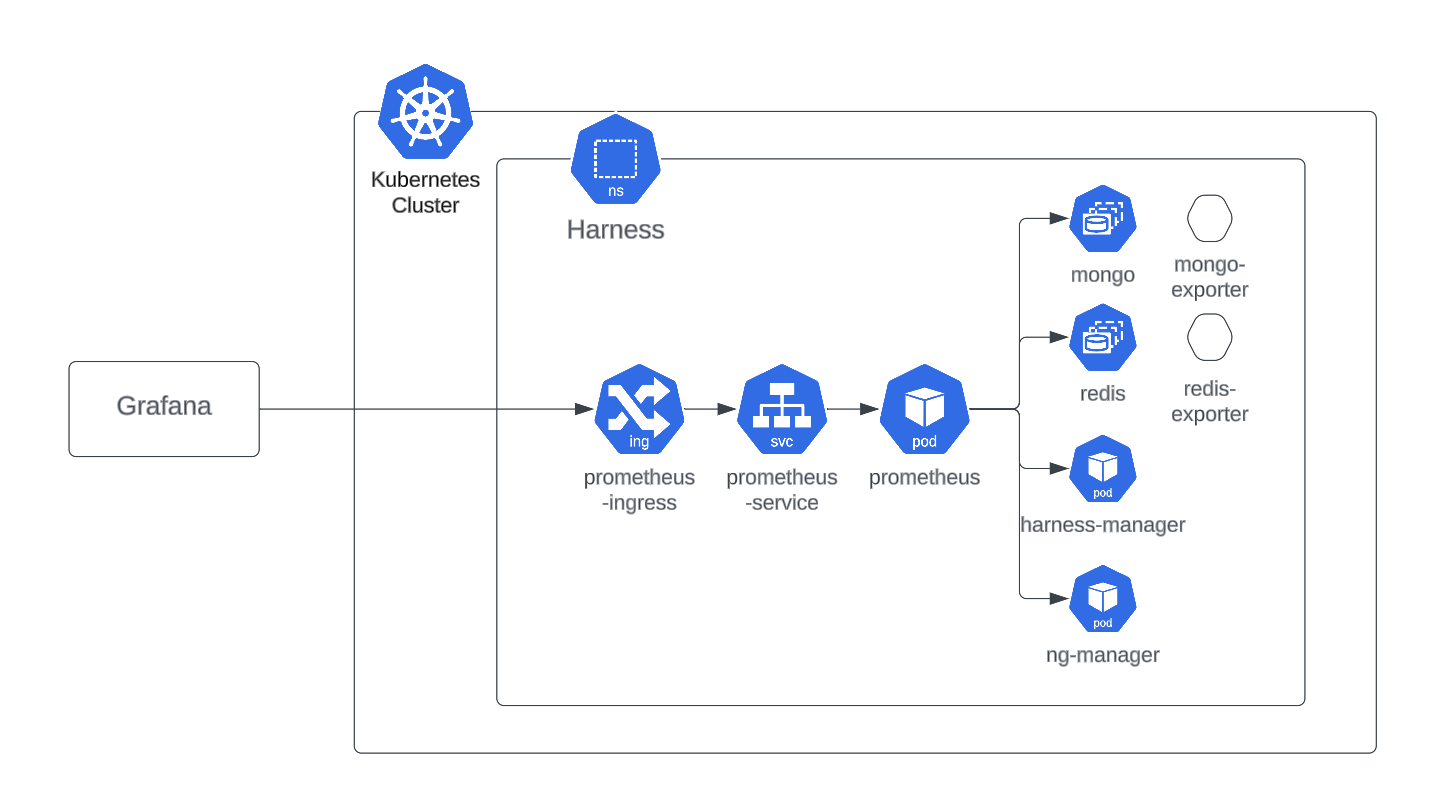
Harness Self-Managed Enterprise Edition monitoring options enable you to view metrics and dashboards and set up an alerting system for your specific configuration. To demonstrate how you can monitor database applications, like MongoDB, Postgres, or Redis, for the Harness Self-Managed Enterprise Edition, this topic describes how you can use a Prometheus server installed in the same cluster as your Harness services.
Requirements
This example setup requires:
-
An endpoint in your microservice from which Prometheus can scrape metrics, for example
ng-manager:8889/metrics. -
A Prometheus installation in the same cluster as your Harness Self-Managed Enterprise Edition installation.
-
An external Prometheus configuration or a Grafana configuration using a Prometheus endpoint exposed by an ingress rule.
Set up Prometheus in-cluster
To set up Prometheus in-cluster, do the following:
-
Install your Prometheus server using a Prometheus operator in the same cluster as your Harness services and databases.
-
Set up the environment so that prometheus is able to scrape all these endpoints within the cluster.
-
Use the Bitnami chart with following override file.
  prometheus:
   additionalScrapeConfigs:
    enabled: true
    type: internal
    internal:
      jobList:
      - job_name: 'kubernetes-pods'
        scrape_interval: 30s
        kubernetes_sd_configs:
        - role: pod
        relabel_configs:
        - source_labels: [__meta_kubernetes_pod_annotation_prometheus_io_scrape]
          action: keep
          regex: true
        - source_labels: [__meta_kubernetes_pod_annotation_prometheus_io_path]
          action: replace
          target_label: __metrics_path__
          regex: (.+)
        - source_labels: [__address__, __meta_kubernetes_pod_annotation_prometheus_io_port]
          action: replace
          regex: ([^:]+)(?::\d+)?;(\d+)
          replacement: $1:$2
          target_label: __address__
        - action: labelmap
          regex: __meta_kubernetes_pod_label_(.+)
        - source_labels: [__meta_kubernetes_namespace]
          action: replace
          target_label: kubernetes_namespace
        - source_labels: [__meta_kubernetes_pod_name]
          action: replace
target_label: kubernetes_pod_namenoteProviding these configurations in the
config.yamlfile of a Prometheus server enables Prometheus to scrape all available endpoints. -
Run the following to install the Prometheus chart.
helm install prometheus oci://registry-1.docker.io/bitnamicharts/kube-prometheus -f override.yaml
Grafana setup options
In a production environment, you can use a central Grafana setup to visualize metrics from multiple Prometheus endpoints. Depending on your requirements, you may want to monitor multiple projects or environments. For example, you may have your production environment in one cluster and your development environment in a second cluster, and you want to monitor both environments.
To expose in-cluster Prometheus metrics to an external instance of Grafana, set up your ingress or VirtualService.
- nginx ingress controller
- Istio
To use an nginx ingress controller, create an ingress rule for Prometheus.
   apiVersion: networking.k8s.io/v1
      kind: Ingress
      metadata:
        name: prometheus
        namespace: <Namespace>
      spec:
        ingressClassName: harness
        rules:
         - http:
            paths:
             - path: /prometheus(/|$)(.*)
               pathType: ImplementationSpecific
               backend:
                 service:
                   name: <prometheus-service-name>
                   port:
                     number: 9090
To use Istio, create a VirtualService for Prometheus.
   apiVersion: networking.istio.io/v1alpha3
   kind: VirtualService
   metadata:
     name: prometheus-virtualservice
     namespace: harness
   spec:
     gateways:
       - istio-test/public
     hosts:
       - istio.test.com
     http:
       - match:
          - uri:
             prefix: /prometheus/
          - uri:
             prefix: /prometheus
         name: prometheus
         rewrite:
           uri: /
         route:
           - destination:
               host: <prometheus-service-name>
               port:
                 number: 9090
Required overrides
Use the following overrides when you install or upgrade your Harness Helm charts. You can add the monitoring.yaml file from the Helm charts repo to enable the metrics of all databases and Harness services, or you can enable metrics for each service.
For this example, we use the Prometheus operator packaged by Bitnami as an external Prometheus setup.
bootstrap:
  database:
    mongodb:
      metrics:
        enabled: true
      podAnnotations:
        prometheus.io/path: /metrics
        prometheus.io/port: '9216'
        prometheus.io/scrape: 'true'
    redis:
      metrics:
        enabled: true
      podAnnotations:
        prometheus.io/path: /metrics
        prometheus.io/port: '9121'
        prometheus.io/scrape: 'true'
    timescaledb:
      prometheus:
        enabled: true
      podAnnotations:
        prometheus.io/path: /metrics
        prometheus.io/port: '9187'
        prometheus.io/scrape: 'true'
    postgresql:
      metrics:
        enabled: true
      podAnnotations:
        prometheus.io/path: /metrics
        prometheus.io/port: '9187'
        prometheus.io/scrape: 'true'
global:
  monitoring:
    enabled: true
    port: 8889
    path: /metrics
View metrics on the Grafana dashboard
To visualize metrics from various sources, you can import Grafana dashboards.
Follow the below steps on your Kubernetes cluster to deploy Grafana:
- Install Grafana using the Helm chart.
helm repo add grafana https://grafana.github.io/helm-charts
helm repo update
helm install grafana grafana/grafana -n <Namespace>
- Install a Bitnami packaged Grafana operator. For instructions, go to Install the Operator in the Grafana documentation.
Open the Grafana dashboard
- Decode the secret. The login username is
adminby default. - Execute the port-forward command to host Grafana locally on port 3000.
kubectl get secret --namespace <Namespace> grafana -o jsonpath="{.data.admin-password}" | base64 --decode ; echo

export POD_NAME=$(kubectl get pods --namespace <Namespace> -l "app.kubernetes.io/name=grafana,app.kubernetes.io/instance=grafana" -o jsonpath="{.items[0].metadata.name}")

kubectl --namespace default port-forward $POD_NAME 3000
-
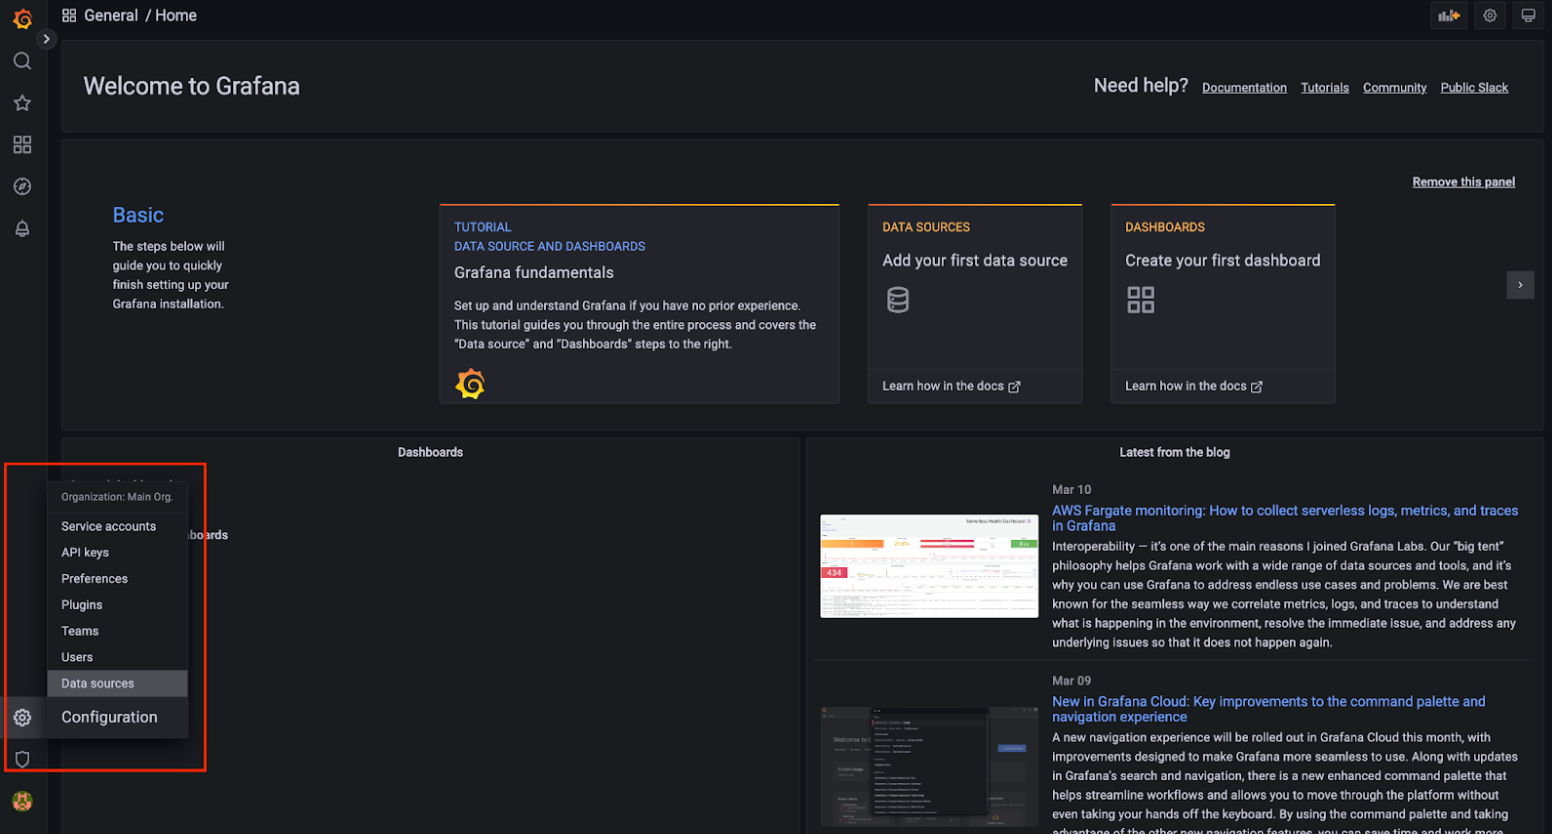
Sign in to the Grafana dashboard home page.
-
Set Prometheus as the data source:
Go to settings, select Data sources, and then select Add data source.
-
Select Prometheus.
-
Configure the URL settings to connect to your locally-hosted Prometheus setup, with the locally-hosted Grafana instance.
-
Deploy prometheus and grafana on the same cluster, and use kubeDNS resolution. For example, if you want to connect pod A to pod B, on pod A, the hostname of B should be:
http://serviceNameOfPodB.<namespaceOfPodB>.svc.cluster.local:<port>
This requires the following information:
- Service name of where prometheus is hosted.
- Namespace in which prometheus is hosted.
- Port at which prometheus is hosted.
This makes our present URL look like:
http://my-release-kube-prometheus-prometheus.default.svc.cluster.local:9090/
The final URL should be similar to the above URL, according to your system specifications. Any extra space or character in the URL field causes the data source testing to fail.
-
Configure the Prometheus type and Prometheus version fields.
-
Select Save & test. A confirmation that the data source is working displays.
Add a Grafana dashboard
Now you can add a dashboard to view metrics via query.
- To add a dashboard, go to Dashboards and then select New Dashboard and Add a new panel.
Custom dashboards are available in the Harness public repository:
Use a server installed in the same cluster as Harness services
In this example, the Prometheus server is installed in the same cluster as your Harness services. You can monitor your services with Grafana installed in the same cluster or outside the cluster, with Prometheus configured as the data source.
Monitor Harness services
Harness Self-Managed Enterprise Edition currently supports monitoring for four Harness services.
-
access-control -
pipeline-service -
ng-manager -
harness-manager
You can monitor the services by enabling monitoring in the override file. For more information, go to Required overrides.
Harness has the following comprehensive metrics available for the services:
- Mean Error Rate
- HTTP Error Rate
- HTTP Response 95th percentile
- HTTP Error Count
- JVM Total Memory Max
- Committed & Used
- JVM Non-Heap Committed & Used
- JVM Metaspace Memory Pool Used & Committed
- JVM Threads Blocked / Deadlock State
- DW Threads Utilization
You can view the metrics by importing the System Observability Dashboard in our Harness Dashboards repository.
To load the dashboard, do the following:
-
Go to Settings, and then select Variables.
-
Select Data source, and then select Prometheus.
-
Run the query at the bottom of the page to test the data source.
The metrics for the services are available to view on the dashboard.