Analyze deployment impact
Harness helps you evaluate the impact of your deployment on the service health of a monitored service.
Analyze Deployment Impact step
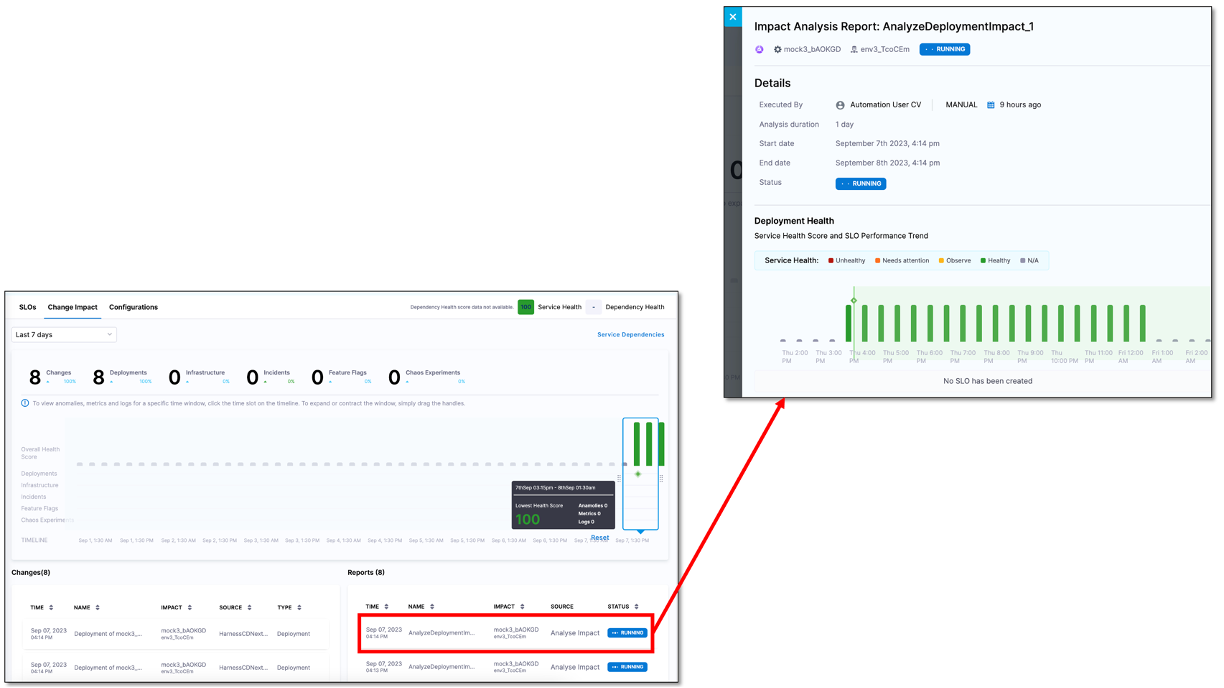
Harness Continuous Deployment (CD) includes the Analyze Deployment Impact step. When you execute a deployment pipeline that has the Analyze Deployment Impact step added, Harness analyzes the impact of deployment on the health of the monitored service (associated with the Analyze Deployment Impact step) and generates an Impact Analysis Report.
Impact Analysis Report
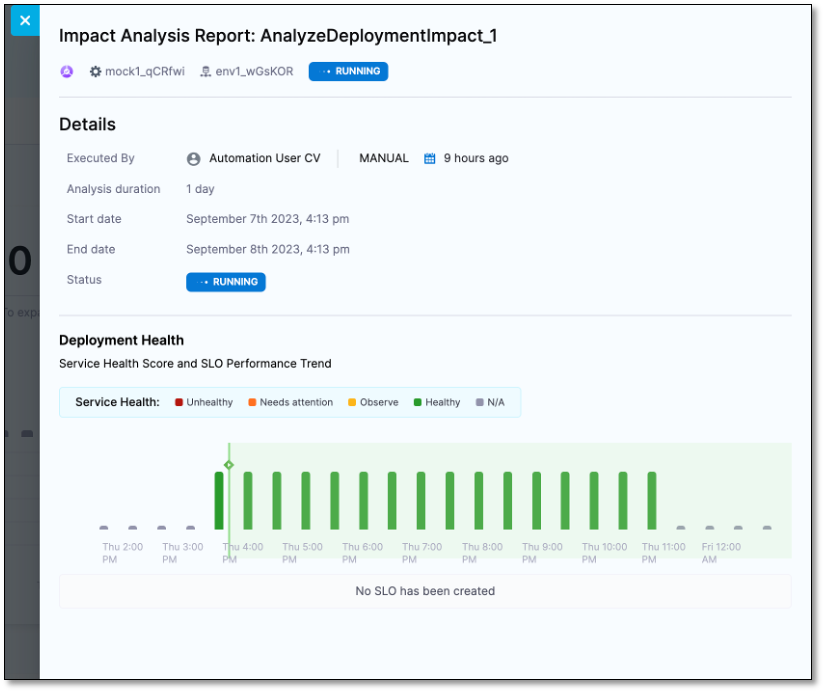
The Impact Analysis Report includes the following information:
-
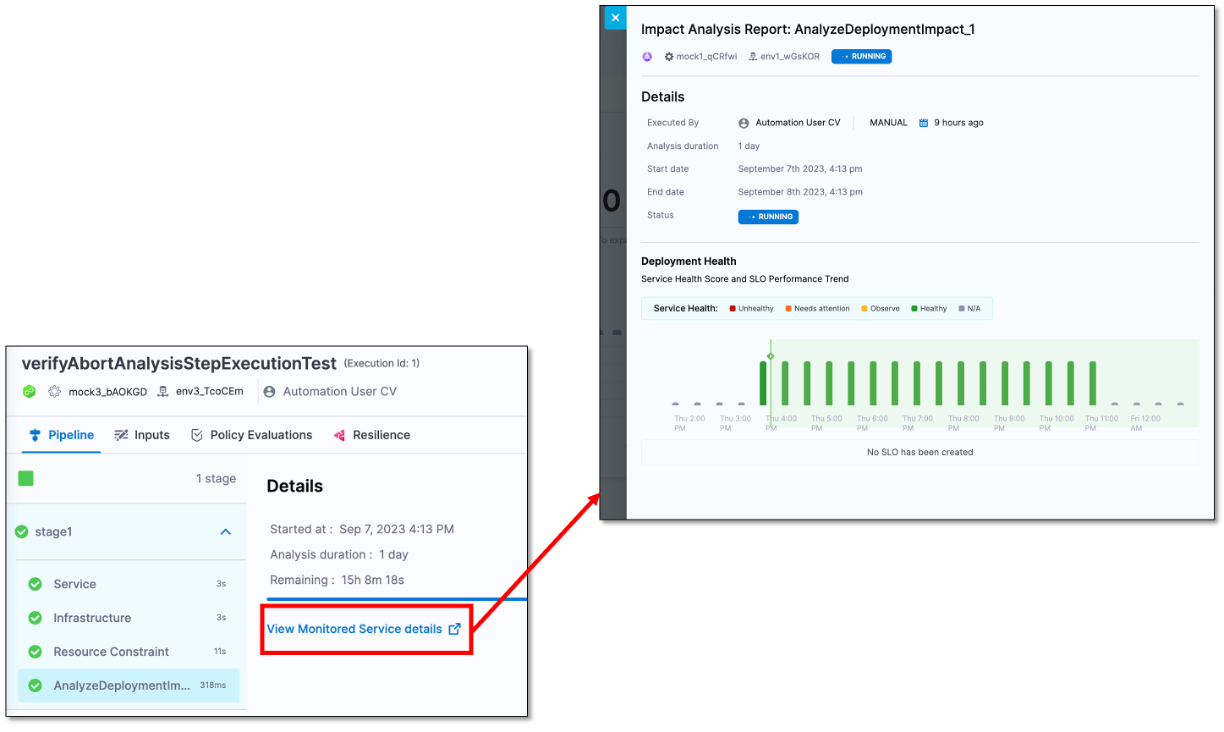
Report name: This is derived from the Analyze Deployment Impact step name. For example, "Impact Analysis Report: AnalyzeDeploymentImpact_1".
-
Service and environment: Details about the specific service and environment where the deployment was executed.
-
User information: Information about the user who initiated the deployment and when it was executed.
-
Analysis duration: The duration for which the analysis was carried out.
-
Start and end times: The date and time when the analysis started and when it concluded.
-
Analysis status: The status of the analysis, which can be one of the following: Running, Completed, or Aborted.
-
Service health and SLO performance: Service health score and SLO performance trend chart for the duration of the analysis.
Add Analyze Deployment Impact step to a deployment stage
To see the Impact Analysis Report, you need to add the "Analyze Deployment Impact" step to your deployment pipeline. There are multiple ways to add this step, depending on whether you're building a new deployment stage or modifying an existing one.
To add the Analyze Deployment Impact step to your pipeline, use one of the methods below.
Add to a new deployment stage
If you're building a deployment stage and are currently on the Execution tab follow these steps:
-
Select Add Step.
The Step Library page appears.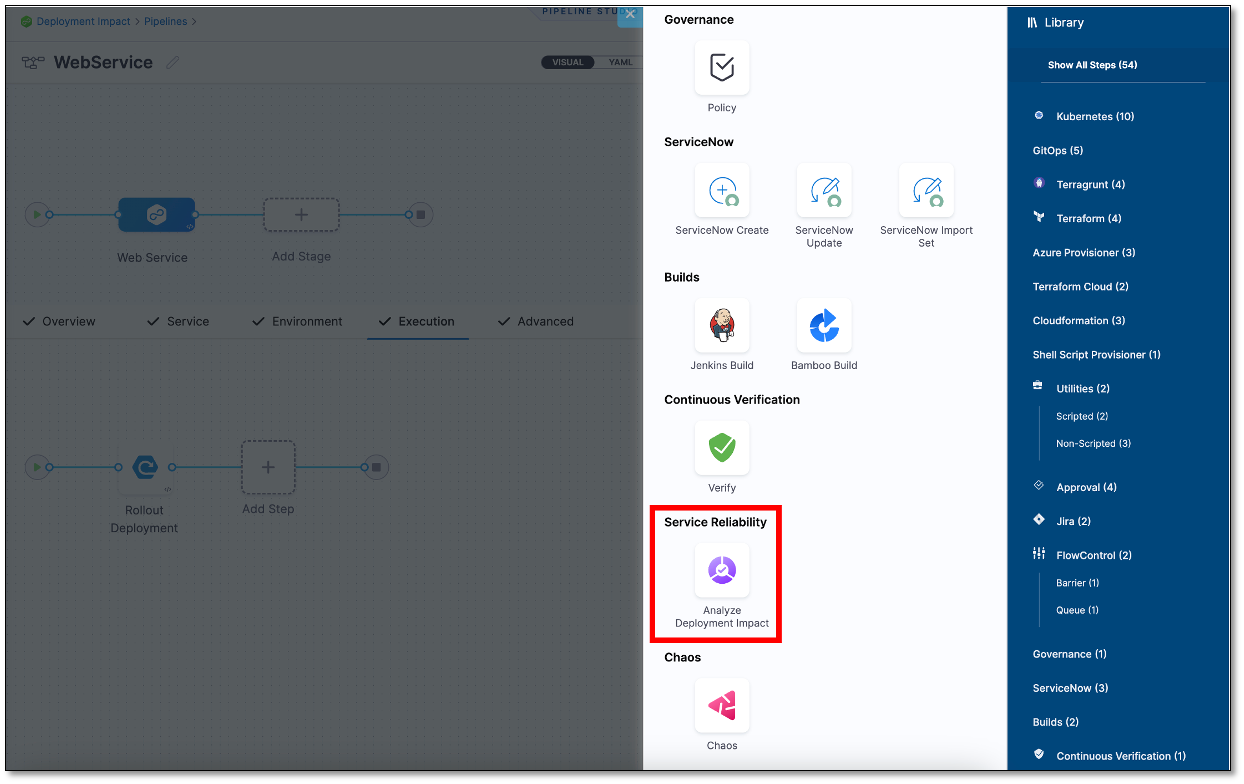
-
In the Service Reliability section, select Analyze Deployment Impact.
The Analyze Deployment Impact settings page appears.
Add to an existing deployment stage
To include the Analyze Deployment Impact step into an existing deployment stage, perform the following steps:
-
Select the stage where you want to add the Analyze Deployment Impact step.
-
On the stage settings pane, select the Execution tab.
-
In the stage, select Add Step where you want to add the Analyze Deployment Impact step.
The Step Library page appears. You can add a step at various points in the pipeline, such as the beginning, end, in between existing steps, or below an existing step. Simply choose the location where you want to add the step and follow the prompts to add it.
-
In the Service Reliability section, select Analyze Deployment Impact.
The Analyze Deployment Impact settings page appears.
Configure Analyze Deployment Impact step settings
The Analyze Deployment Impact settings page displays various options to configure Analyze Deployment Impact step.
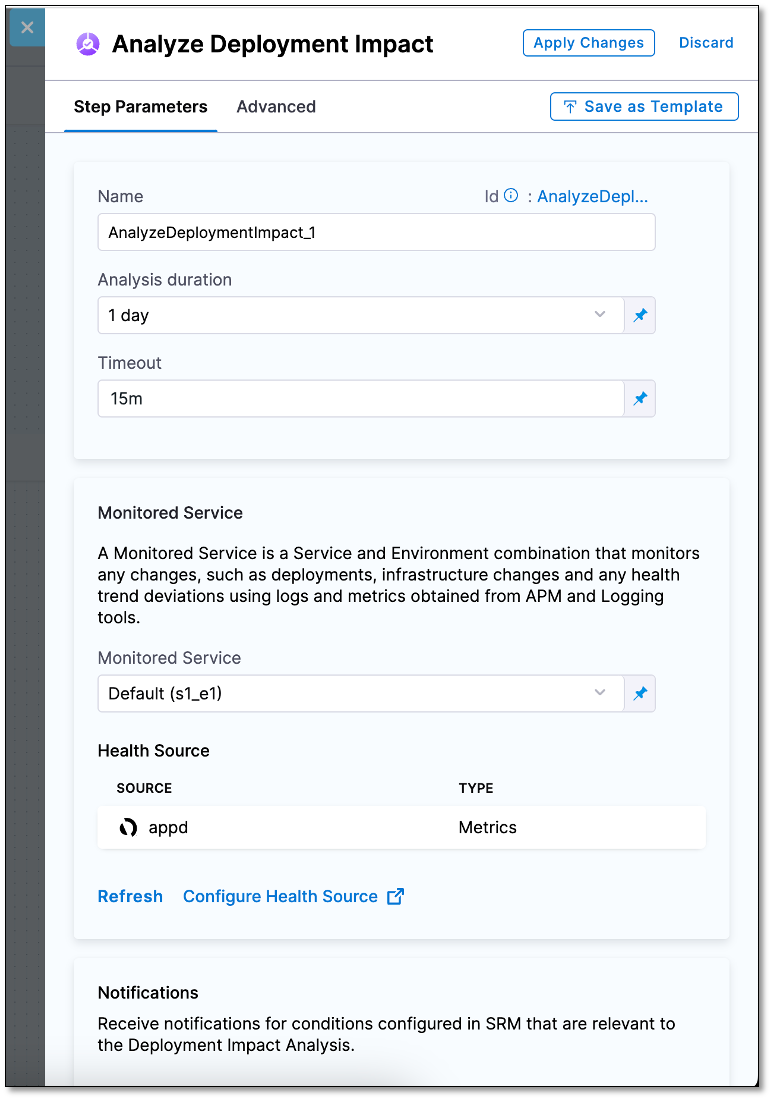
Following are the steps to configure the Analyze Deployment Impact step settings:
-
On the Analyze Deployment Impact settings page, go to the Step Parameters tab, and do the following:
-
Name: Harness automatically assigns a name for the Analyze Deployment Impact step. For example, if you are adding the Analyze Deployment Impact step for the first time, the default name would be "AnalyzeDeploymentImpact_1" and if you are adding the Analyze Deployment Impact step for the first time, the default name would be "AnalyzeDeploymentImpact_2".
-
Select how long Harness should run the analysis. The minimum duration is one day, and the maximum duration is 5 days.
-
In Timeout, enter a timeout value for the step. Harness uses this information to time out the analysis. Use the following syntax to define a timeout:
- w for weeks. For example, to define one week, enter 1w.
- d for days. For example, to define 7 days, enter 7d.
- h for hours. For example, to define 24 hours, enter 24h.
- m for minutes, For example, to define 100 minutes, enter 100m.
- s for seconds. For example, to define 500 seconds, enter 500s.
- ms for milliseconds. For example, to define 1000 milliseconds, enter 1000ms.
You can also set timeouts at the pipeline level.
-
Choose a Monitored Service from the dropdown list to assess the impact of your deployment on the service's health.
By default, the dropdown pre-selects the monitored service that corresponds to the service and environment you are currently deploying updates to. However, you can also select a different monitored service from the list if you want to analyze the impact of deployment on the health of that specific monitored service.
Example
Suppose you are deploying updates to your "Payments" monitored service. In the Monitored Service dropdown list, it will be displayed as Default (Payments). This option will already be selected, indicating that Harness analyzes the impact of your deployment on the health of the Payments monitored service for the chosen duration in the Analyze Deployment step.
Now, let's say you want to assess how your deployment might affect the health of your Checkout monitored service. To do this, simply select Checkout from the dropdown.
When you select a monitored service, the health source and the notifications configured for that monitored service are displayed.
-
Optionally, you can also configure health sources or notifications:
-
Health source: To configure a health source, select the Configure Health Source link. This opens a new tab, taking you to the health source configuration page of the monitored service that you selected. To learn about how to configure a health source, go to Add a health source.
-
Notifications: You can configure notifications for monitored services. Your team receives alerts whenever the deployment pipeline that is associated with the monitored service is executed.
To configure notifications, select the Configure notifications link. This opens a new tab, taking you to the Notifications page of the monitored service that you selected. To learn about how to configure notifications, go to Monitored service notifications.
importantWhen configuring the notification rule, ensure that, on the Conditions page, you select Deployment Impact Analysis from the Conditions dropdown list.
-
-
Select Apply Changes to save the Analyze Deployment Impact step settings.
The Analyze Deployment Impact step is added to the deployment.
View Analyze Deployment Impact step results
When you run the deployment pipeline, Harness runs the Analyze Deployment Impact step and generates results.
When the Analyze Deployment Impact step is running, the status is displayed as Running. You can select Abort to stop the step.
To view the Analyze Deployment Impact step results for a pipeline:
-
Go to the pipeline from which you want to access the Impact Analysis Report.
-
In the top right corner, select Execution History, and from the pipeline executions list, choose the execution for which you want to see the Analyze Deployment Impact step results.
-
Ensure that the** Console View** toggle switch is turned ON.
-
From the stages list, expand the stage in which you want to see the Analyze Deployment Impact results.
The Details page on the right displays the following details:
-
Information such as the start and end times of the Analyze Deployment Impact step, its duration, and its status. The status can be Running, Completed, or Aborted.
-
View Monitored Service Details link. Clicking the View Monitored Service Details link opens a new tab, navigates you to the monitored service selected in the Analyze Deployment Impact step, and displays the Impact Analysis Report.
-

View Impact Analysis Report
To access and interpret the Impact Analysis Report generated by the Analyze Deployment Impact step, follow these steps:
- Go to the pipeline from which you want to access the Impact Analysis Report.
You must have added Analyze Deployment Impact step.
-
In the top right corner, select Execution History. From the list of pipeline executions, select the execution you're interested in to access the Impact Analysis Report.
-
Ensure that the Console View toggle switch is turned ON.
-
From the list of stages, expand the stage where you want to access the Impact Analysis Report, and then, select the Analyze Deployment Impact step.
Anaylyze Deployment Impact details appear on the right.
-
Select the View Monitored Service details link. Clicking the link opens a new tab. It automatically navigates you to the monitored service selected in the Analyze Deployment Impact step and displays the Impact Analysis Report.
You can also view the Impact Analysis Report directly for the monitored service.
To view the Impact Analysis Report:
-
In your Harness project, navigate to the Service Reliability Management module, and then select Monitored Services.
A list of all monitored services appears. -
Select Choose the monitored service that corresponds to the one selected in the Analyze Deployment Impact step.
-
Select the Change Impact tab. The Reports section displays a list of deployment analyses, each displaying details such as the name, date and time of the analysis, its status, and the associated deployment pipeline.
-
Select the specific deployment analysis for which you wish to view the Impact Analysis Report. The Impact Analysis Card is displayed.
