Changes dashboard
The Changes dashboard provides a quick overview of change events from multiple change sources. A change source is a system that generates change events whenever a change is recorded. Change events are grouped in one location, enabling you to see how a certain change affects the rest of the system.
The Changes dashboard helps you understand when the change occurred, why it took place, and what impact it had on the health of the monitored service.
Perform the following step to go to the Changes dashboard:
- In your Harness project, navigate to the Service Reliability module, and then select Changes.
The Changes dashboard appears.
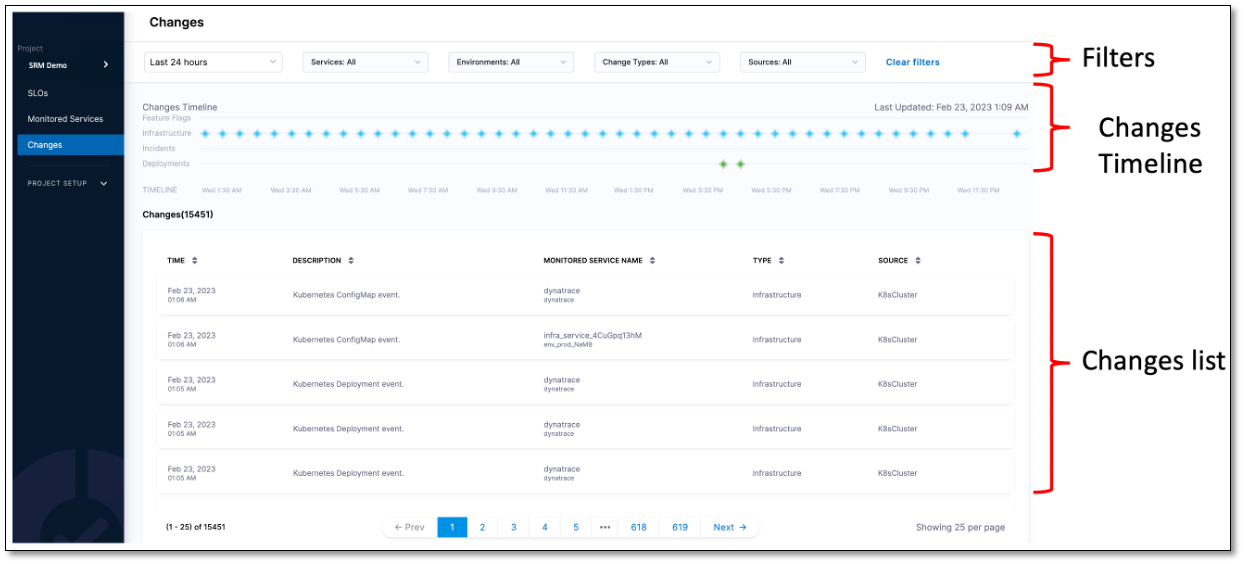
The Changes dashboard is divided into the following sections:
- Filters
- Changes Timeline
- Changes list

Filters
You can customize the Changes dashboard by using the following filters:
- Time Range: Select the time period for which you want to see change events. The available filters are Last 4 hours, Last 24 hours, Last 3 days, Last 7 days, and Last month.
- Services: Select the monitored service for which you want to see changes. You can select multiple monitored services.
- Environments: Select the environment for which you want to see changes. You can select multiple environments.
- Change Types: Select the type of change source for which you want to see changes. The available filters are Deployment, Infrastructure, Incidents, Feature Flags, and Chaos Experiment.
- Sources: Select the source for which you want to see changes. For example, Harness CD NextGen, Harness CD, Kubernetes, PagerDuty, Harness FF (Harness Feature Flag), and Harness CE (Harness Chaos Experiment). You can select multiple change sources.
Changes timeline
The Changes Timeline section shows a graphical representation of all the changes that occurred. The graph displays the information based on the filter settings.
You can hover over a change event icon to see the details.

To view the change details for a specific time slot, select the time slot on the Changes timeline. A time window appears with the details of all the changes that occurred in that specific time slot. You can change the time slot by using the handles.

Changes list
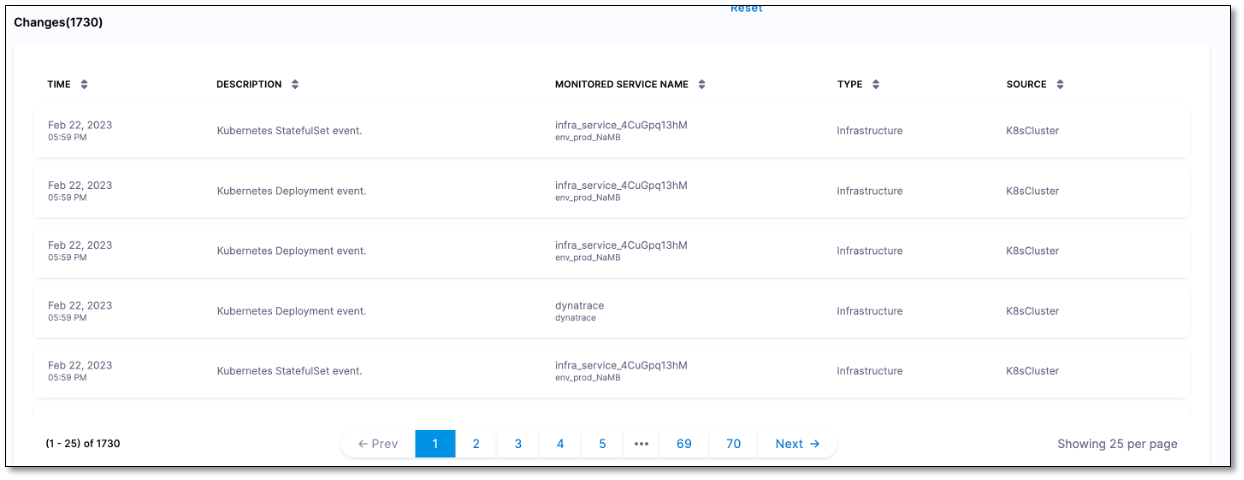
The Changes list displays all the change events along with the following details:
- TIME: Time at which the event occurred.
- DESCRIPTION: Description of the event. For example, Kubernetes ConfigMap event.
- MONITORED SERVICE NAME: Name of the monitored service associated with the event.
- TYPE: Type of the change source. For example, infrastructure.
- SOURCE: Name of the change source. For example, K8sCluster.

View change event details
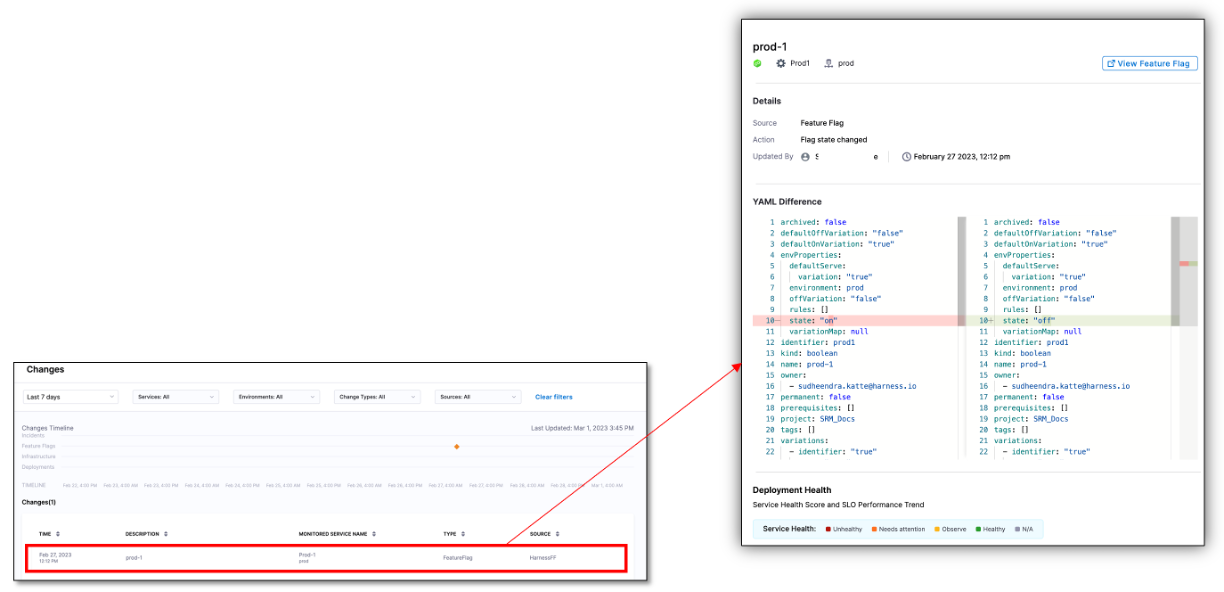
Select a change event to see its details.
The change event details screen appears. It displays the following details:
- Name of the service, environment, source, and event type.
- Time and date at which the event was triggered.
- YAML file for the event.
- Service Health score timeline displaying the health of the service.
- Current and previous YAML files for the event.
You can hover over the timeline to view the change event details.
