Configure ServiceNow as a change source
You can configure ServiceNow as a custom change source to monitor incidents.
To configure ServiceNow as a change source, do the following:
Add ServiceNow as a change source
To add ServiceNow as a change source to a monitored service, do the following:
-
In your Harness project, go to Service Reliability > Monitored Services.
A list of monitored services is displayed. -
Find the monitored service to which you want to add a custom change source, select More Options (⋮) next to it, and then select Edit service.
The Configurations page appears. -
On the Configurations page, go to Change Sources, and then select + Add New Change Source.
-
On the Edit Change Source page, under Select Change Source, choose Incident as Provider Type, and then select Custom.
-
Enter a name for the new change source. For example, ServiceNow.
-
Select Submit.
The custom incident change source is added to the monitored service. A webhook URL and cURL commands are generated.
Copy webhook URL
You need a webhook for configuration in ServiceNow. ServiceNow utilizes this webhook to send incident alerts to the monitored service in Harness SRM.
To copy the webhook URL from the monitored service, do the following:
-
From the list of monitored services, select the specific monitored service where you have added the ServiceNow incident change source.
-
Navigate to the Configuration tab.
-
In the Configurations tab, go to the Change Sources tab.
-
In the Change Sources section, a list of change sources that have been added to the monitored service is displayed. The webhook URL and cURL commands are displayed alongside the corresponding monitored services.
-
Locate the ServiceNow incident change source that you want to configure with ServiceNow, and then copy the webhook URL associated with the change source.
Integrate Harness webhook with ServiceNow
You need to integrate the webhook you created in Harness SRM with ServiceNow to start receiving the incident alerts. This involves setting up the incident format, creating a business rule with correct conditions, and adding the Harness webhook to your ServiceNow account.
To receive incident alerts in ServiceNow using the webhook created in Harness SRM, follow these steps:
Create an incident record in ServiceNow
To create an incident record in ServiceNow, do the following:
-
In your ServiceNow account, navigate to All > Incident, and then select New. You can also select New from the Incident list view.
-
On the form, fill in the following fields:
-
service: Affected business service.
-
short_description: A brief description of the incident.
-
description: Detailed explanation of the incident.
-
environment: You need to add this field manually in the form.
-
To learn more, go to Create an incident.
Create a business rule in ServiceNow
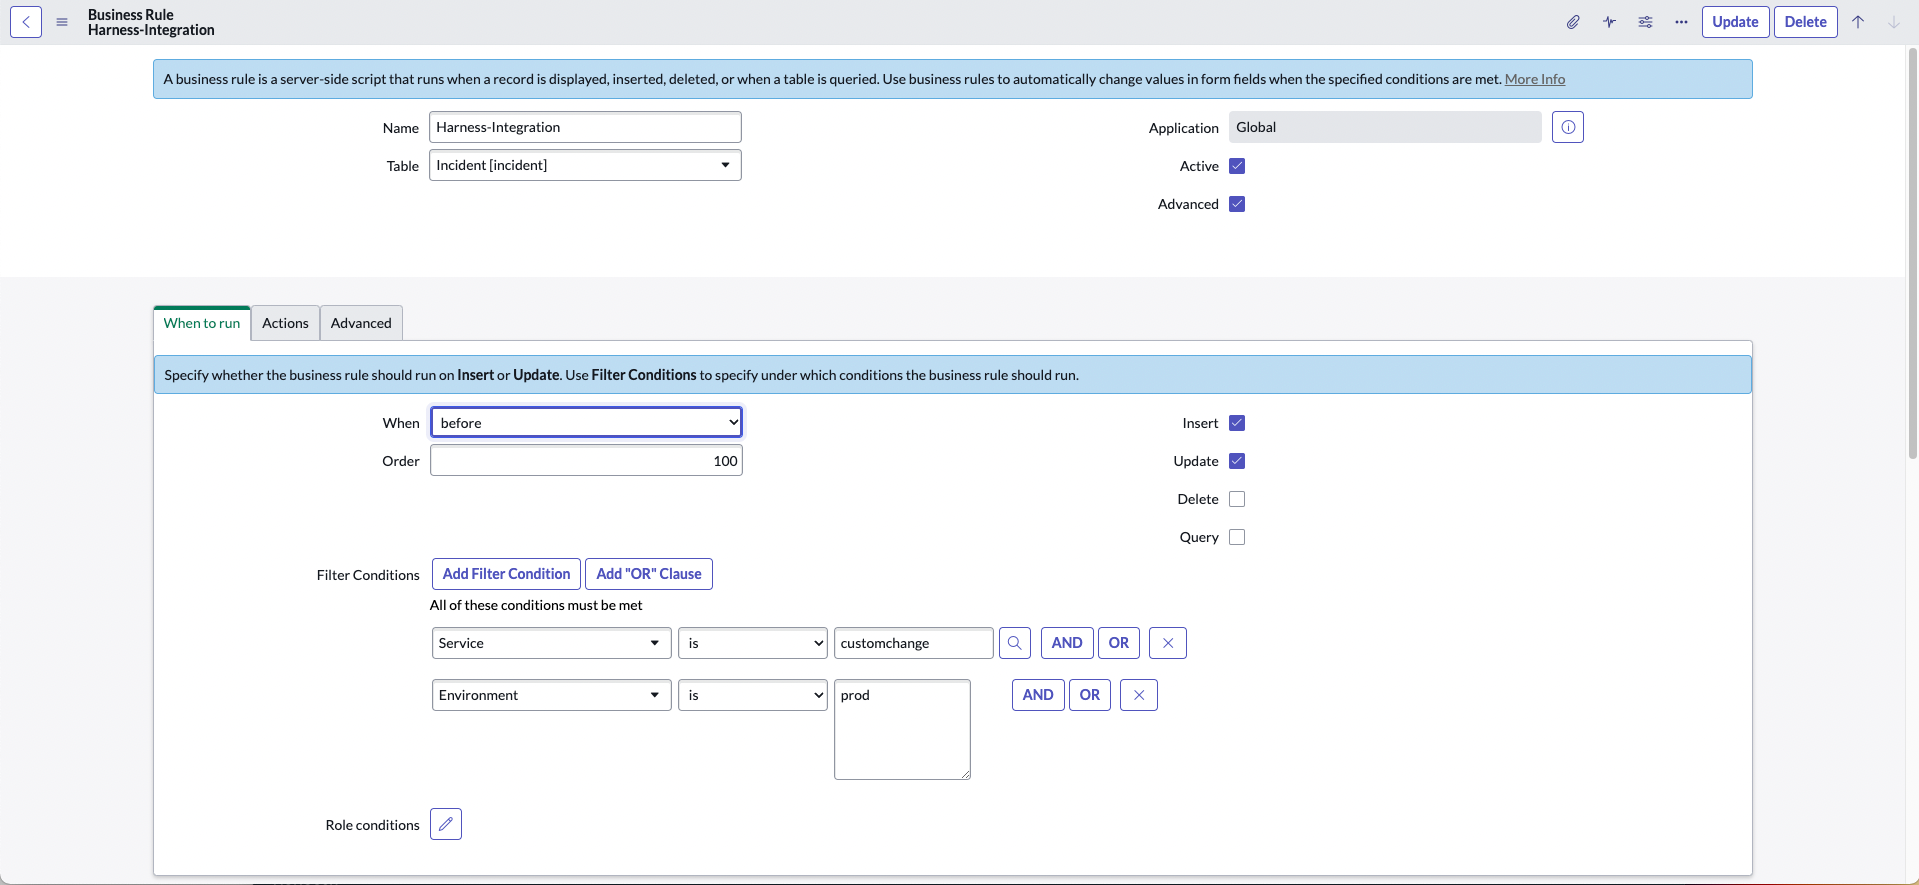
A business rule is essential to define trigger conditions and configure the Harness webhook in ServiceNow. Below are the steps to create a business rule that meets the requirements to use ServiceNow as a custom change source in Harness SRM.
-
In your ServiceNow account, navigate to System Definition > Business Rules, and then select New.
The settings page appears.
-
In the When to run tab, set the conditions for the business rule. Ensure it includes the following conditions:
-
When: Specify when the rule should execute: "display", "before", "async", or "after" the database operation is complete.
-
On which Operations: Determine on which database operations the rule should execute.
-
Conditions: Define the conditions that must be met for the rule to execute.
-
-
In the Advanced tab, write a script to configure the webhook URL that you copied in Harness SRM. Below is a sample script that you can modify according to your specific requirements:
Expand to view the sample script for the ServiceNow business rule.
(function executeRule(current, previous /*null when async*/ ) {
try {
   var r = new sn_ws.RESTMessageV2();
   r.setEndpoint("Harness webhook");
   r.setHttpMethod("post");
   r.setRequestHeader("content-type","application/json");
   r.setRequestHeader("X-Api-Key","Harness x-api-key");

   //Mandatory Variables
   var number = current.getValue("number");
   var user = current.getValue("sys_created_by");
   var created_at = current.getValue("sys_created_on");
   var long_created_at = new GlideDateTime(created_at).getNumericValue();
   var name = current.getValue("short_description");
   var description = current.getValue("description");
   var instanceURL = gs.getProperty('glide.servlet.uri');
   var link = instanceURL + current.getLink();
   //var service = current.getValue("service");
   //var environment = current.getValue("u_environment");

   var obj = {
      "eventIdentifier": number,
         "user": user,
         "startTime": long_created_at,
      "endTime": long_created_at,
         "eventDetail":{
         "description": description,
         "externalLinkToEntity": link,
         "name": name
      }
   };

   var body = JSON.stringify(obj);
   gs.info("Webhook body: " + body);
   r.setRequestBody(body);

   var response = r.execute();
   var httpStatus = response.getStatusCode();
} catch (ex) {
   var message = ex.message;
   gs.error("Error message: " + message);
}

gs.info("Webhook target HTTP status response: " + httpStatus);

})(current, previous);
- Save the business rule.
To learn more, go to Create a business rule.
View ServiceNow event in Harness SRM
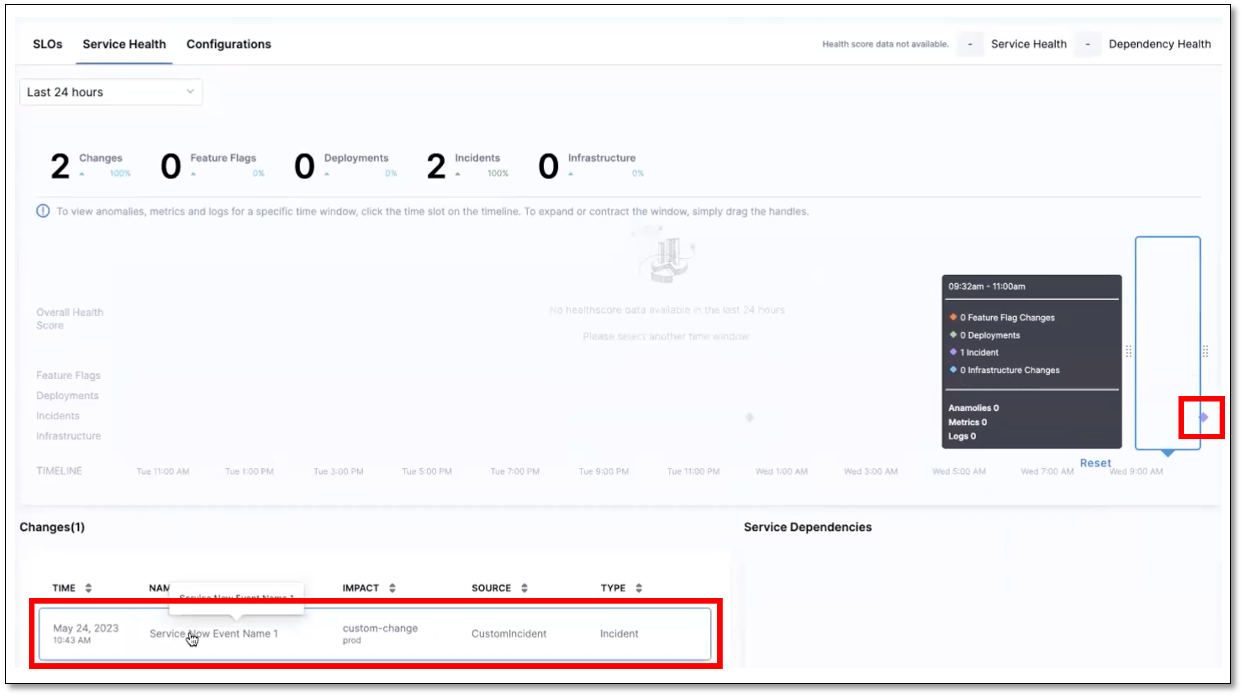
When a ServiceNow incident is triggered, it generates a change event in the Harness monitored service for which you have configured ServiceNow as a custom change source. To view the ServiceNow change event in the Harness monitored service, follow these steps:
-
In your Harness project, go to Service Reliability > Monitored Services.
A list of monitored services is displayed. -
Select the monitored service for which you have configured ServiceNow as a custom change source.
-
Inside the selected monitored service, go to the Change Impact tab. On the Change Impact tab, the following detailed information about the ServiceNow incident is displayed:
-
Time Line Graph: Displays an Incidents line with an event icon. This icon indicates a ServiceNow incident.
-
Changes Section: Lists the ServiceNow incident along with other change incidents.
-

View ServiceNow incident Change card
-
In your Harness project, go to Service Reliability > Monitored Services.
A list of monitored services is displayed. -
Select the monitored service for which you have configured ServiceNow as a custom change source.
-
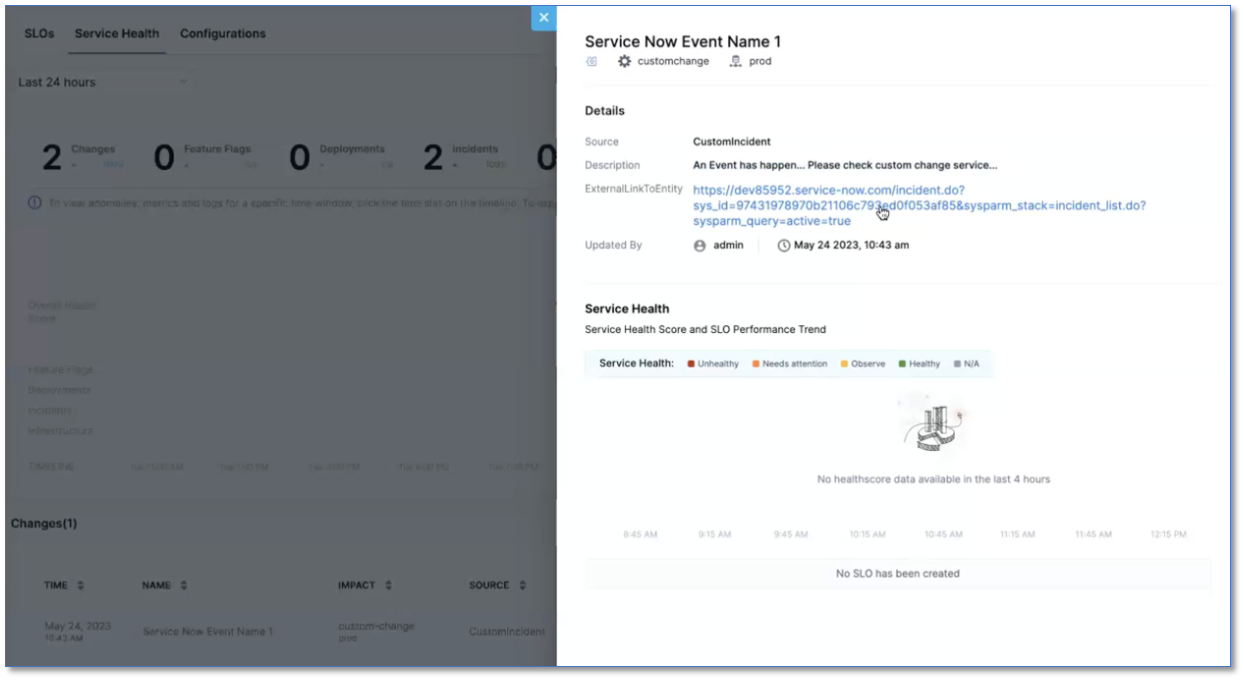
In the Changes section, locate and select the specific ServiceNow incident for which you want to view the Change card. The Change card is displayed with the following information:
-
Source: Information about the source of the incident.
-
Description: A description of the incident.
-
Service health: The impact of the incident on service health.
-
Incident Link: A link that navigates you directly to the incident page in your ServiceNow account for more detailed information.
-
