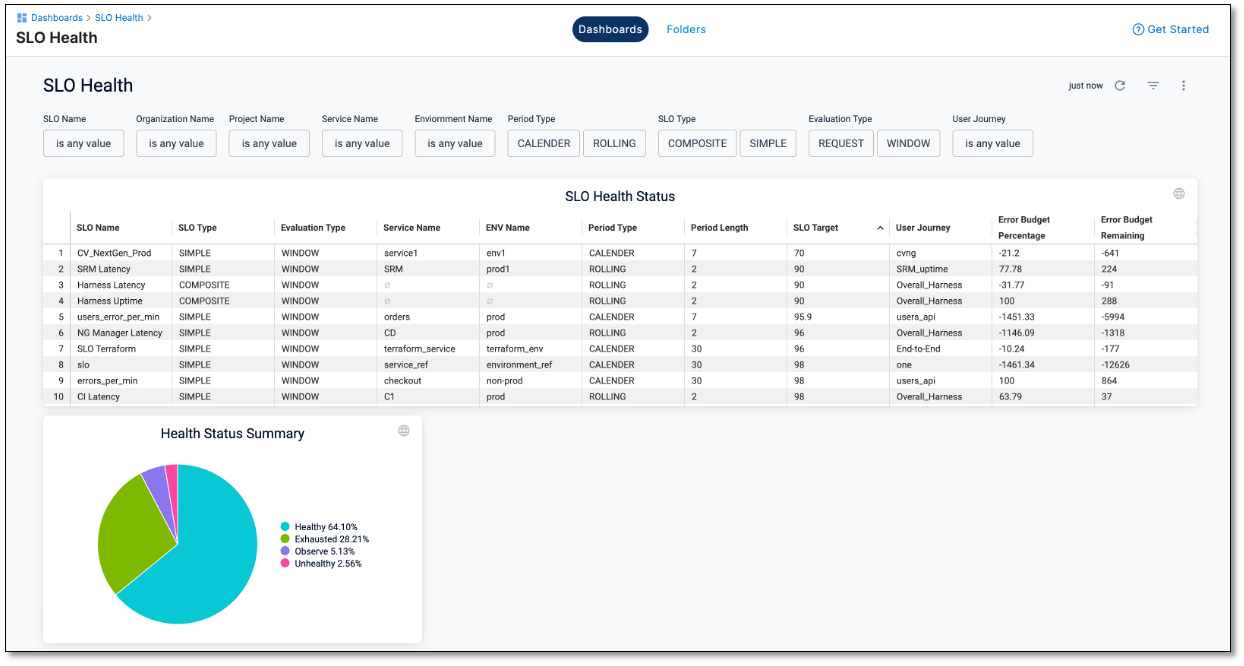
SLO Health dashboard
The SLO Health dashboard, in its default configuration, provides comprehensive insights into all the SLOs within your Harness organization.
View SLO Health dashboard
To access the SLO Health dashboard, do the following:
-
Within your Harness project, navigate to Dashboards. On the Dashboards page, select Service Reliability.
The dashboard list is displayed, which includes the default SLO Health and SLO History dashboards.
-
Select the SLO Health dashboard.
The SLO Health dashboard is displayed.

Explore SLO Health dashboard
SLO Health dashboard consists of the following key components:
SLO Health Status tile
The SLO Health Status tile displays the following information:
-
SLO name: The name of the SLO.
-
SLO type: The type or category of the SLO. For example, simple or composite.
-
Evaluation type: The method used for evaluating the SLO. For example, window or request based.
-
Environment name: The environment where the SLO is applied. For example, production, Terraform, and so on.
-
Service name: The name of the service associated with the SLO.
-
Period length: The duration over which the SLO is measured.
-
Period type: The type of time period for measurement. For example, calendar or rolling.
-
SLO Target: Your set SLO target percentage.
-
SLI percentage: The percentage of Service Level Indicators (SLIs) achieved for the corresponding SLOs. SLIs are specific metrics used to evaluate SLOs.
-
User journey: The specific user journey associated with the SLO.
-
Error budget percentage: The percentage of error budget consumed.
-
Remaining error budget percentage: The remaining portion of the error budget.
You can customize the data displayed in the SLO Health Status tile using filters to focus on specific aspects of your SLO health metrics.
Health Status Summary tile
The Health Status Summary tile provides a visual summary of the data presented in the SLO Health Status tile. It includes:
-
Percentage of SLOs that are healthy, unhealthy, and need attention: This gives you an overall picture of the health status of your SLOs.
-
Percentage of SLOs whose error budgets are exhausted: This is a summary of SLOs that have gone beyond their allocated error budgets.
-
Percentage of SLOs that need observation: This indicates which SLOs require additional monitoring and analysis.