Configure Teams
Teams are the core unit of measurement in AI DLC Insights. Each team represents a leaf node in your Org Tree and serves as the foundation for calculating metrics and surfacing insights across Efficiency, Productivity, and Business Alignment dashboards.
- Deployment Frequency and Change Failure Rate requires a continuous deployment integration.
In this situation, a team manager must select and save both issue management and continuous deployment integrations to proceed on the Teams page or in Team Settings.
- Teams: A list of all teams and their current configurations.
- Definitions: A library of reusable team definition templates that can be applied across multiple teams.
Search and manage teams
The Teams tab lists all teams derived from your Org Tree. You can search teams by selecting By Name, By Manager Name, or By Org Tree Name in the Search Teams dropdown menu.
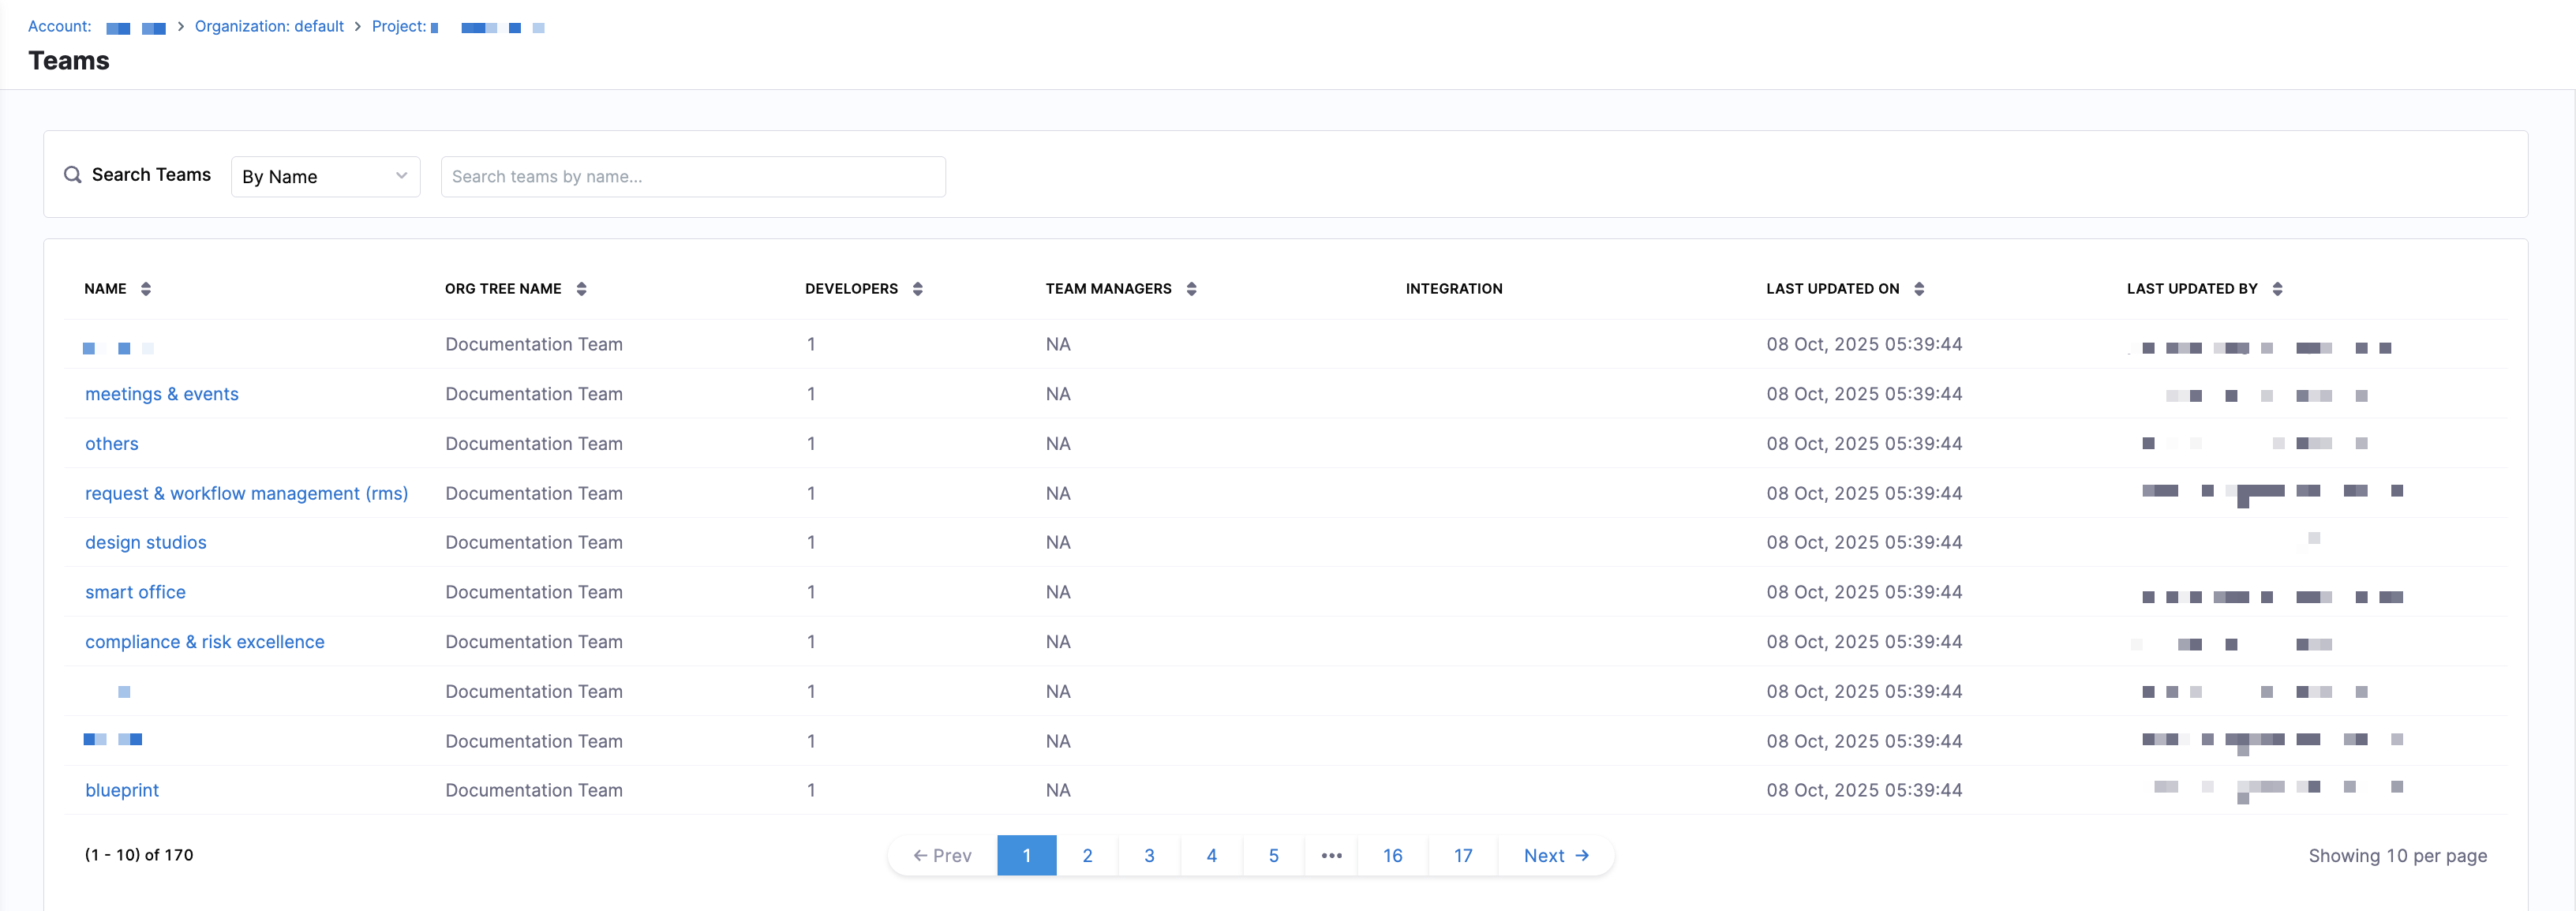
You can see the following details for each team in the list:
| Column | Description |
|---|---|
| Name | Team name. |
| Org Tree Name | Corresponding leaf node in the Org Tree. |
| Developers | Number of developers mapped to the team. |
| Team Managers | Assigned team managers. |
| Integrations | Connected tools used by the team. |
| Last Updated On | Timestamp of the most recent configuration change. |
| Last Updated By | User who last modified the team. |
While teams are automatically derived from your organization's hierarchy, they must be configured to ensure data is attributed correctly and metrics accurately reflect how each team delivers software in AI DLC Insights. To access the Team Settings side panel, click on a team in the list.
 Update a team name on the Details tab in Team Settings.
Optionally, you can access the Team Settings side panel by navigating to a leaf node (team) in the Org Tree and clicking the Team Settings icon on the Insights page. Each team has its own configuration that determines how Insight metrics are calculated.
You can configure multiple source code management (SCM) integrations per team, enabling more accurate insights and metrics across all repositories your team contributes to. This is useful for teams working across GitHub, GitLab, Azure DevOps, Bitbucket, and other supported SCMs.
Search and manage team definitions
The Definitions tab provides a library of reusable team definition templates. Instead of configuring each team individually, you can create a definition once and apply it to multiple teams across your Org Tree. This is helpful for standardizing metric configuration across teams that share the same tools, workflows, or operational context.
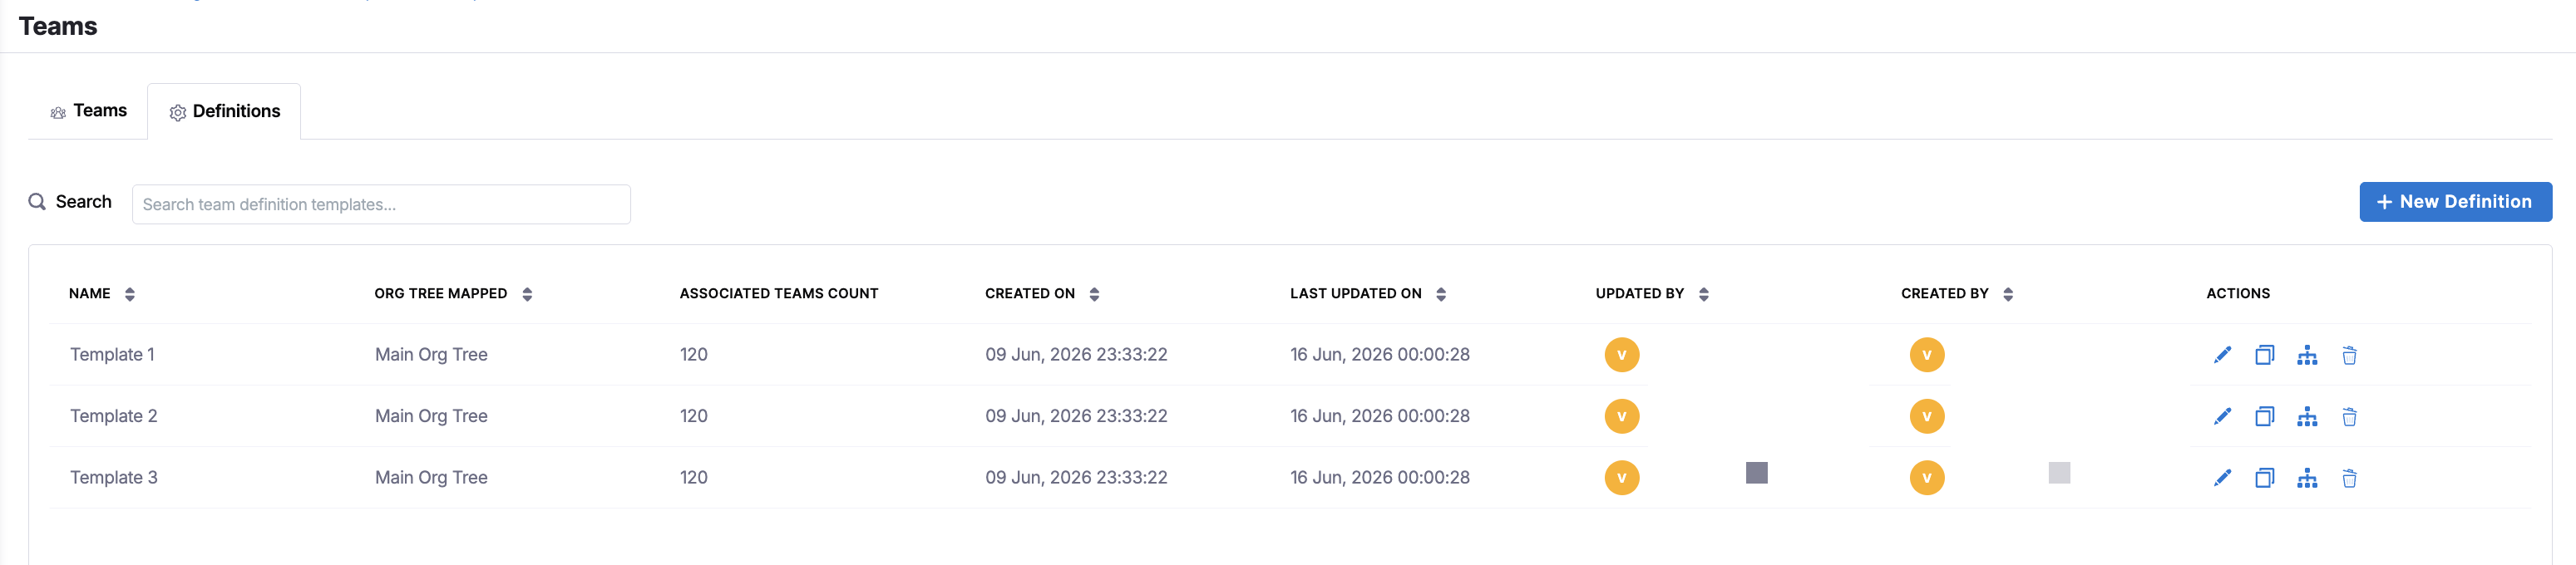
You can see the following details for each definition in the list:
| Column | Description |
|---|---|
| Name | Definition template name. |
| Org Tree Mapped | The Org Tree the definition is associated with. |
| Associated Teams | Number of teams currently using this definition. |
| Created On | Timestamp when the definition was created. |
| Last Updated On | Timestamp of the most recent change. |
| Updated By | User who last modified the definition. |
| Created By | User who originally created the definition. |
| Actions | Available actions for the definition. |
Each definition in the list includes the following actions:
- Edit: Open the definition and modify its configuration.
- Copy: Duplicate the definition to use as a starting point for a new one.
- Associate: Open the Associate Definitions to Teams modal, where you can select one or more teams from your Org Tree to apply the definition to. Search for teams by name, select individual or multiple teams, then click Apply and Save.
- Delete: Permanently remove the definition.
Create a team definition
To create a new definition:
- On the Definitions tab, click + New Definition.
- In the dropdown menu, select the Org Tree the definition should apply to.
- Configure the following settings:
- Integrations: Select the integrations (Issue Management, Source Code Management, Continuous Deployment, Security, Incident Management, and Code Quality) that apply to teams using this definition.
- Developer Settings: Choose which SEI metrics should apply developer filters when computing insights. Available metrics include Lead Time for Changes, Mean Time to Restore (MTTR), Productivity, and AI Insights.
- Issue Management: Define filter sets for project scope, incident tickets, new features, bugs, active work status, and completed work status.
- CD Pipelines: Define filter sets for pipelines and services, successful deployments, and production failures.
- Click Next to proceed to team association.
- In the Org Tree, select the teams you want to associate with this definition. You can search for individual teams or select multiple at once.
- Click Apply and Save.
The definition is now saved and applied to all associated teams. To update which teams use a definition later, use the Associate action from the Definitions list.
Review and update developer identifiers
To measure productivity metrics accurately (e.g., coding days, PR activity), Harness AIDI needs to know which developer performed which action in each tool. This is done by mapping each developer's cloud identities across your integrated systems.
The Developer Records table on the Developers tab in Team Settings includes attributes that determine how a developer was added and whether they belong to the selected team:
Source: Developers added through the API or CSV upload, appear withSource: Developers. Developers added in the UI appear withSource: Manual.Shared: Developers inherited from the team's Org Tree leaf node appear withShared: No. Developers who are not from this team (or Org Tree node) but are manually added because they contribute to the team's work appear withShared: Yes.
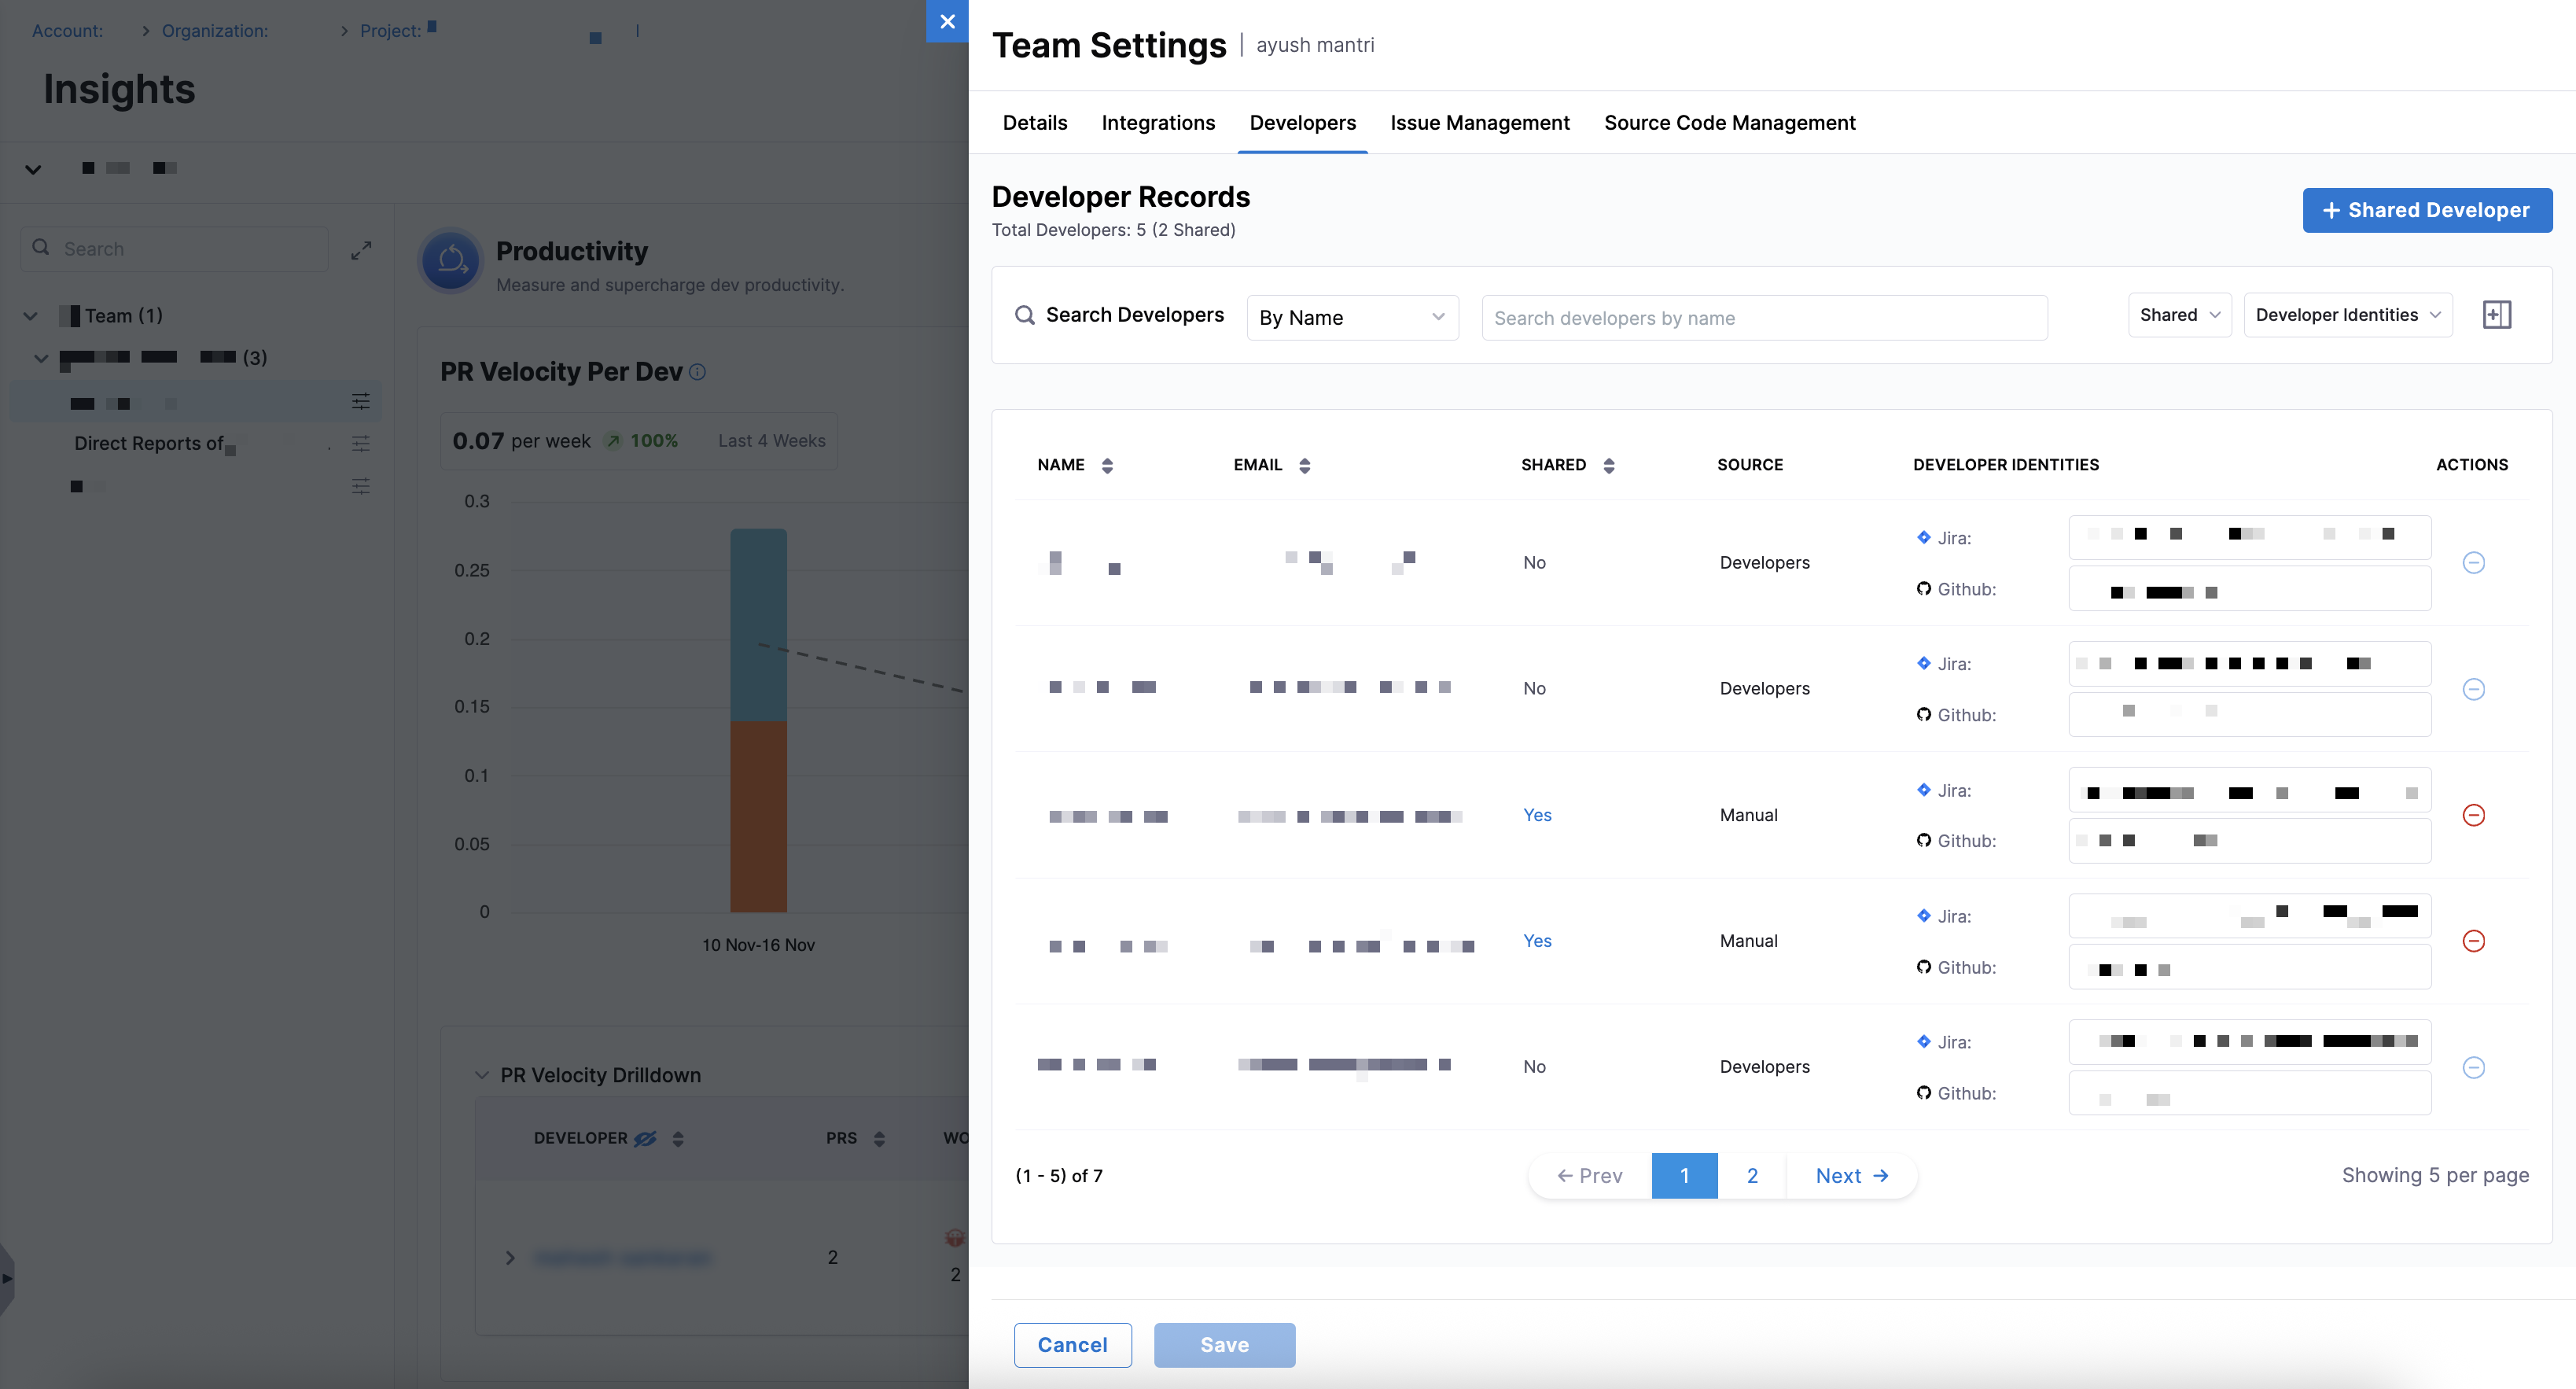
However, some contributors, such as engineering managers or individual developers who regularly contribute across teams, may not belong to the selected team's leaf node in the Org Tree. For these cases, you can add them as shared developers, which appear with Shared: Yes and Source: Manual.
Both automatically added developers and manually added shared developers must have correct identity mappings to ensure the accuracy of DORA, sprint, and productivity metrics.
Developer identities in multiple SCM integrations
When a team is configured with multiple SCM integrations on the Integrations tab, a single developer may be associated with multiple SCM identities on the Developers tab in Team Settings. Each SCM integration contributes its own developer identifier.
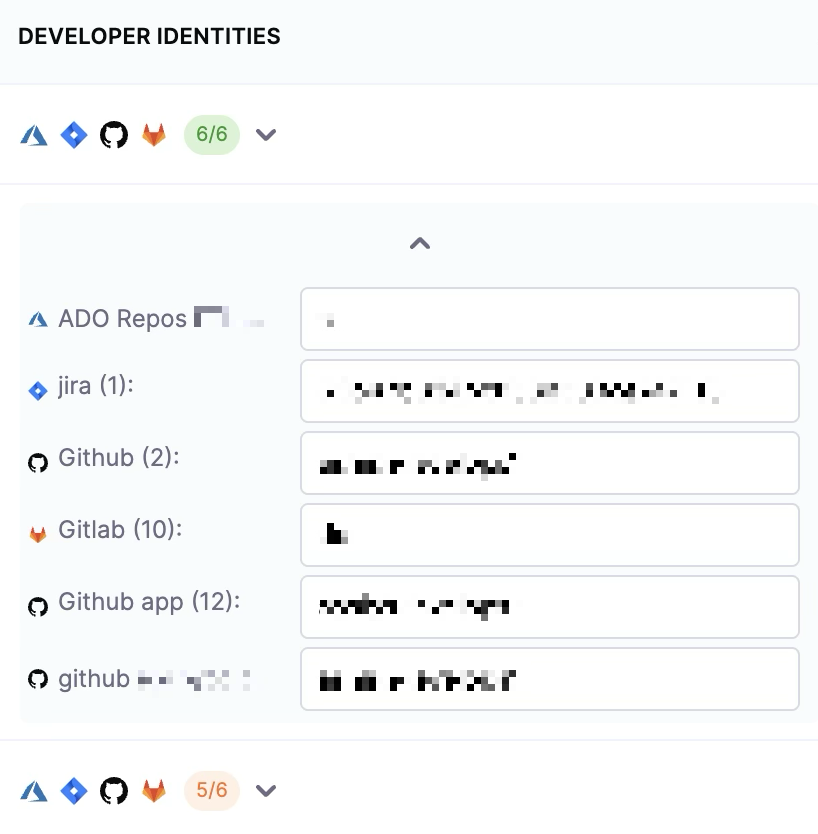
If a developer appears to be missing activity after enabling multiple SCM integrations, verify that all relevant SCM identities are mapped correctly by using the Developer Identities dropdown menu to filter on Missing.

AI DLC Insights uses all mapped identities to attribute commits, pull requests, and repository activity accurately across all selected SCM integrations.
Cloud identifiers by integration
The following table lists each integration along with the type of cloud identifier used and sample values.
| Integration | Identifier Type | Example(s) |
|---|---|---|
| Jira | Account ID | 081de7ae-0631-4474-befe-40064cc640ff, JIRAUSER208441 |
| GitHub | Username | Aaron-Phillips_ver, dp1_mca |
| Azure DevOps | Anh.McFeely@gmfinancial.com | |
| Bitbucket Cloud | Account ID | 0026fd8b-03fd-47ef-9eb9-13c11c27385f |
| Bitbucket Server | steve.madden@crowdstrike.com | |
| Harness Code | lebron.james@harness.io | |
| GitLab | Name | adithya r, aidevops |
This step is mandatory for productivity metrics, and mapping must be kept up-to-date in Team Settings to ensure metrics are accurate. You can automate this step using Auto Identity Discovery, which reduces manual mapping by correlating developer identities across supported integrations.
Managing shared developers
In addition to identity mapping, the Developers tab in Team Settings allows you to add contributors who are not inherited from the Org Tree but still affects the selected team's metrics. While inherited developers appear with Source: Developers and Shared: No, shared developers appear with Source: Manual and Shared: Yes.
Shared developers typically include engineering managers, individual contributors who regularly contribute across teams, and contributors whose commits, PRs, or Jira activity influence the team's insights.
To add a shared developer in the Developers tab:
-
Click + Shared Developer.
-
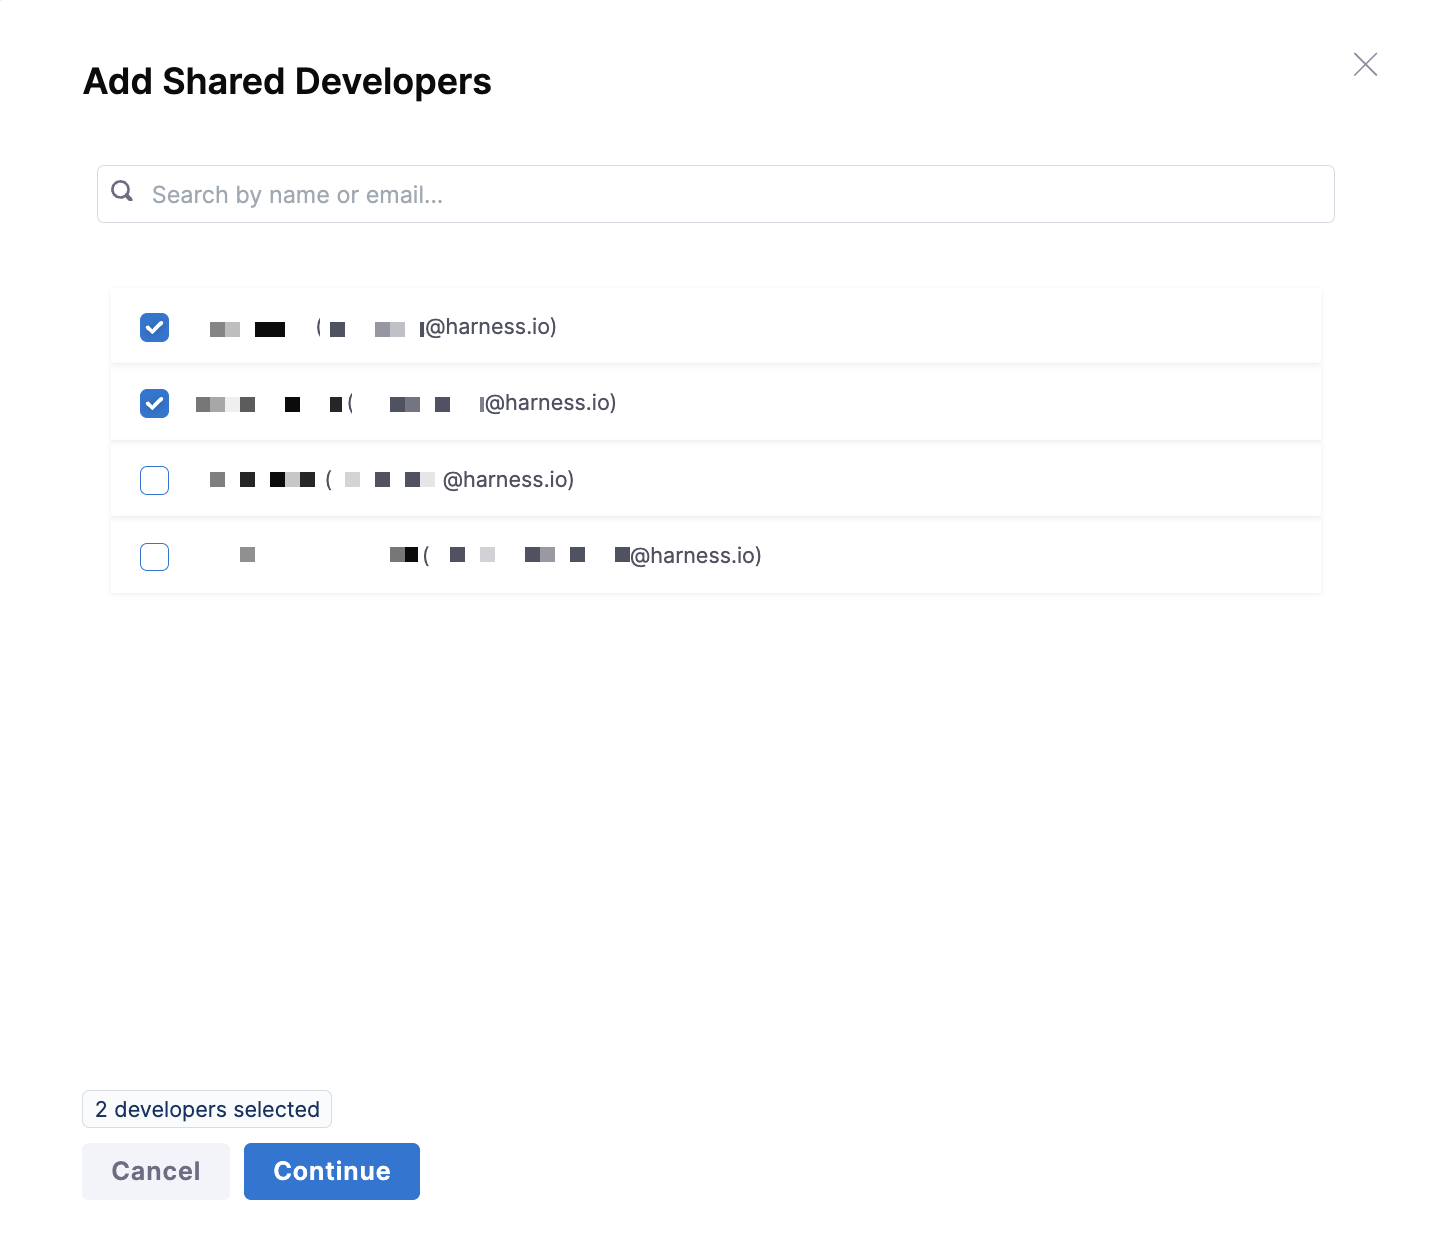
Search by name or email, and select one or more developers.
-
Click Continue.
-
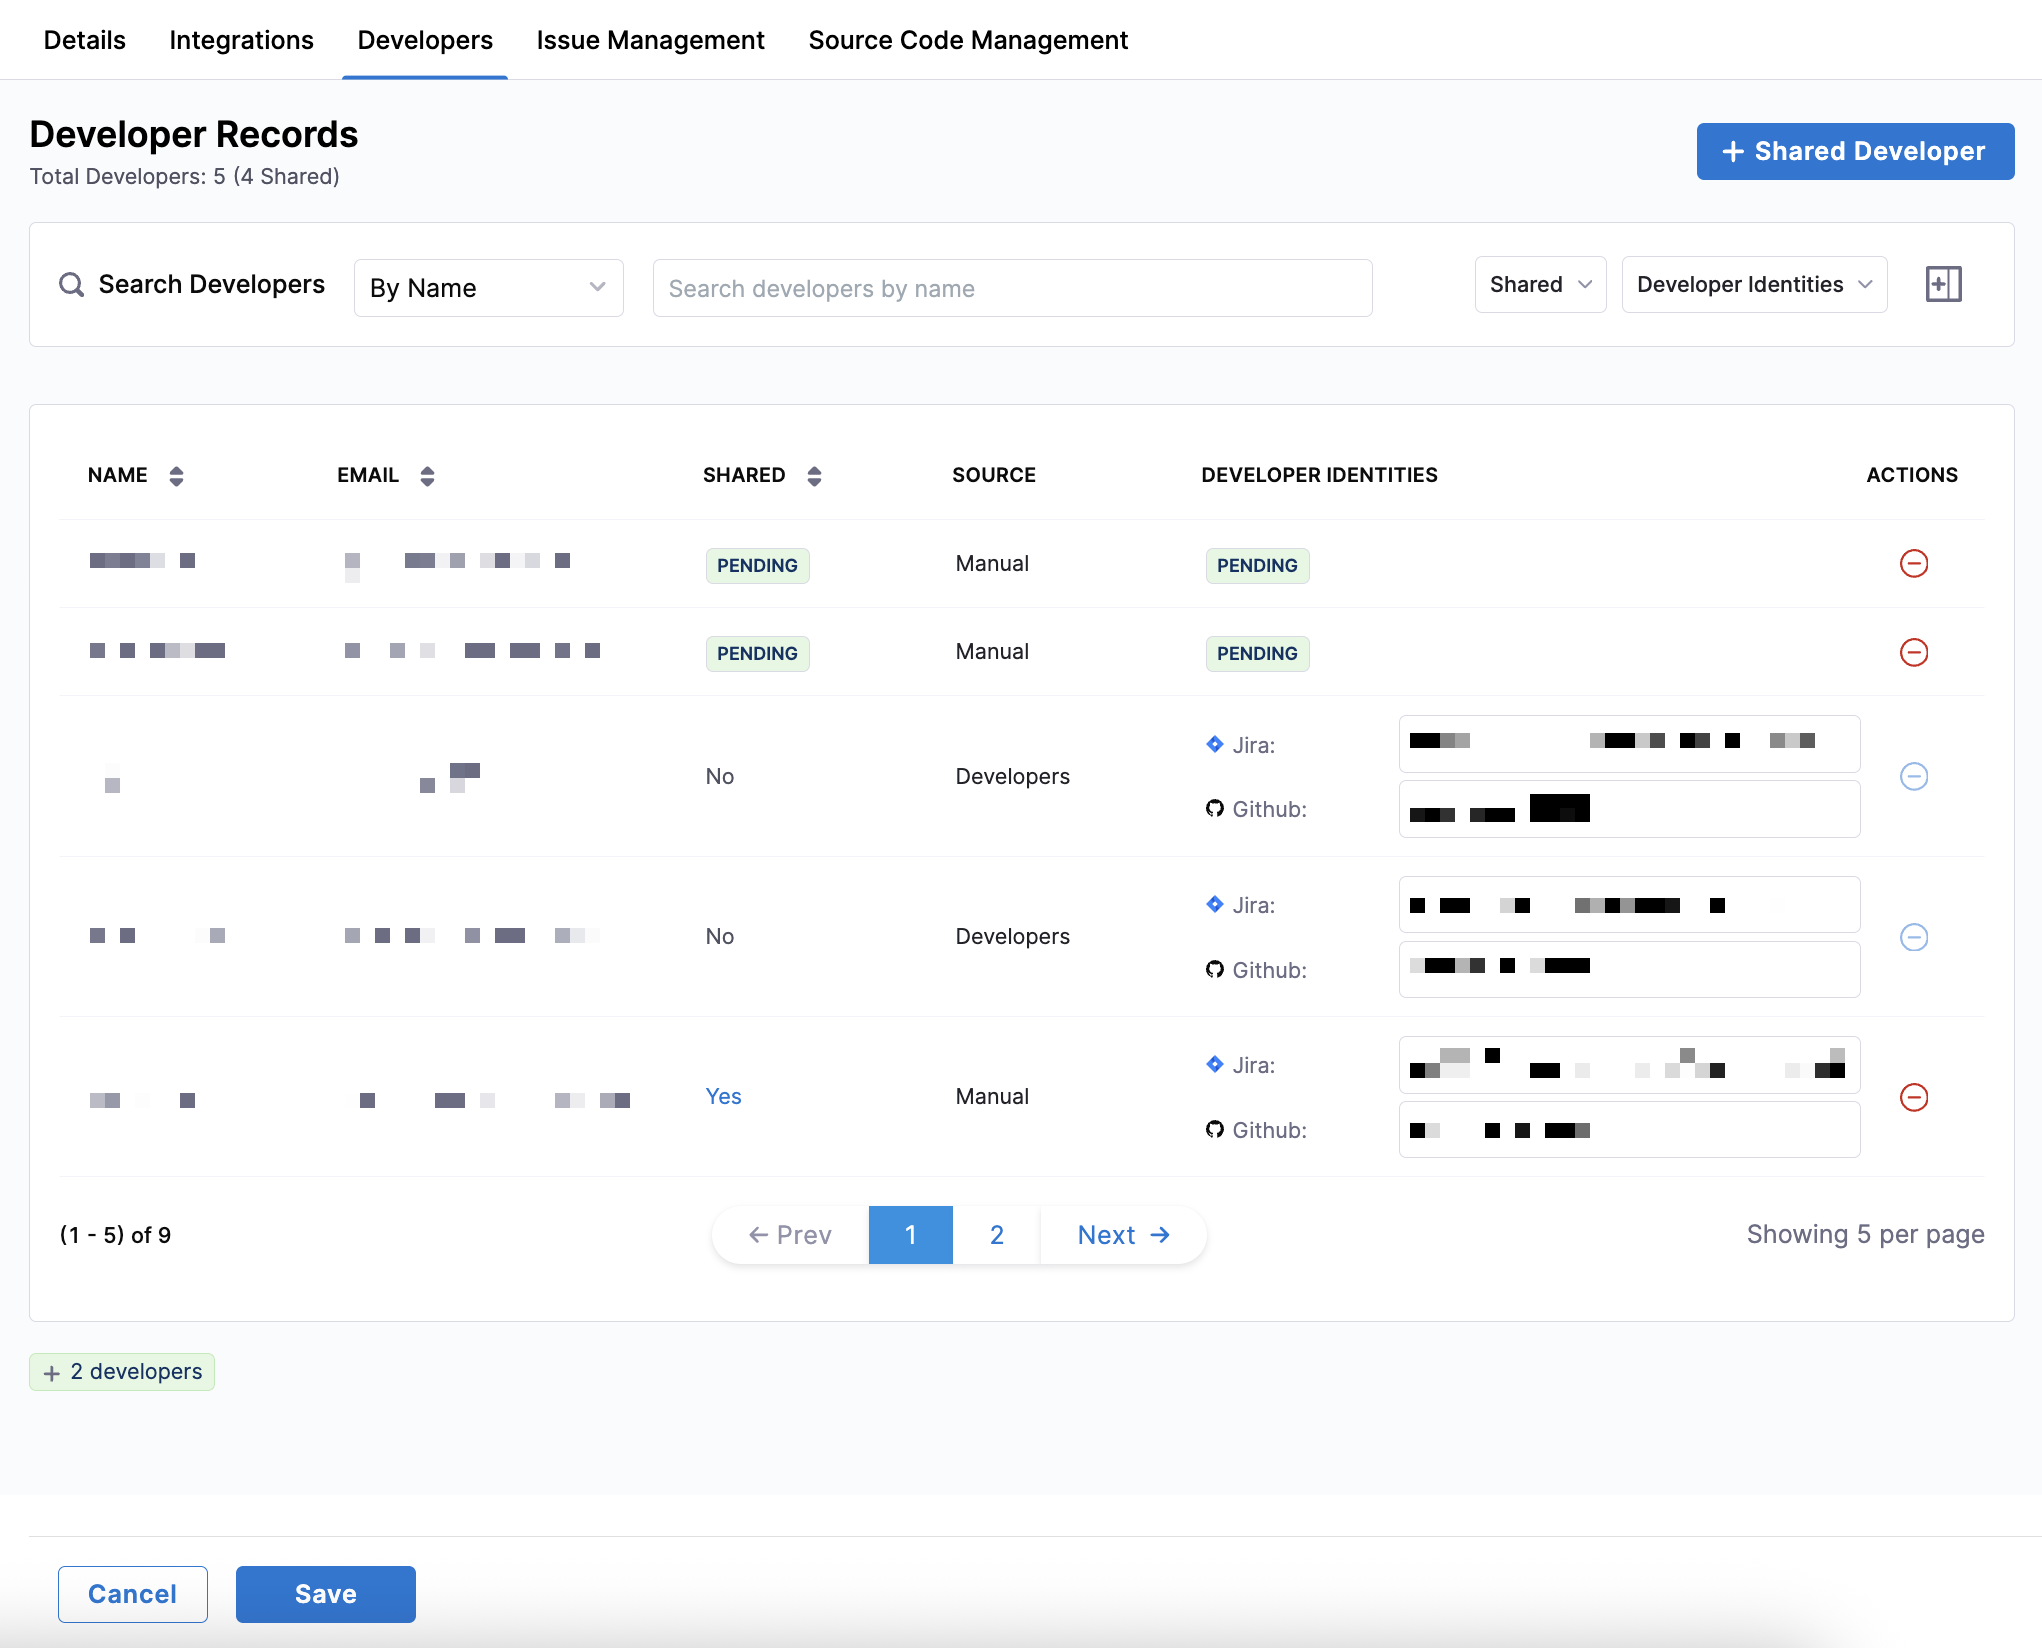
After adding the shared developers, the Developer Records table updates with the following information:
Column Description Name Developer’s full name Email Developer’s email Shared Yes(until identities are matched, status may appearPENDING)Source ManualDeveloper Identities PENDINGuntil cloud IDs are mapped -
To remove a shared developer, click the - icon in the Actions column.
-
Click Save.
When browsing the Developer Records table, you can search for developers by name or email, filter shared developers using the Shared dropdown menu, and use the Developer Identities dropdown menu to show only records with missing or present developer identities.
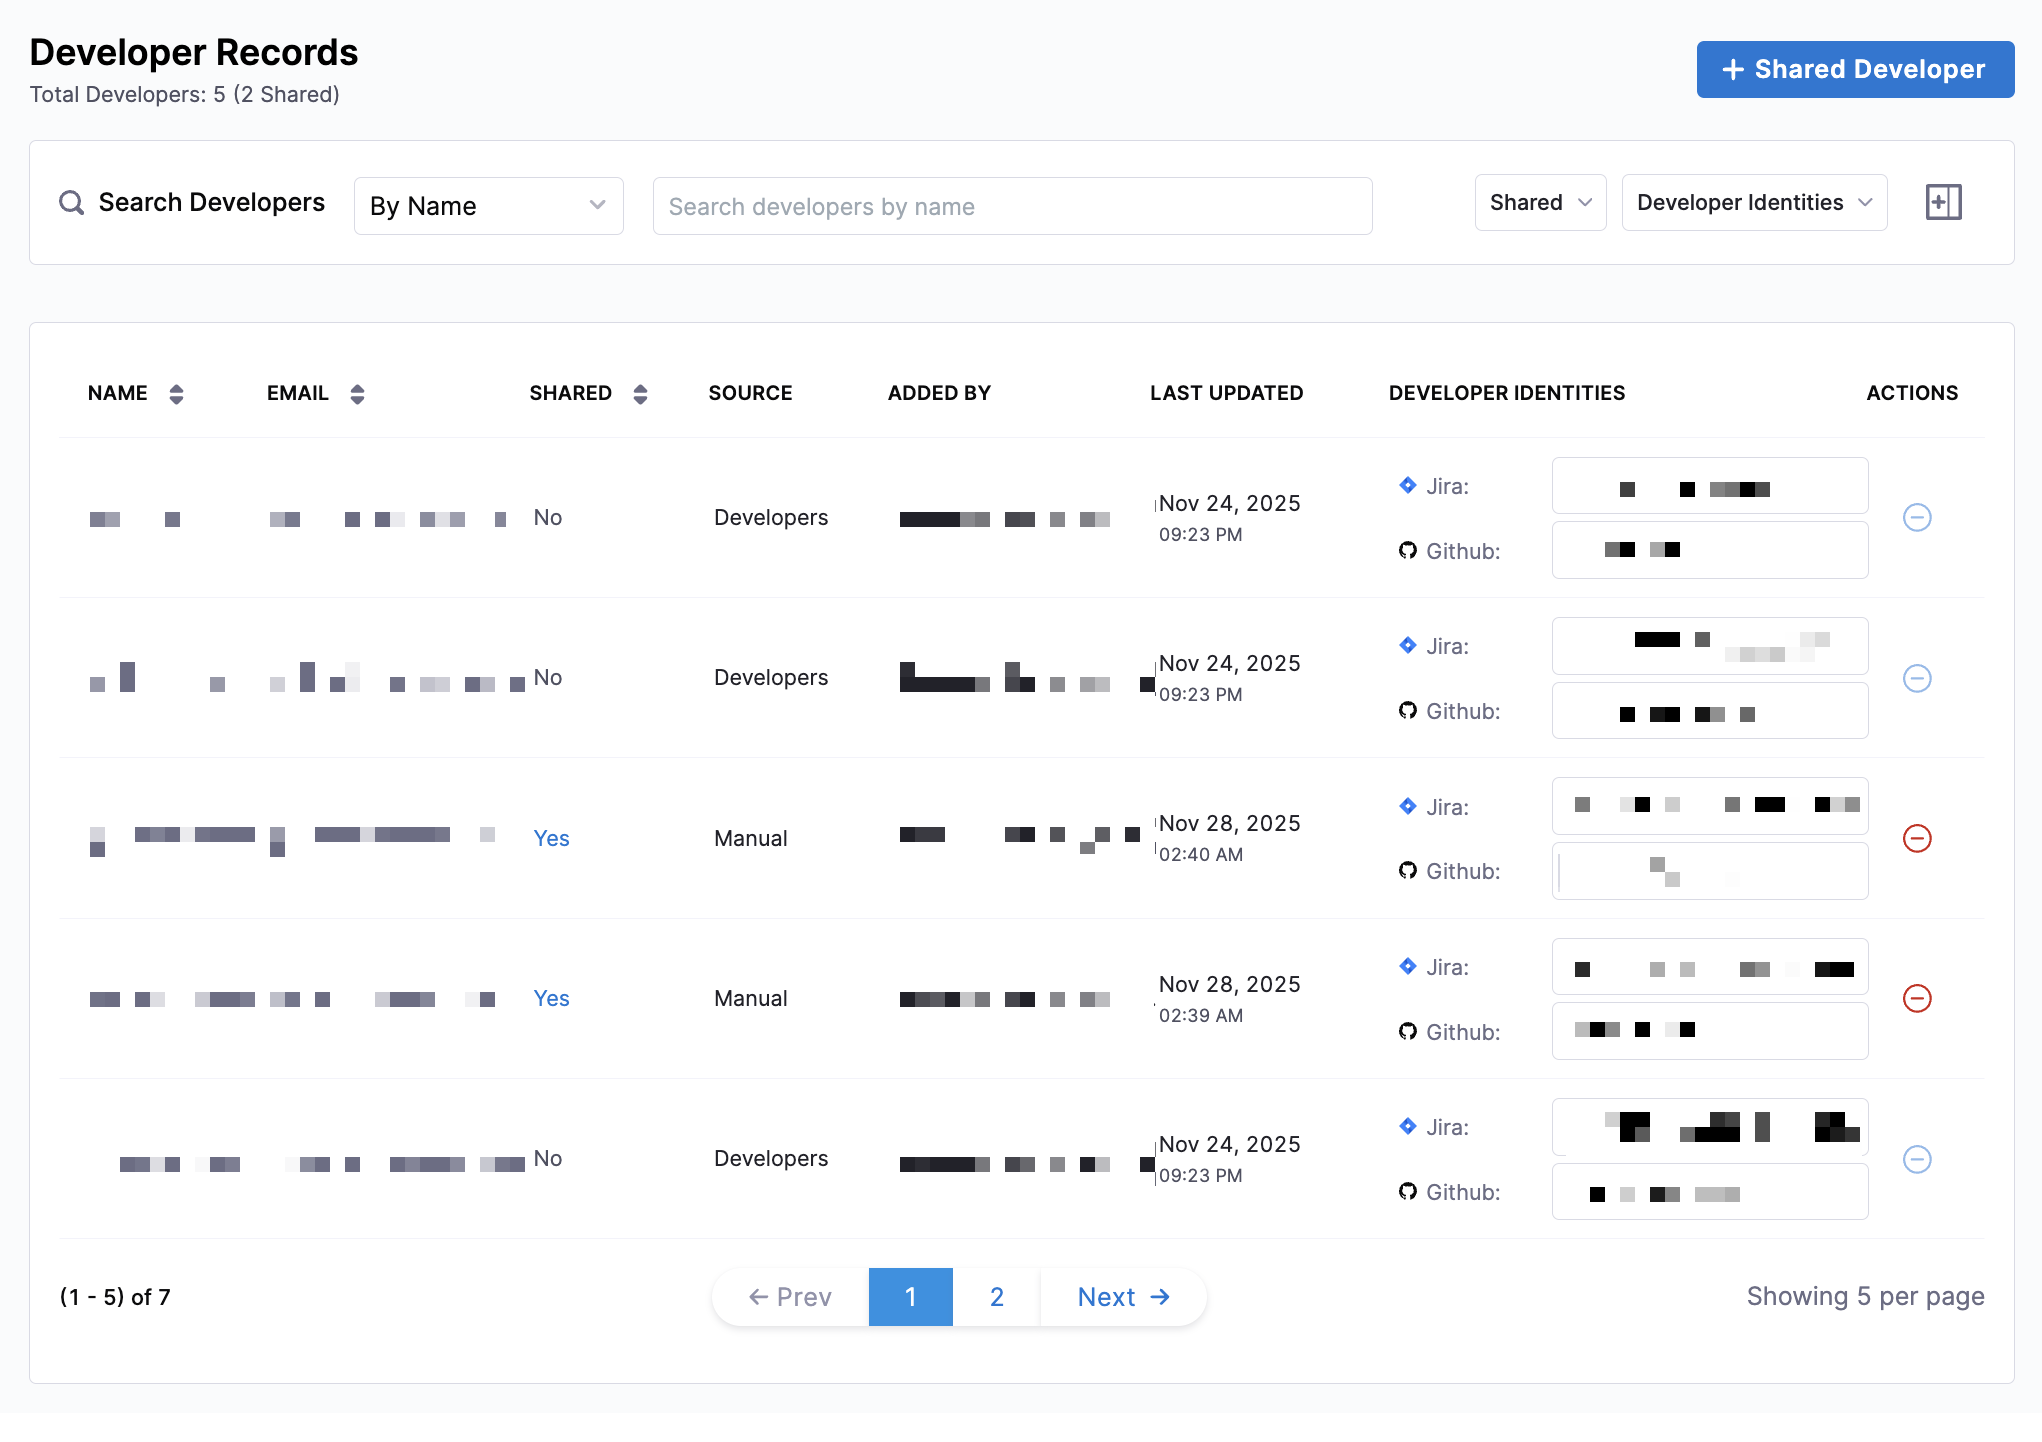
Click the + icon next to the Developer Identities dropdown menu to add additional columns such as Added By (who created the record) and Last Updated (the most recent modification timestamp) to the Developer Records table.
Applying metric-level developer filters
The Advanced Settings section on the Developers tab in Team Settings lets you control which Harness AIDI metrics should honor developer filters for a team. This is useful when contributors such as managers or shared developers work across multiple teams but should only influence specific insights.
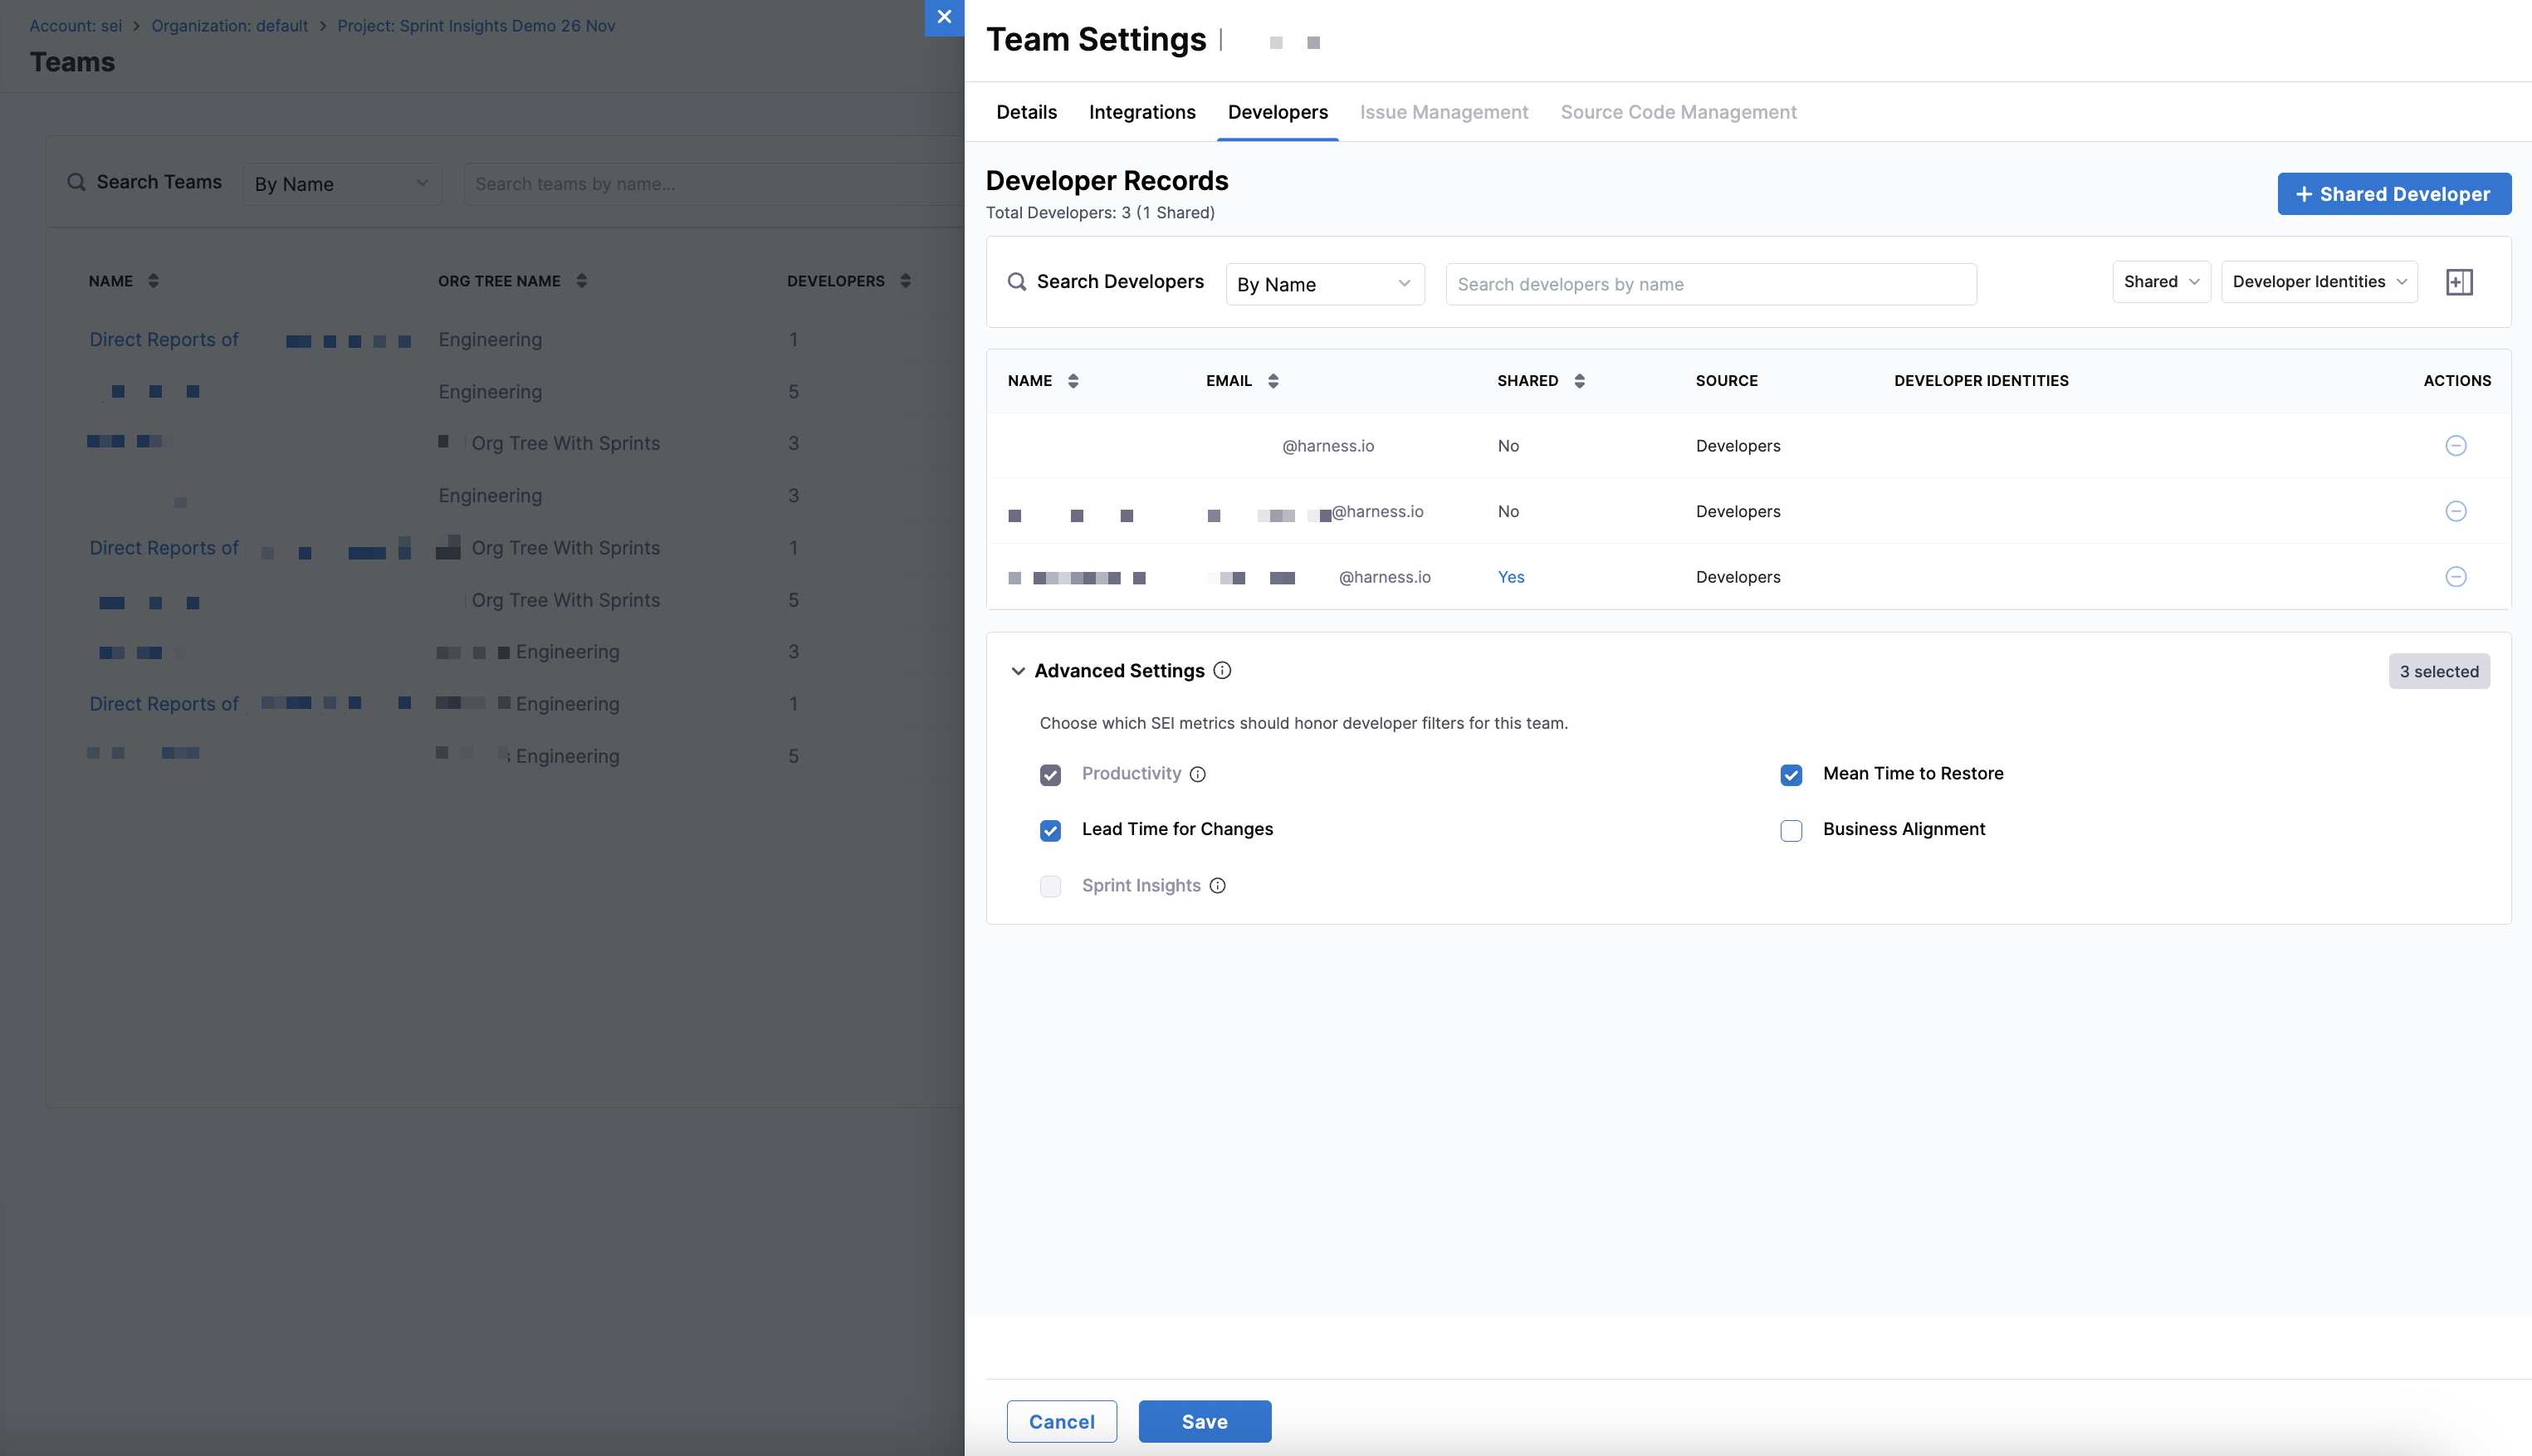
Use this setting to specify which metrics should calculate results only from activity attributed to the developers included in this team, based on developer filters and identity mappings.
- Productivity metrics always honor developer filters by default.
- Lead Time for Changes can be configured to apply or ignore developer filters.
- Only metrics that are enabled in the team’s active SEI profiles appear in Advanced Settings.
To configure metric-level developer filtering:
-
Navigate to the Developers tab in Team Settings.
-
In the Advanced Settings section, select the Harness AIDI metrics that should honor developer filters for this team.
- Productivity: Measures individual and team-level development activity, such as code contributions and work item completion, based on data from your integrated SCM and Issue Management systems.
- Business Alignment: Evaluates how development effort is distributed across business priorities and investment categories, helping ensure engineering work aligns with organizational goals.
- Lead Time for Changes: Measures the time it takes for code changes to move from initial commit to deployment in production, helping teams assess delivery efficiency and flow.
- Mean Time to Restore: Measures how quickly teams recover from production incidents or failures, from detection to resolution, indicating operational resilience.
tipWhen you select a metric, only work attributed to the developers included in this team based on developer filters and identity mappings is used in that metric’s calculation.
Metrics that are not selected continue to use their default attribution logic.
-
Click Save to apply your changes.
Configure integrations for a team
Select the tools your team uses for issue management, source code management, and continuous deployment in the Integrations section of the Team Definition tab in Team Settings. These integrations power how AI DLC Insights attributes data and calculates metrics for the team.
Selecting and saving integrations is required before completing the rest of the team configuration.
The integrations available are determined by the profile applied to the team. For example, an Efficiency profile that measures:
- Lead Time to Change (LTTC) and Mean Time to Restore (MTTR) requires an issue management tool.
- Deployment Frequency and Change Failure Rate requires a continuous deployment integration. In this situation, a team manager must select and save both issue management and continuous deployment integrations to proceed on the Teams page or in Team Settings.
To select integrations:
-
Go to Team Settings and open the Team Definition tab.
-
In the left-side table of contents (TOC), select Integrations.
-
Select integrations from the available categories: Issue Management, Source Code Management, Continuous Deployment, Security, Incident Management, and Code Quality. You can select multiple SCM integrations per team.
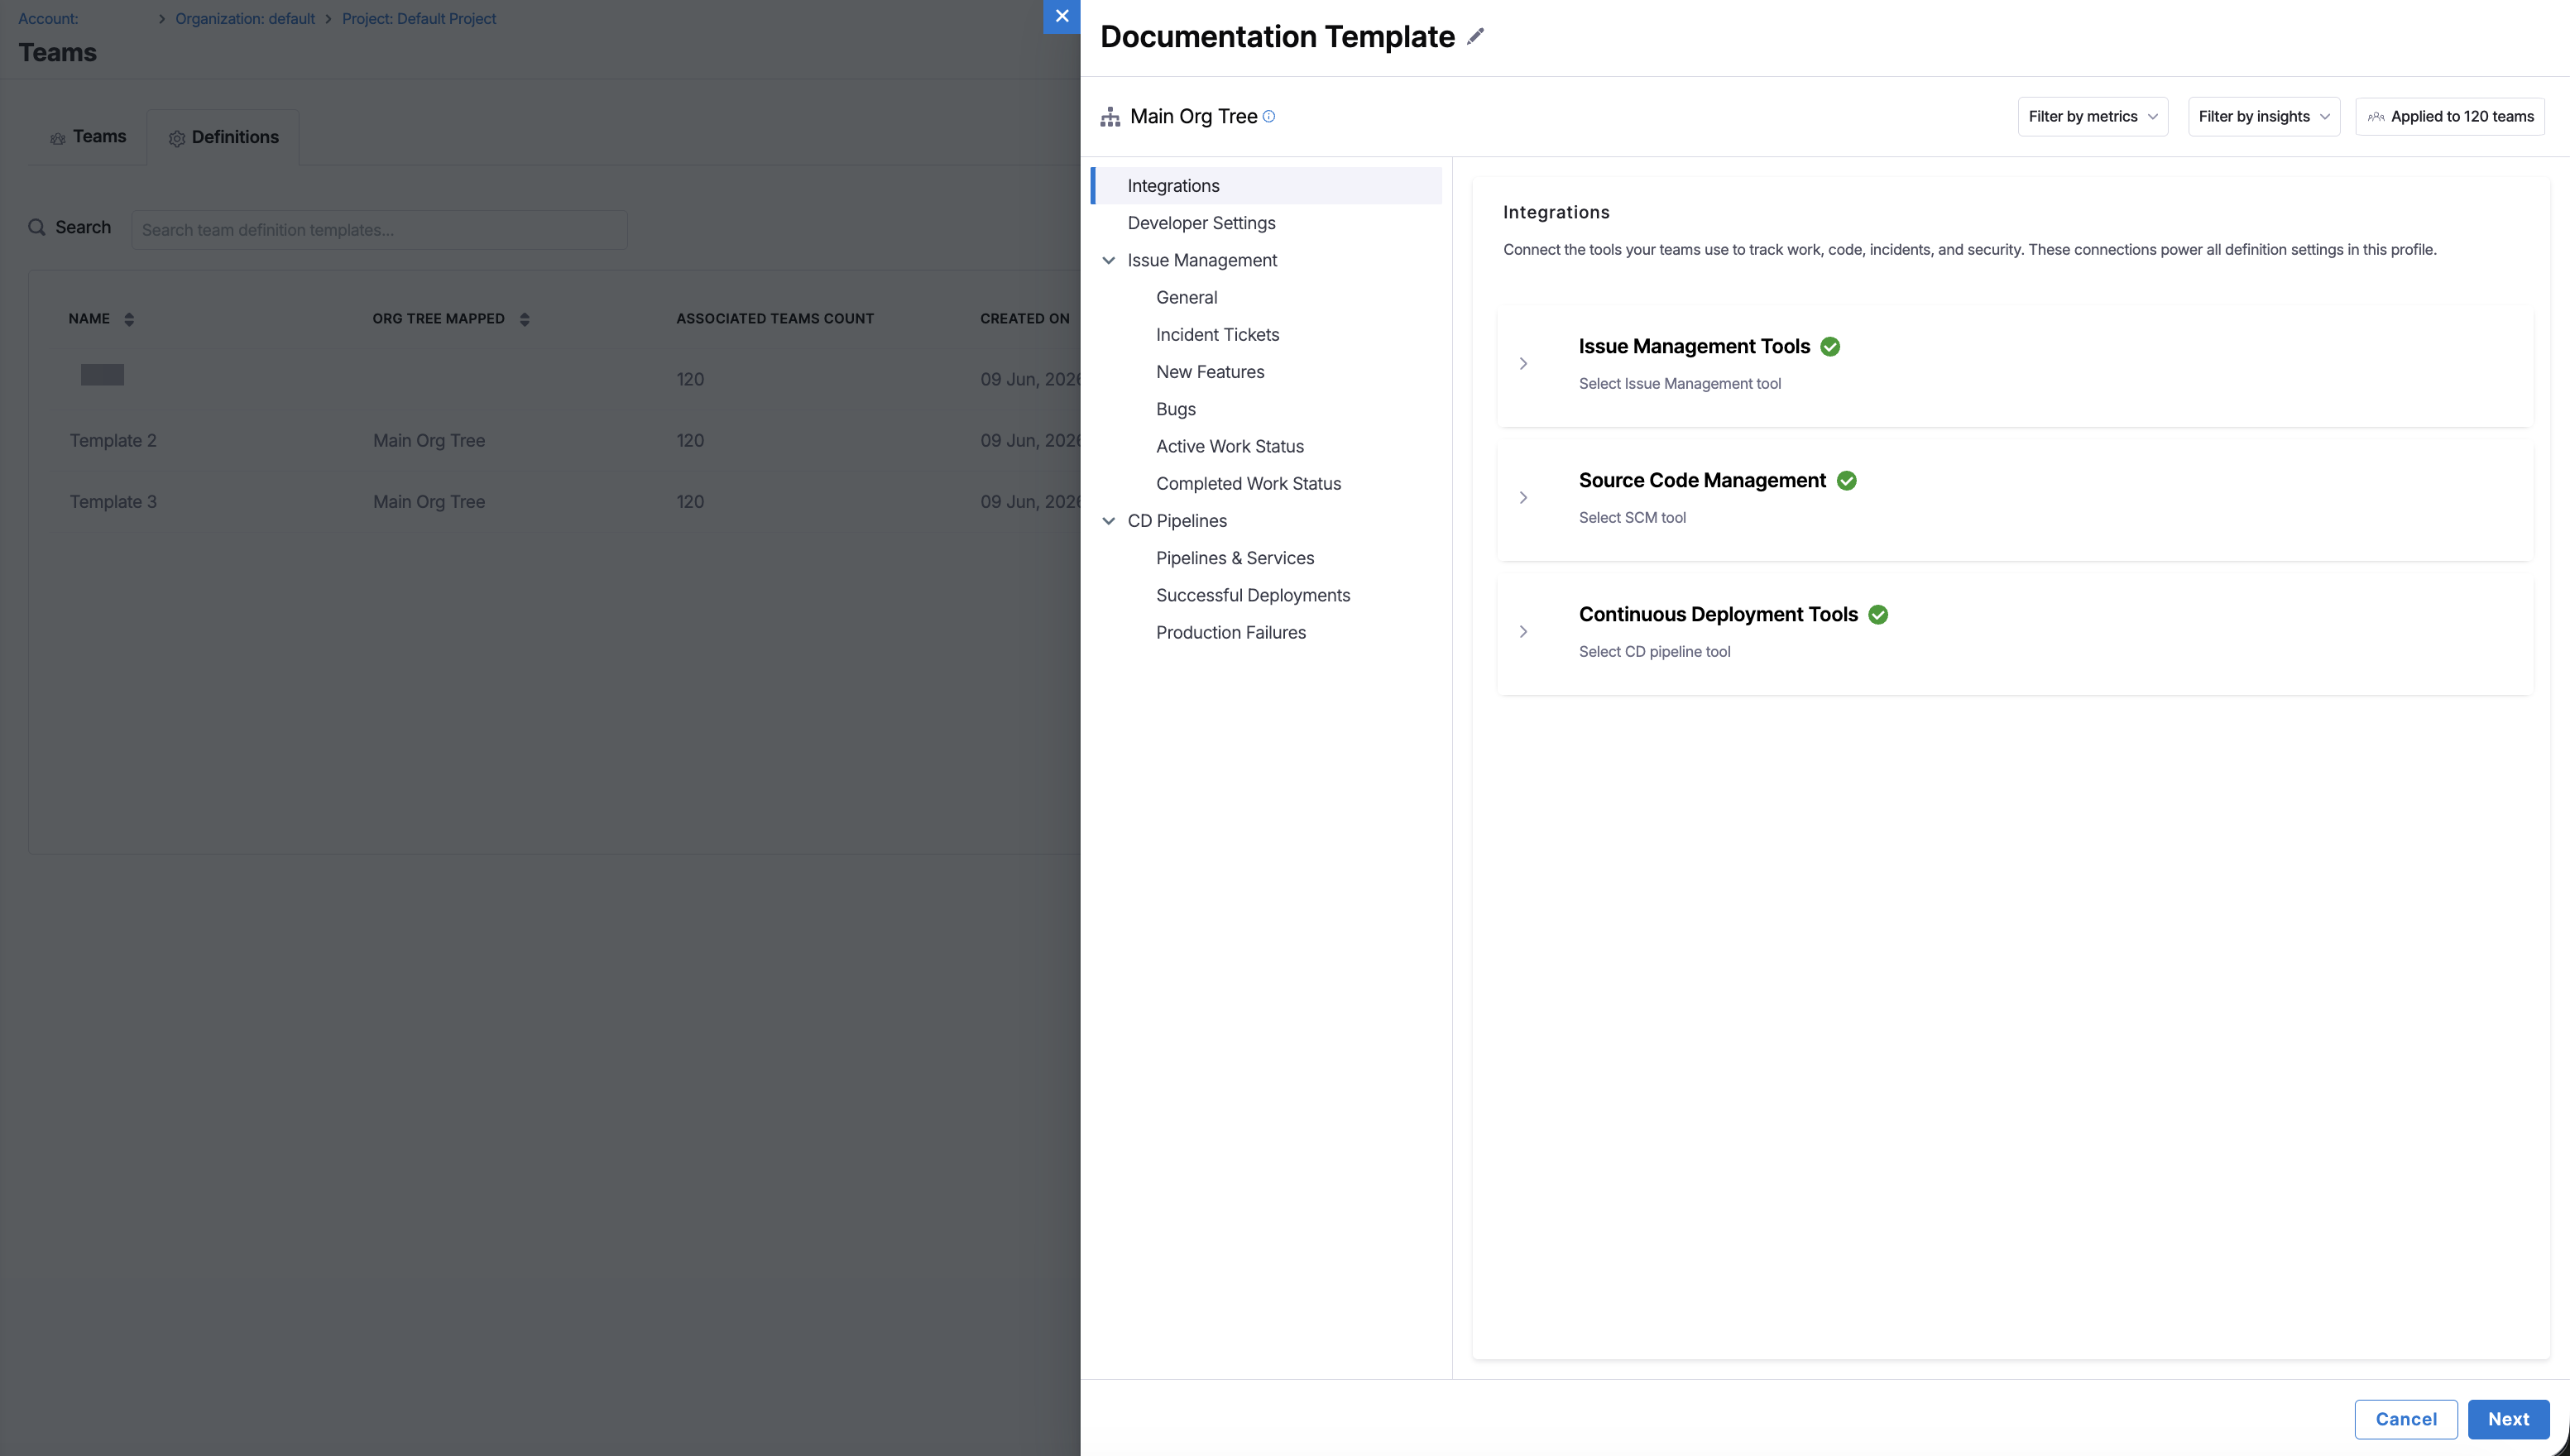
-
Click Next.
Once saved, AI DLC Insights aggregates developer activity across all connected SCMs for Efficiency and Productivity insights, providing a complete picture of team work.
Configure team tool settings
After selecting your team's integrations and mapping developer identities, configure tool-specific settings in the Developer Settings section of the Team Definition tab. These settings control how AI DLC Insights interprets data from each connected system. Proper configuration ensures that metrics on the Insights page accurately reflect your team's workflows, tools, and operational context.
The Team Definition tab consolidates all team configuration into a single page, with a left-side table of contents (TOC) for navigation between sections.
You can use the following dropdown menus on the upper-right corner to focus on relevant sections:
- Filter by Metrics: Show only sections related to a specific metric, for example: Lead Time for Change, Deployment Frequency, Mean Time to Restore, Change Failure Rate, Work Completed, or PR Velocity.
- Filter by Insights: Show only sections for a specific insight category, for example: DORA, Sprints, Productivity, Security, or Business Alignment.
Each configuration section includes a Use definition from [Template name] checkbox on the upper-right corner. When enabled, the section inherits its configuration from a template. Uncheck it to apply a team-specific override.
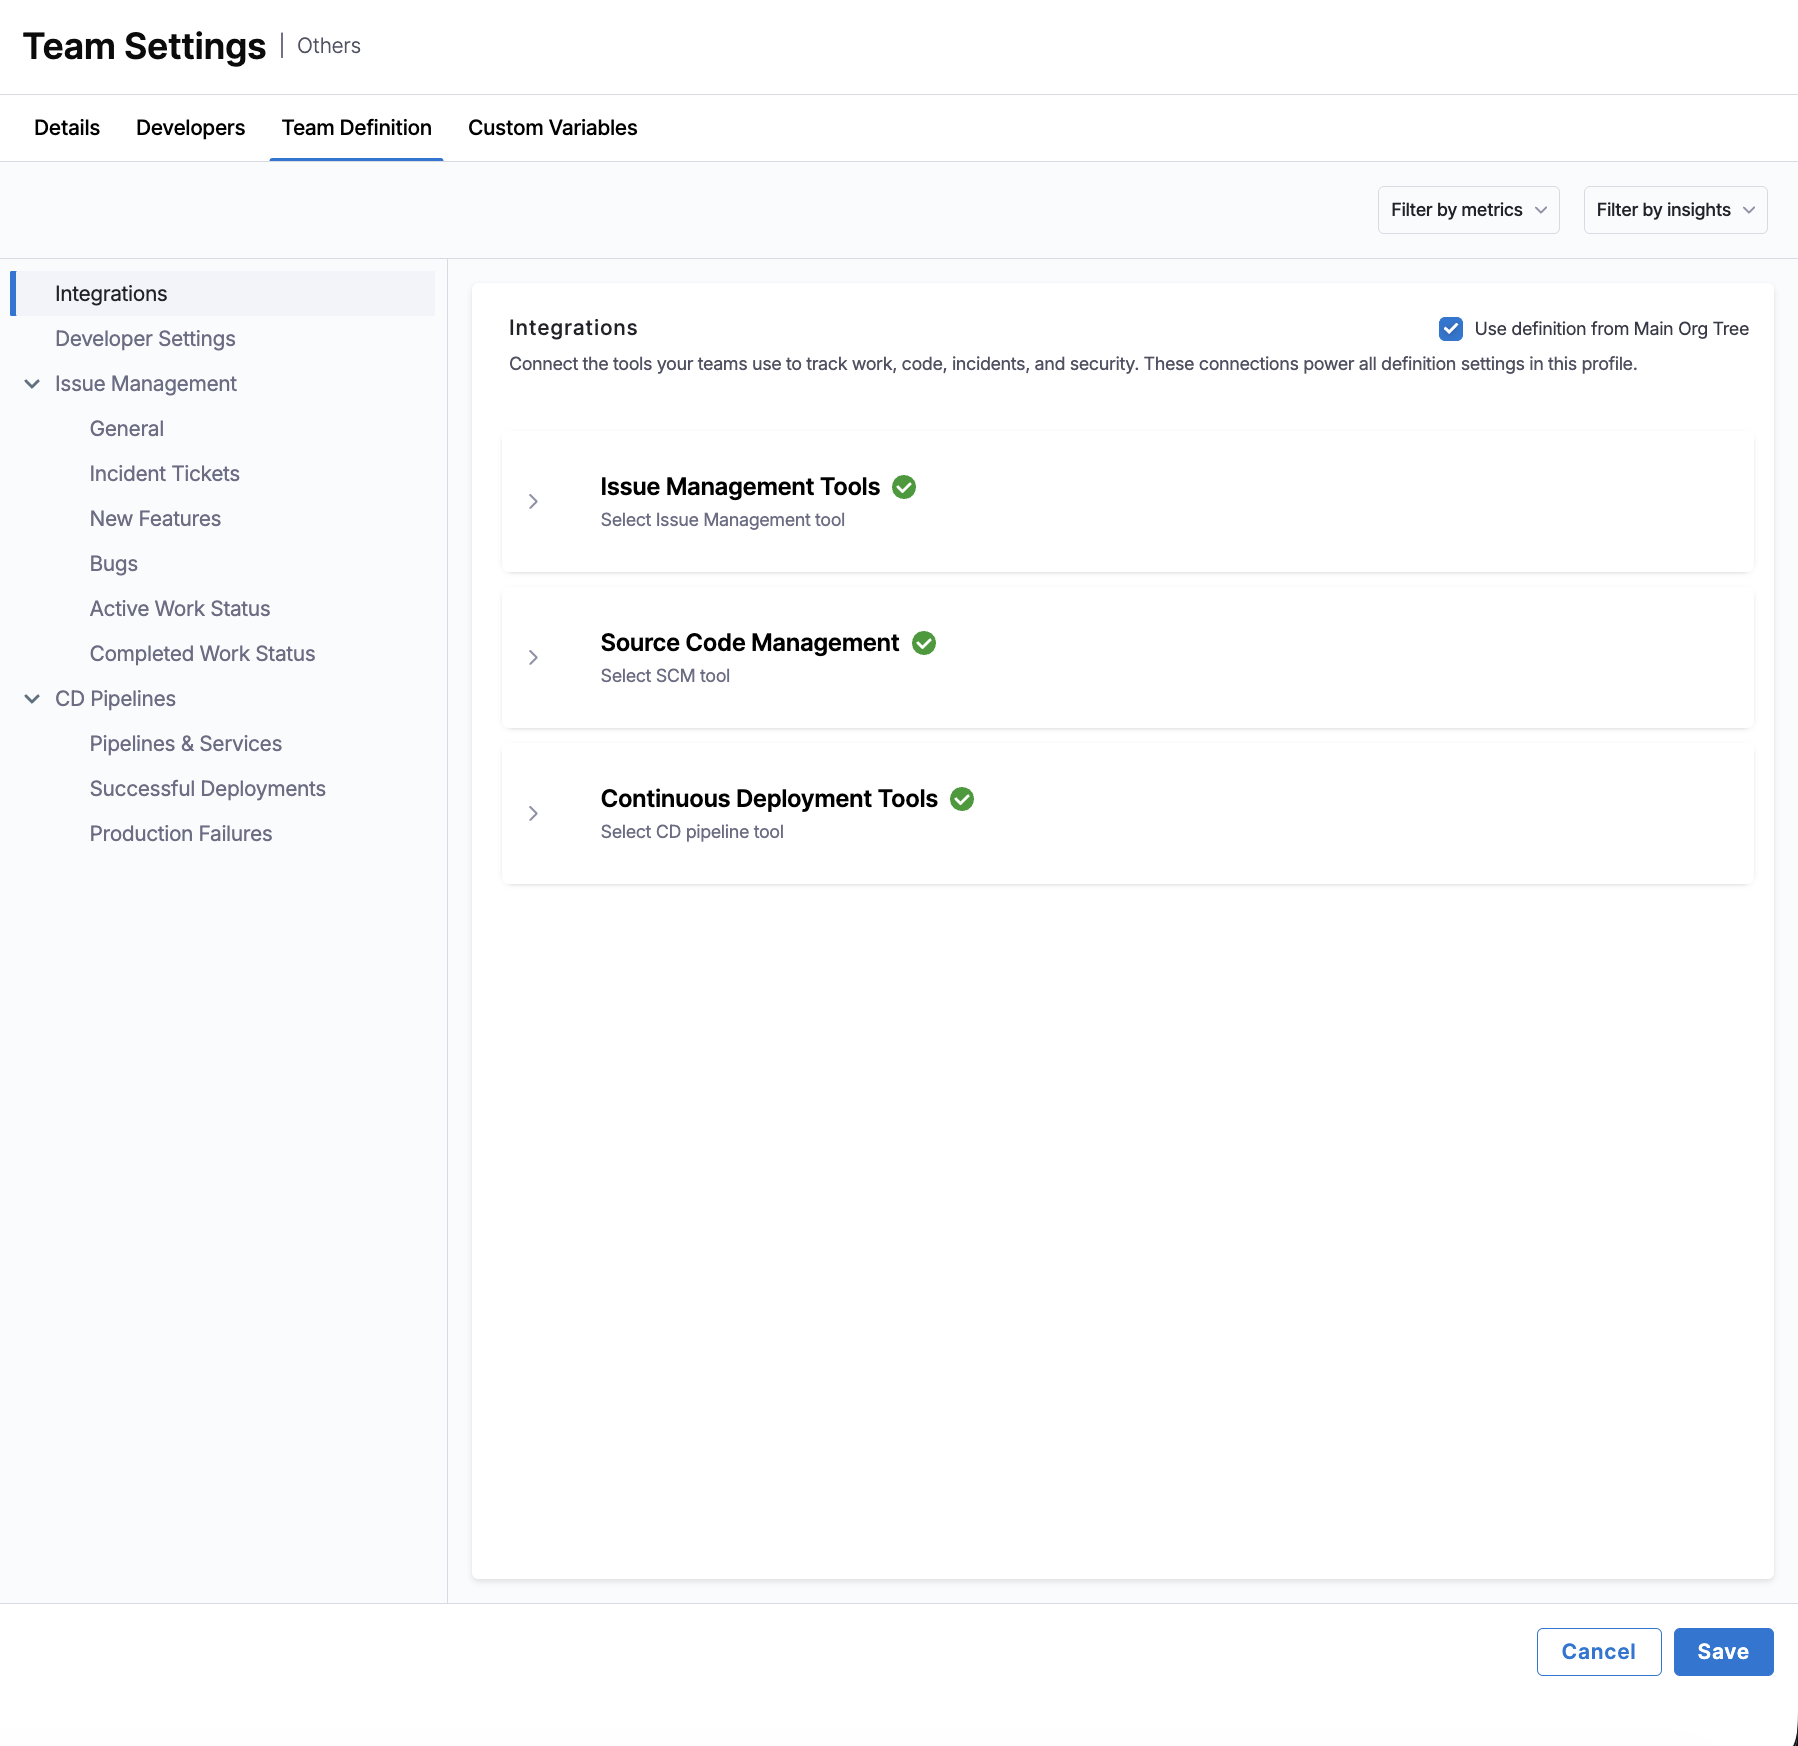
AI DLC Insights uses a filter set model to determine which work items should be included and how they are classified. Each filter set consists of:
- Property: The issue attribute to evaluate (for example,
Project,Issue Type, orLabel). - Condition: How the property is matched (for example,
EqualsorContains). - Value: The value from your issue management system (for example,
Docs,Bug, orP1).
You can add multiple filter sets by clicking + Add Condition. Each additional filter set is combined using AND logic, meaning all filter sets must match for a work item to be included. To remove a filter set, click the Delete icon next to it. Depending on the profile applied to the team, this configuration can impact delivery, reliability, productivity, and business alignment metrics.
To ensure accurate and meaningful metrics, align your filter conditions with your team's actual workflows, standardize labels and conventions for incidents, bugs, and deployments across tools, and regularly review your team settings whenever tools, processes, or team ownership changes. By keeping configurations current, you can ensure the dashboards in AI DLC Insights provide the most relevant and up-to-date insights.
- Issue Management Settings
- Source Code Management Settings
- Pipeline Settings
- Security Settings
- Incident Management Settings
Use the Issue Management tab in Team Settings to define which work items are relevant to your team and how they should be interpreted for metrics calculation. These settings control how AI DLC Insights scopes work, identifies incidents, categorizes investment, and classifies different types of work.
Projects
Define the scope of work items that belong to your team by including the projects or code areas where your team manages work.
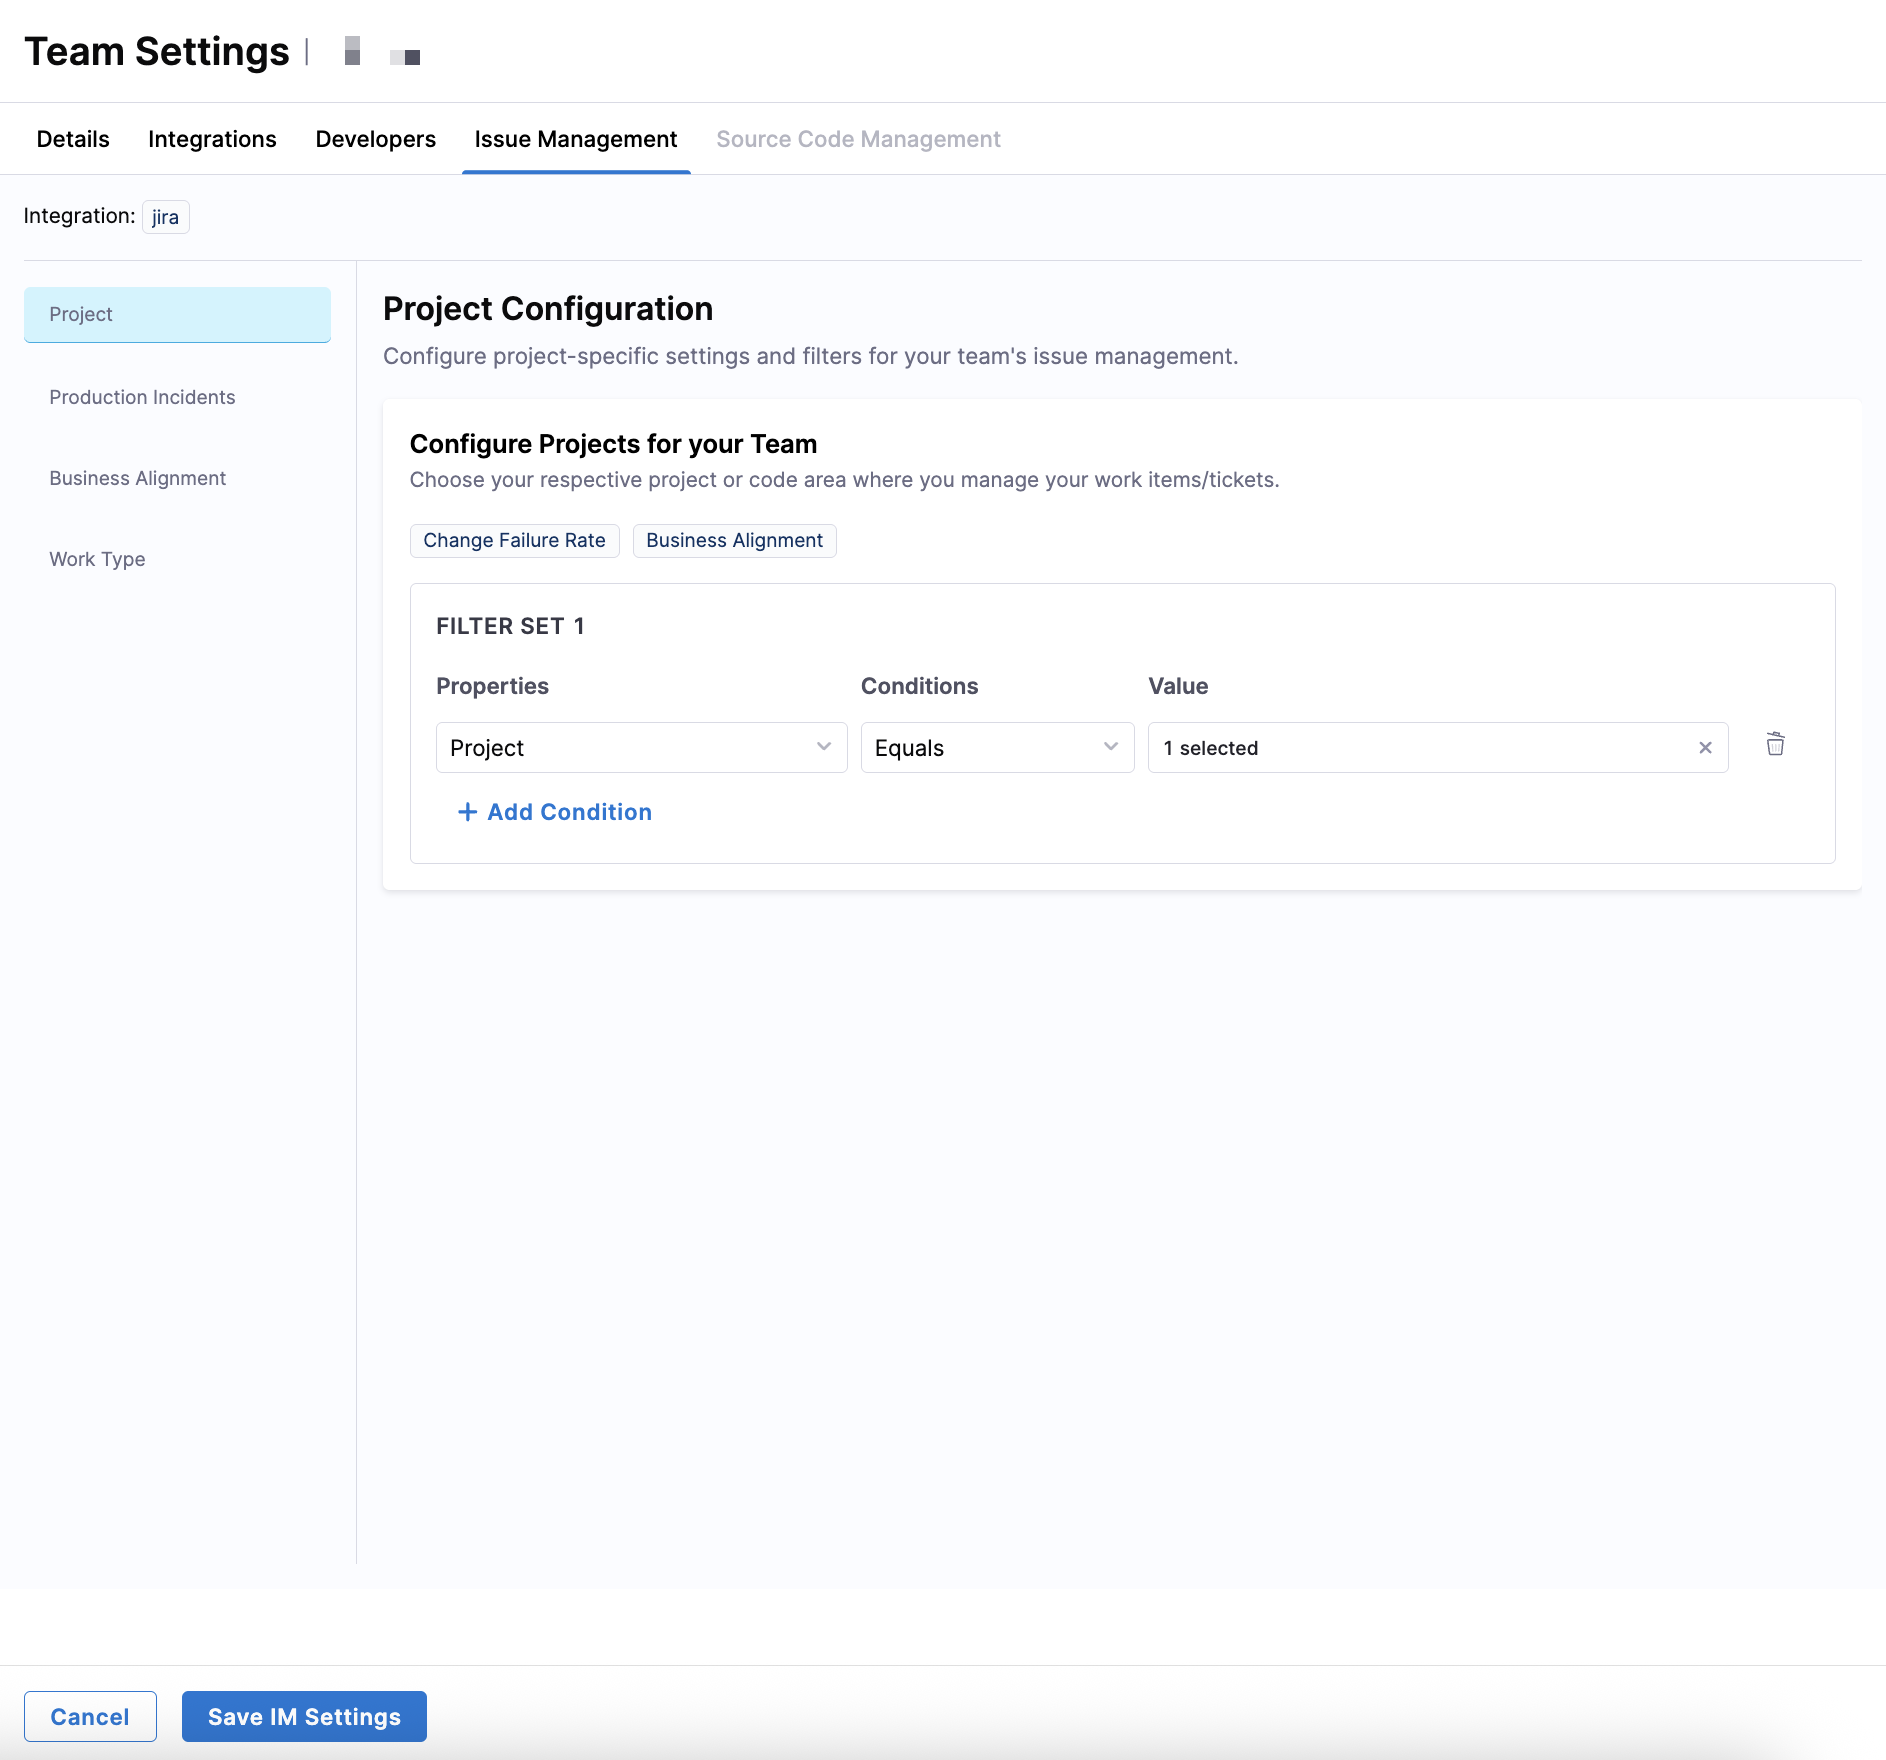
| Filter field | Available options |
|---|---|
| Properties | Project, Labels, Sprint Name, Components, Parent, Custom Fields |
| Conditions | Equals, Not Equals, Contains, Does Not Contain, Starts With, Ends With |
| Values | Values from your issue management system (for example, Jira projects such as DOCS, PRODUCT) |
To include work items from a specific Jira project (like DOCS), use Project Equals DOCS.
Correct production incident classification ensures AI DLC Insights accurately calculates Change Failure Rate and Business Alignment metrics.
Production Incidents
Identify which work items represent production failures or incidents to help AI DLC Insights calculate Change Failure Rate.
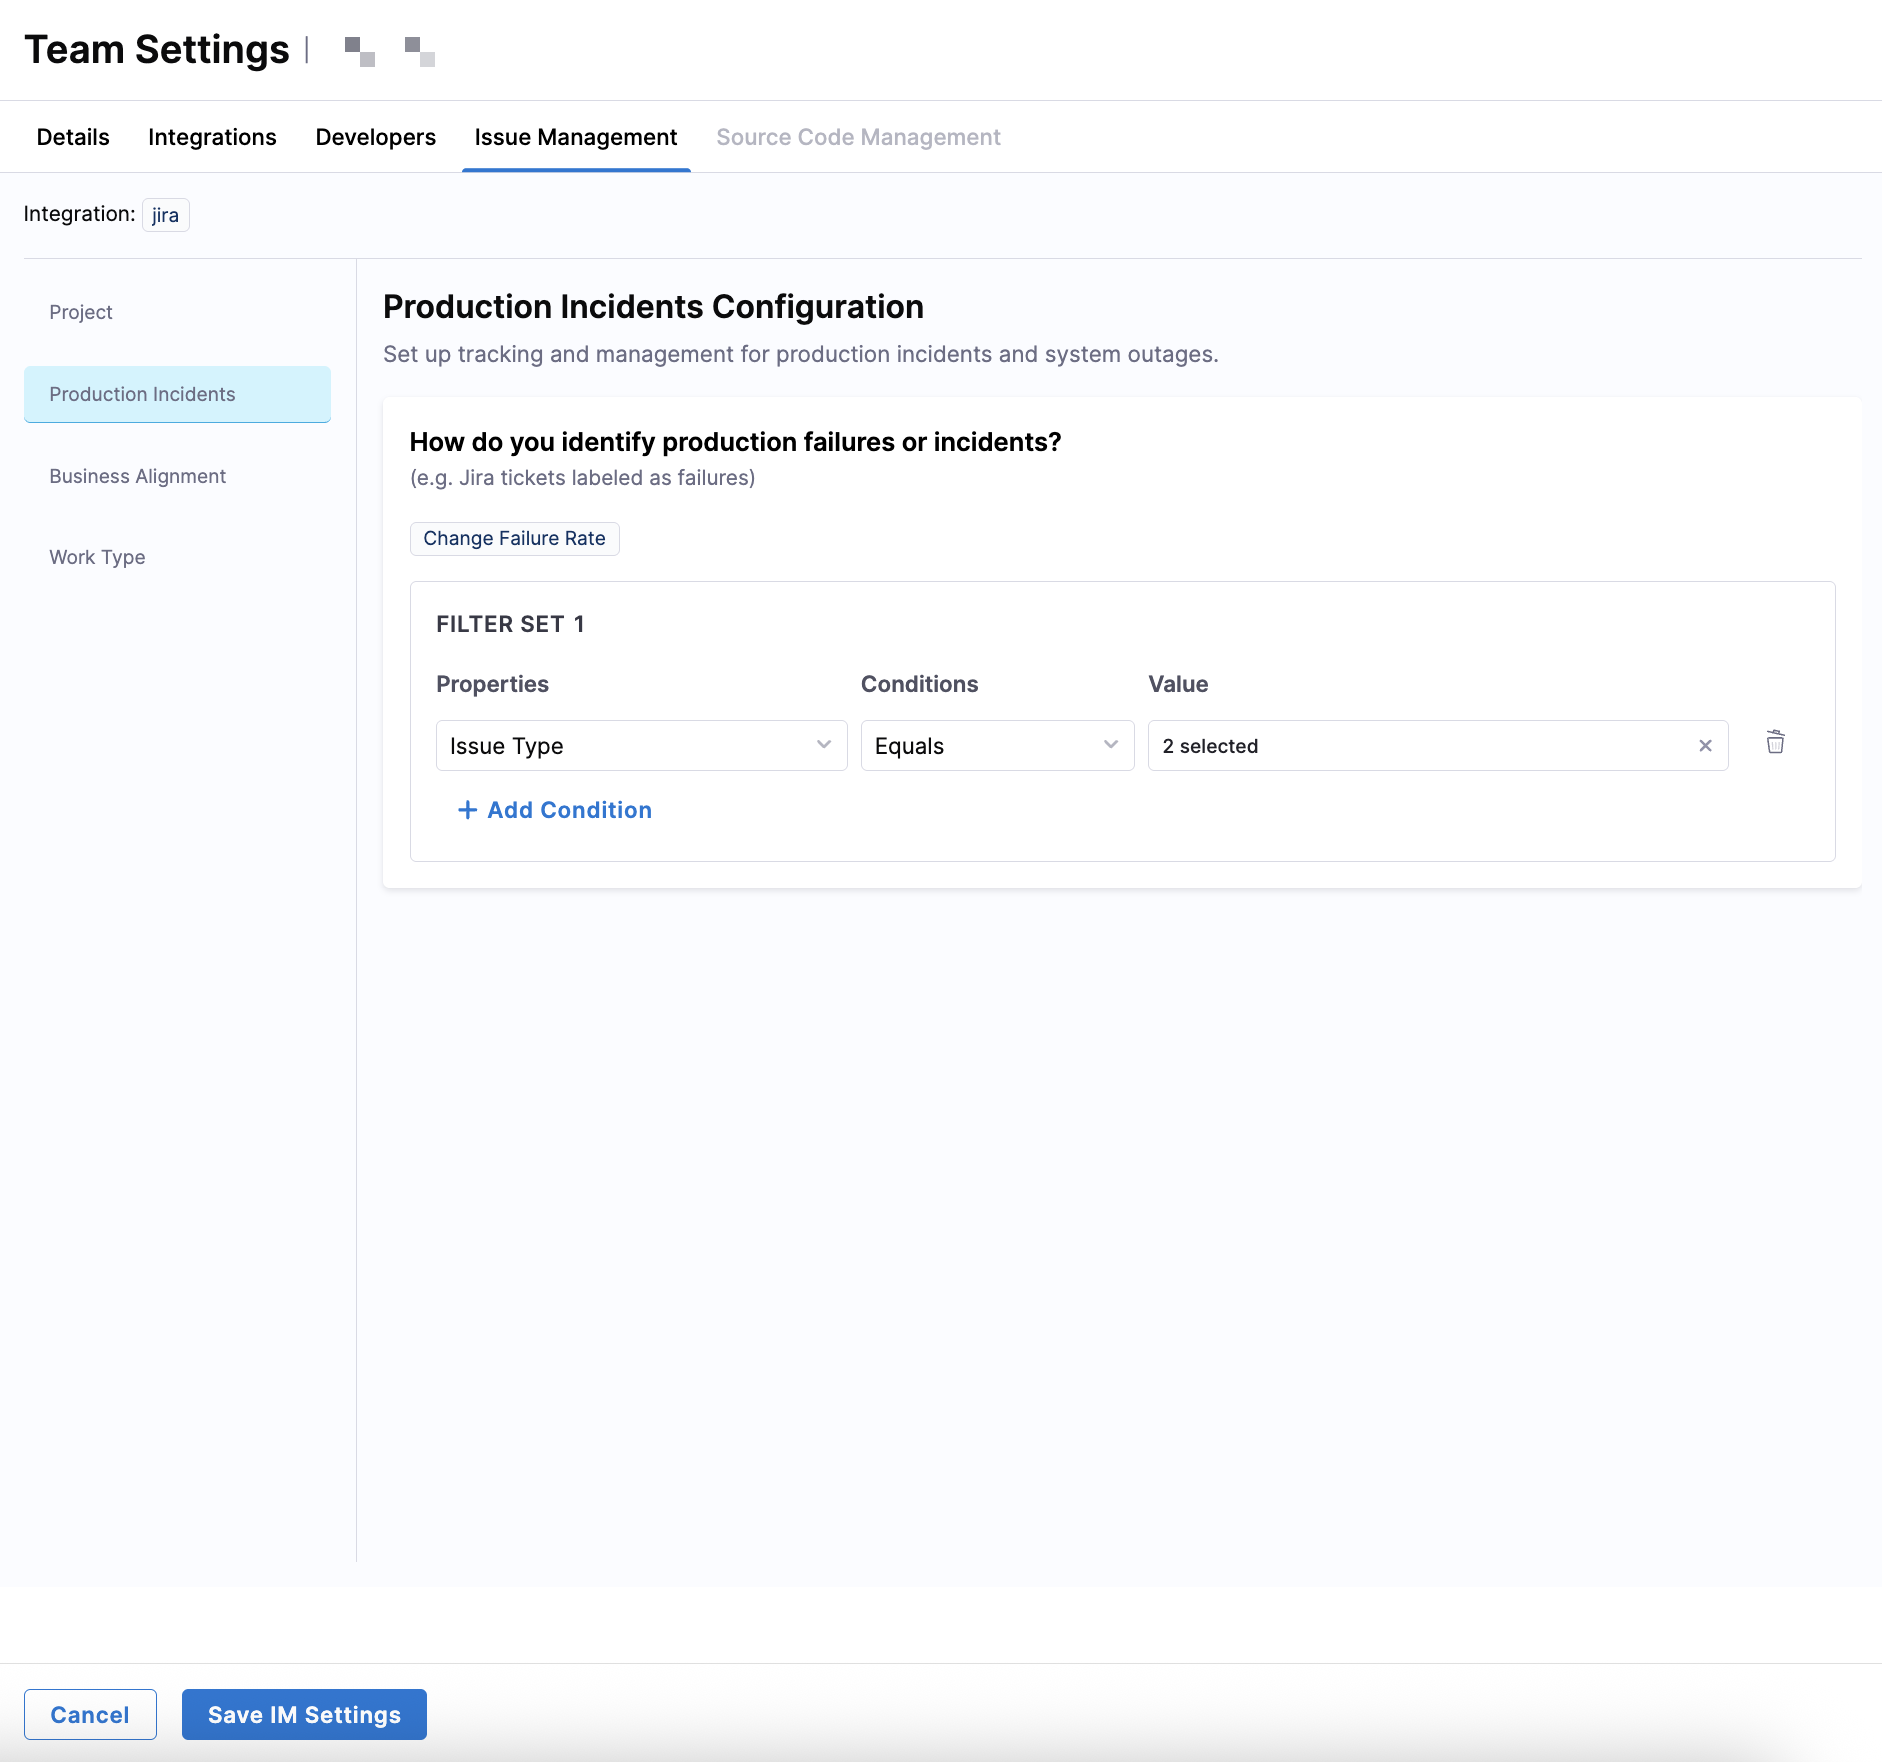
| Filter field | Available options |
|---|---|
| Properties | Labels, Issue Type, Priority |
| Conditions | Equals, Not Equals, Contains, Does Not Contain, Starts With, Ends With |
| Values | Values from your issue management system (for example, Incident, Bug, sev1, P0) |
To identify incidents using labels, use Labels Contains production-incident, or by issue type, use Issue Type Equals Incident.
Correct production incident classification ensures AI DLC Insights accurately calculates Change Failure Rate.
Business Alignment
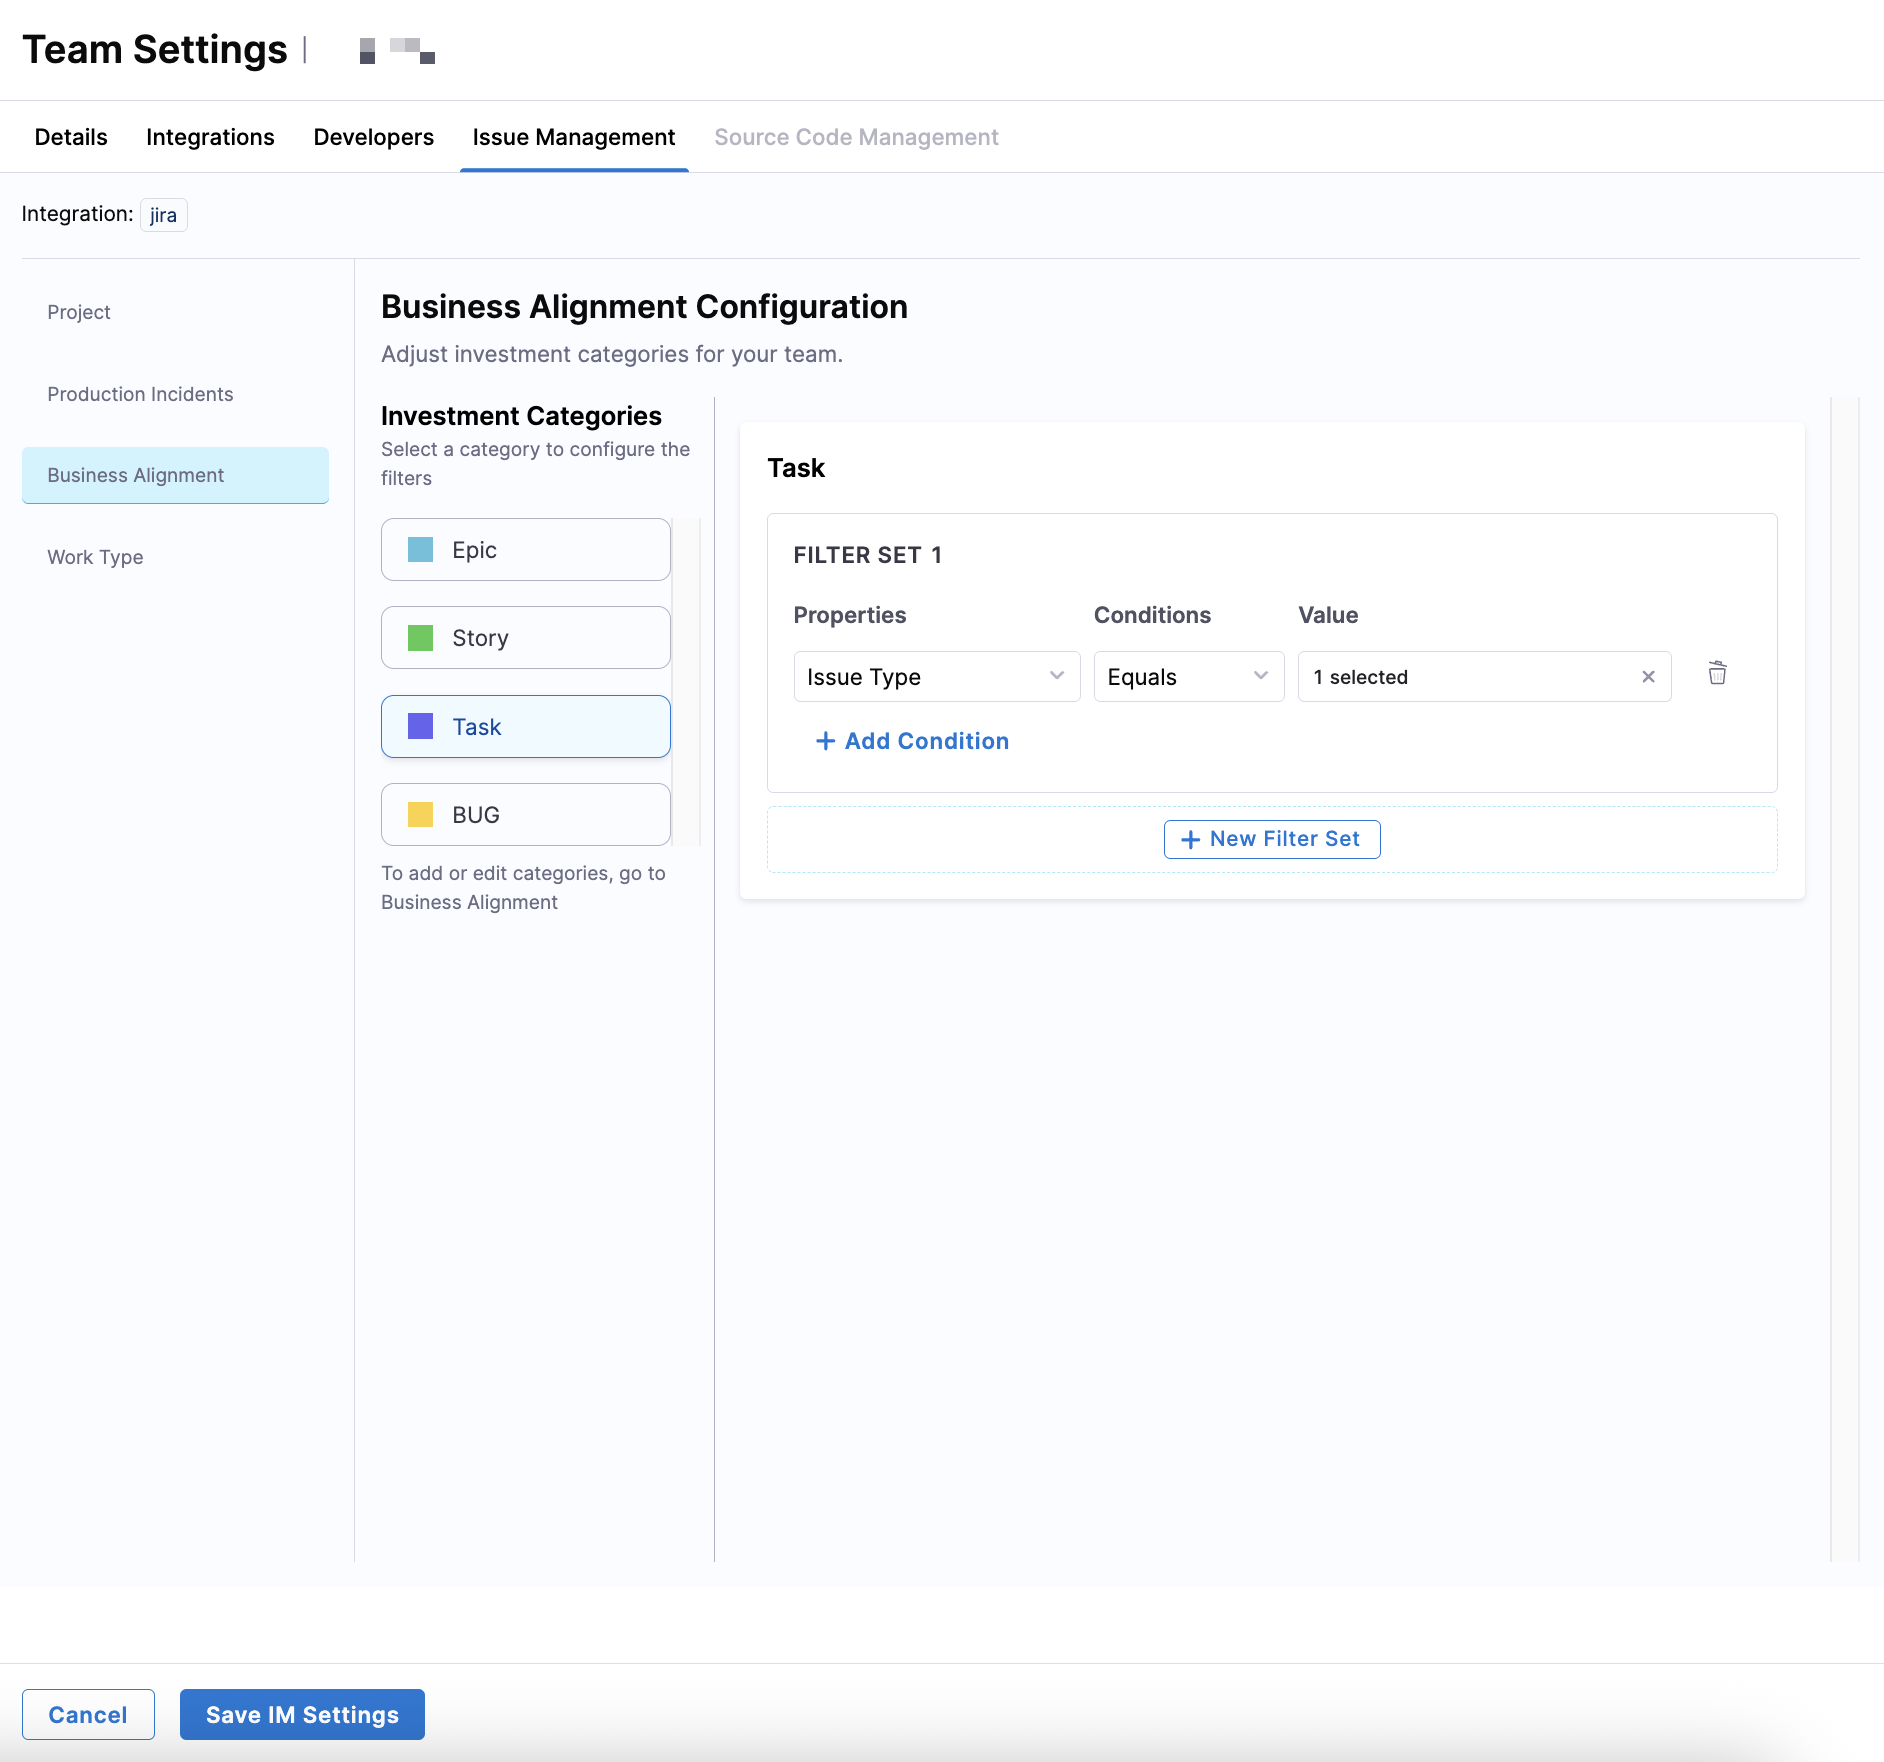
Business Alignment maps work items to investment categories defined in your Business Alignment profile (for example, Epic, Story, and Task). These filters are configured per investment category.
| Filter field | Available options |
|---|---|
| Properties | Issue Type, Status, Labels, Priority, Components, Parent, Sprint Name |
| Conditions | Equals, Not Equals, Contains, Does Not Contain, Starts With, Ends With |
| Values | Values from your issue management system |
For the Epic category, use Issue Type Equals Epic. For the Story category, use Issue Type Equals Story. Each category is evaluated independently based on its own filter set.
Correct investment category configuration ensures AI DLC Insights accurately calculates Business Alignment metrics.
Work Type
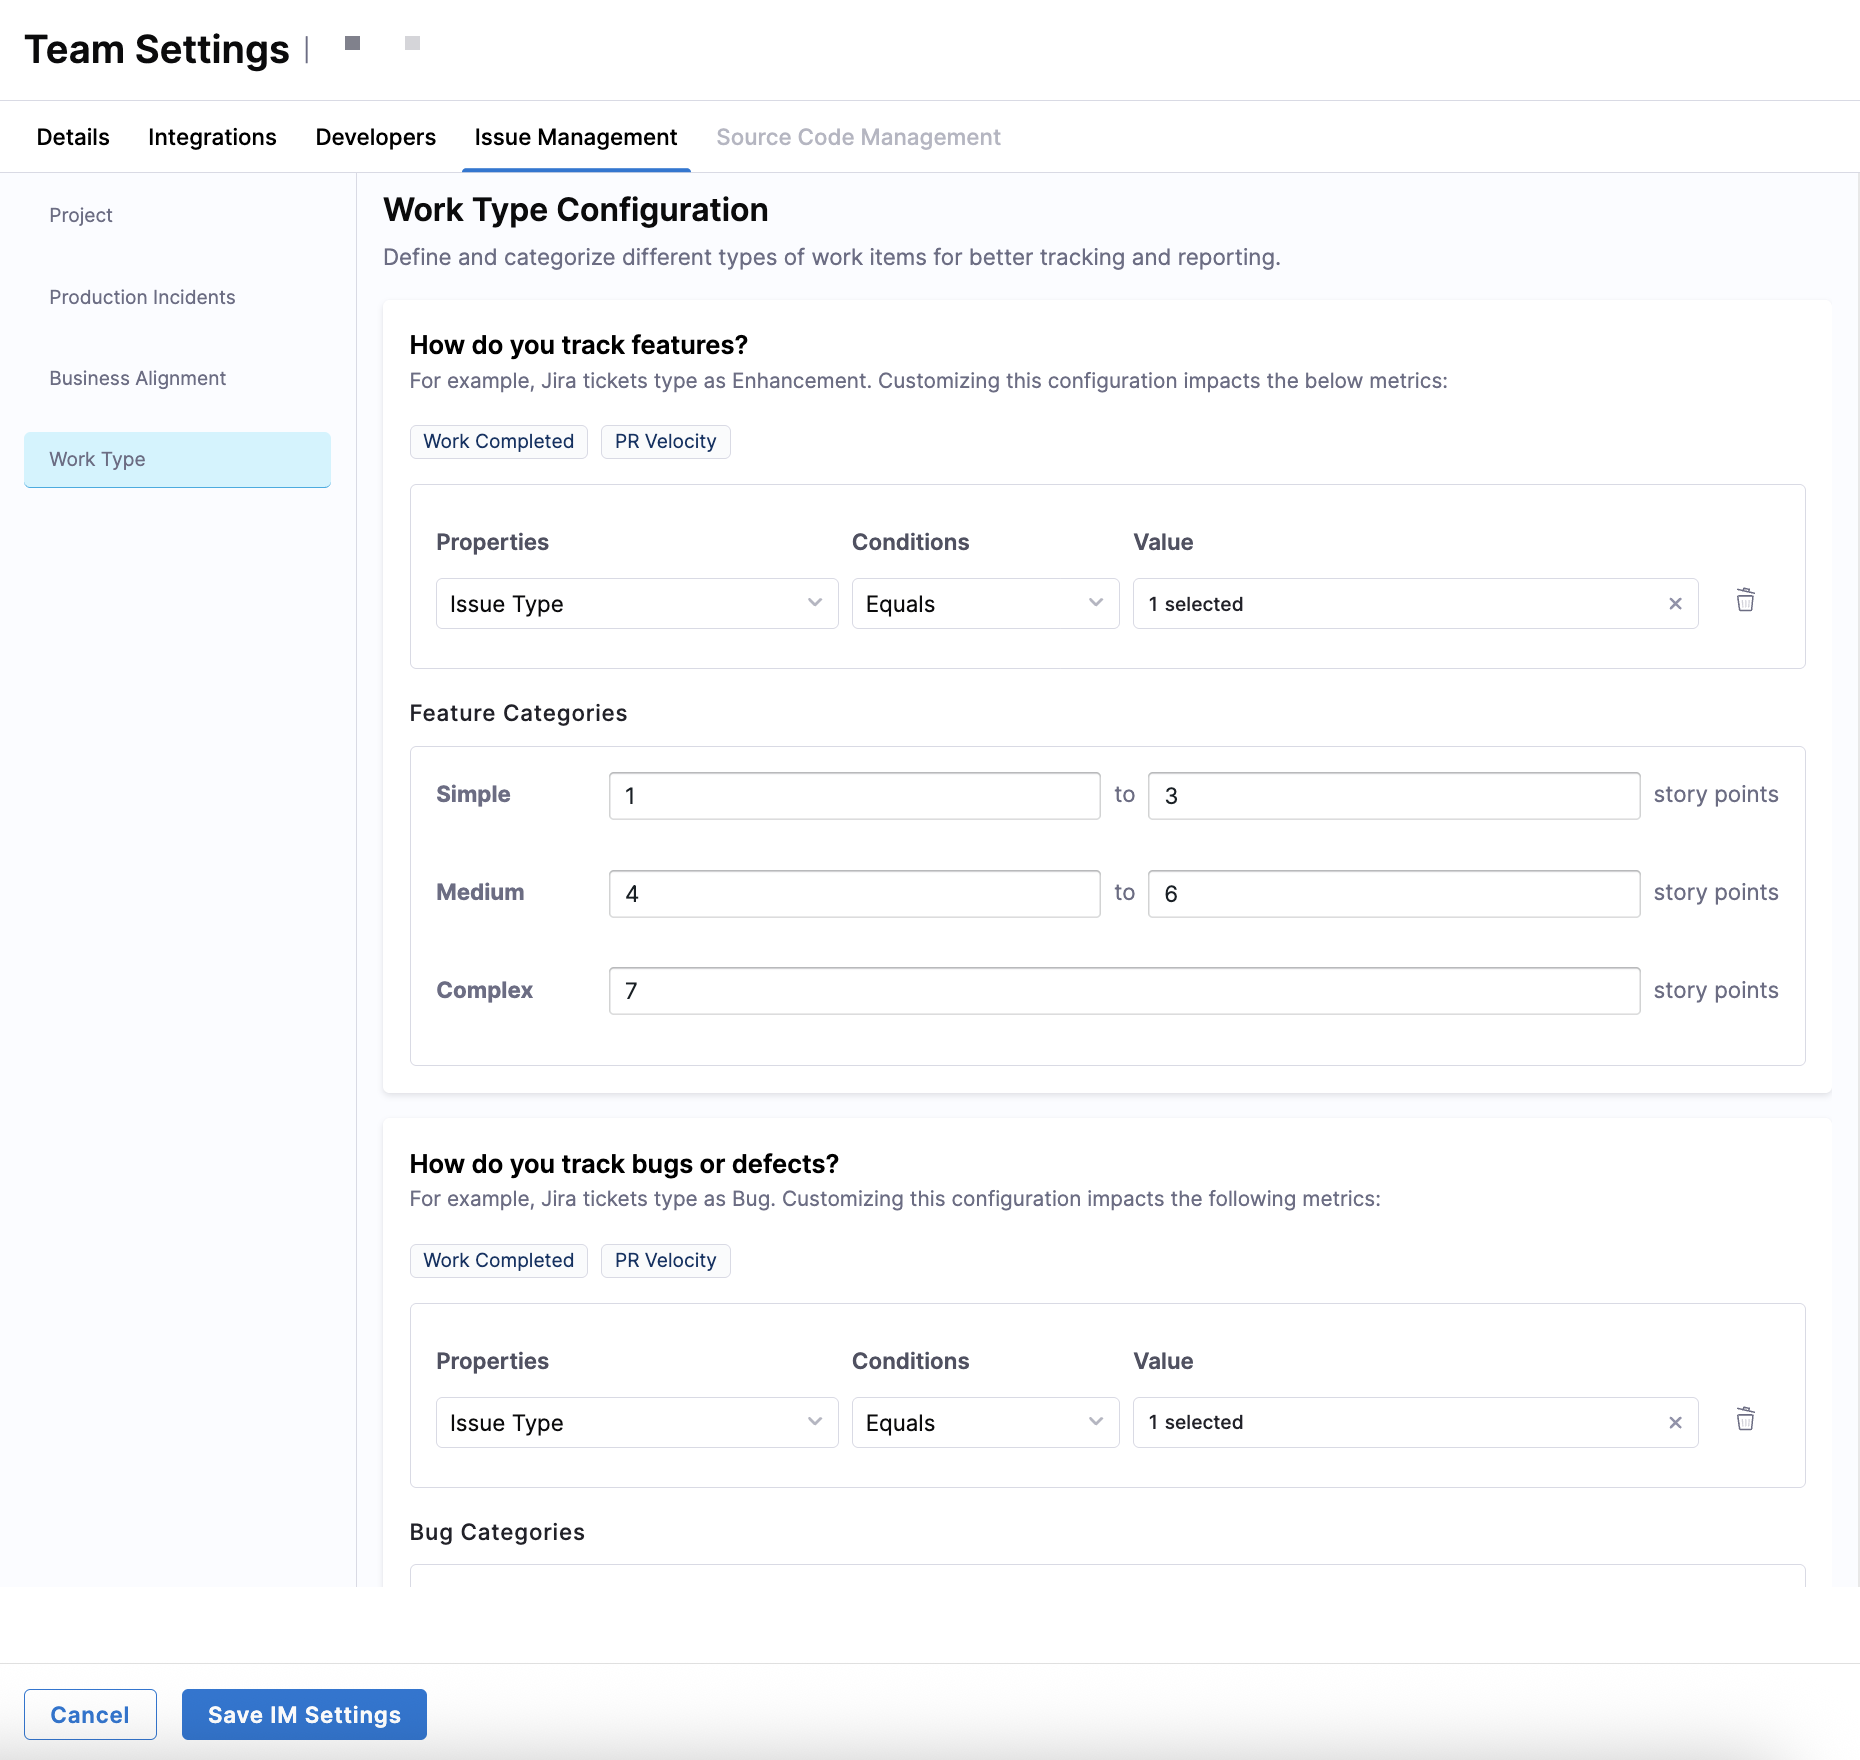
Define how AI DLC Insights classifies features, bugs, and work status for Productivity metrics by configuring filter sets, setting feature and bug category thresholds, and specifying which statuses represent active and terminated work.
Features
| Filter field | Available options |
|---|---|
| Properties | Issue Type |
| Conditions | Equals |
| Values | Bug-related issue types from your issue management system (for example, Story) |
To identify feature work, use Issue Type Equals Story or Issue Type Equals Enhancement.
In the Feature Categories section, you can further classify features by size using story points.
- Simple: Set a minimum and maximum range (for example, 1–3).
- Medium: Set a minimum and maximum range (for example, 4–6).
- Complex: Set a minimum threshold only (for example, 7+).
Correct feature classification ensures AI DLC Insights accurately calculates Work Completed and PR Velocity.
Bugs and defects
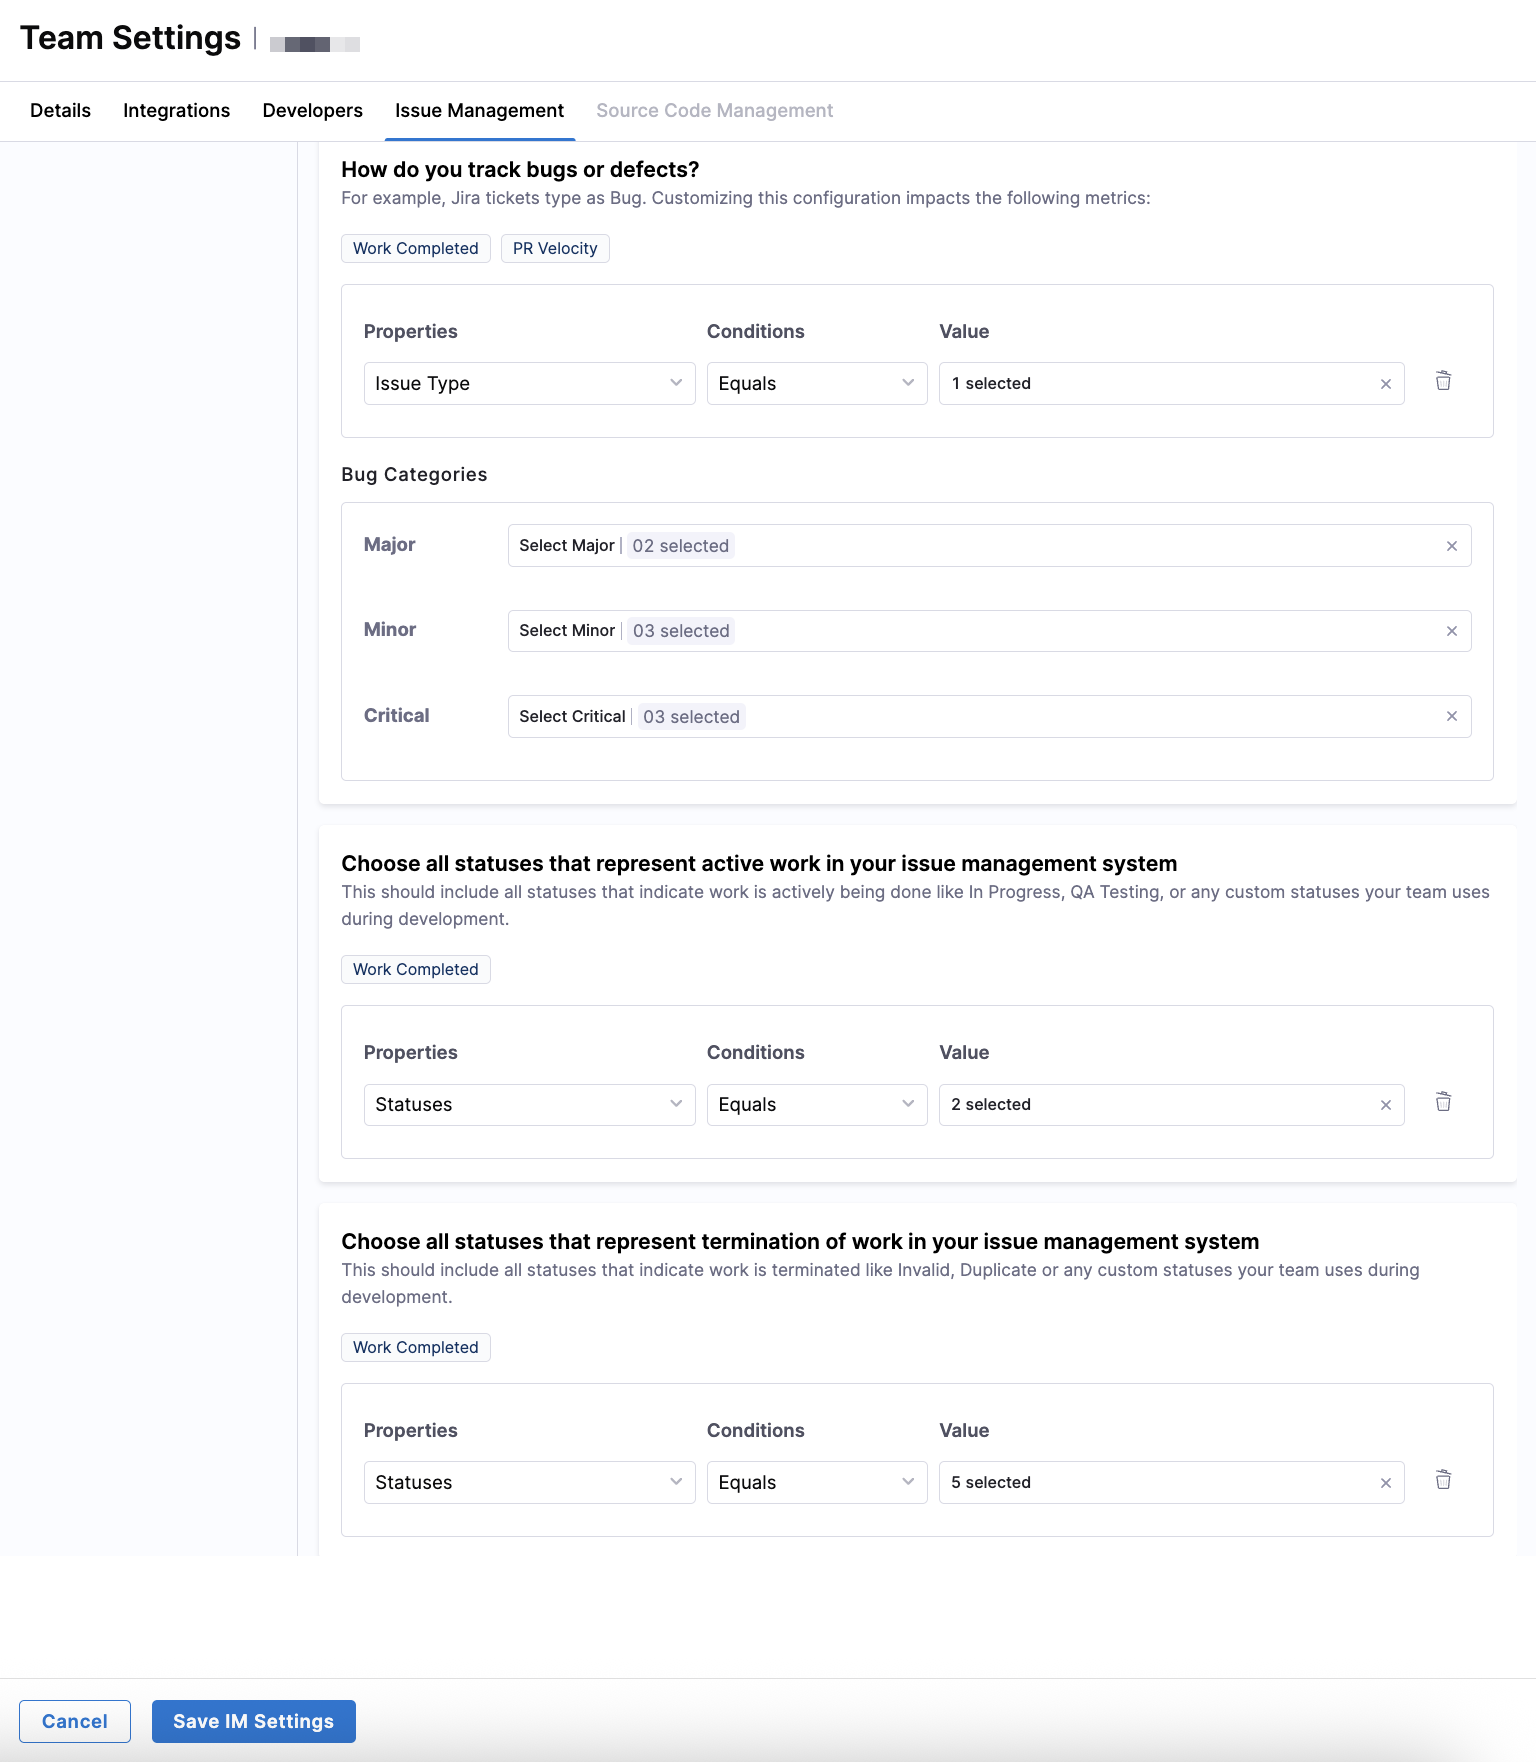
To identify bugs or defects, use Issue Type Equals Bug.
In the Bug Categories section, you can further classify bugs by severity using values from your issue management system.
- Critical: For example,
P0,P1,Highest. - Major: For example,
P2orP3. - Minor: For example,
P4,Low,Lowest.
Correct bug classification ensures AI DLC Insights accurately calculates Work Completed and PR Velocity.
Active and terminated work
Define which statuses represent active work (for example, In Progress or QA Testing) and terminated work (for example, Invalid or Duplicate) in the Choose all statuses that represent work in your issue management system sections.
To classify active work, use Statuses Equals To Do, In Progress, QA Testing. For terminated work, use Statuses Equal Invalid, Won't Do, Duplicate.
Correct status classification ensures AI DLC Insights accurately calculates Work Completed.
After completing all Issue Management filters, click Save IM Settings to apply the configuration to the team.
Source Code Management (SCM) settings are required for delivery metrics such as Lead Time for Change and Deployment Frequency, but not required for holistic Productivity metrics.

Developer identifiers can be automatically discovered using Auto Identity Discovery or manually configured if needed. If you select multiple SCM integrations on the Integrations tab, you must include all repositories your team contributes to for more complete metric calculations.
Use the Source Code Management tab in Team Settings to define which repositories represent your team's development work, and how AI DLC Insights identifies deployment-related changes from your SCM data. These setting impact delivery metrics such as Lead Time for Change and Deployment Frequency.
Repositories
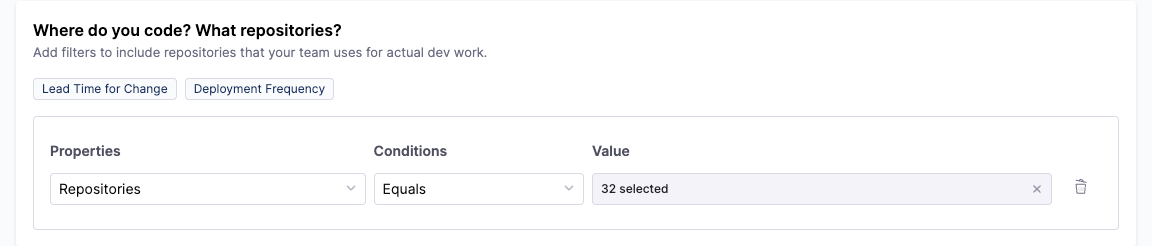
Select the repositories your team actively contributes to. AI DLC Insights uses this configuration to scope developer activity and delivery metrics to relevant codebases.
| Filter field | Available options |
|---|---|
| Properties | Repositories |
| Conditions | Equals, Not Equals, Contains, Does Not Contain, Starts With, Ends With |
| Values | One or more repositories selected from connected SCMs |
Select only the repositories your team owns or contributes to regularly, for example, use Repositories Equals documentation.
Destination and target branches
Determine which branches are considered production or deployment targets.
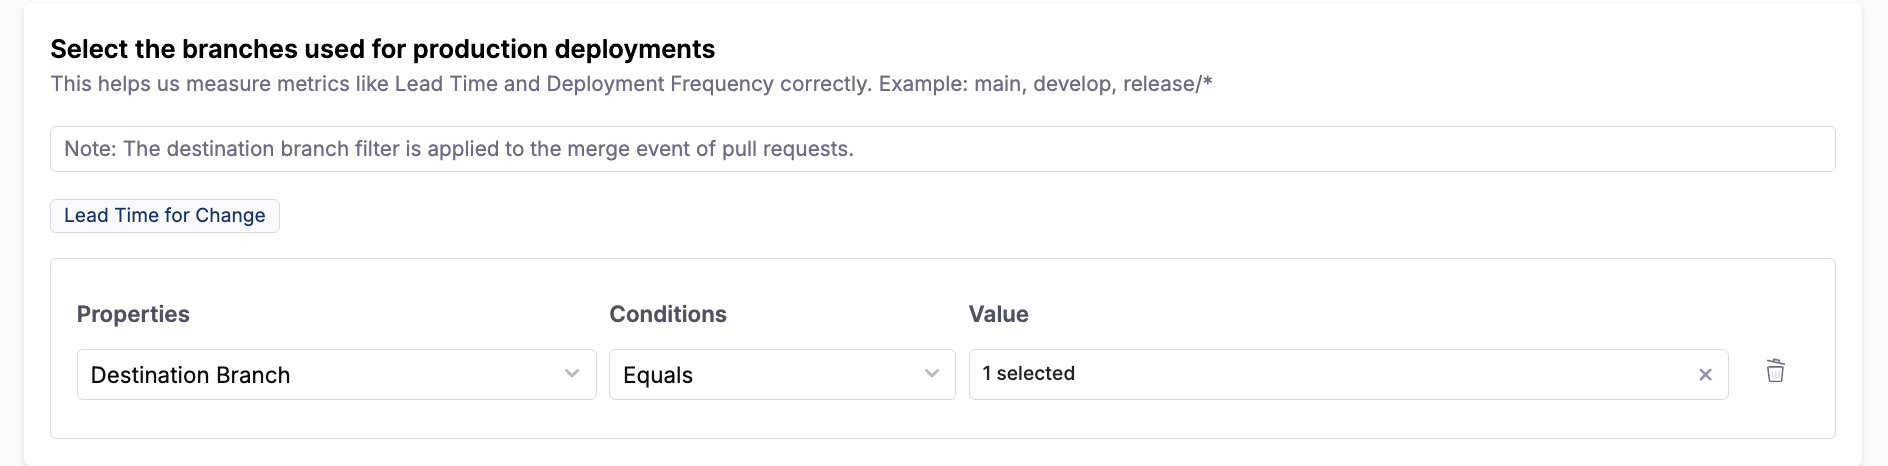
| Filter field | Available options |
|---|---|
| Properties | Destination Branch |
| Conditions | Equals, Not Equals, Contains, Does Not Contain, Starts With, Ends With |
| Values | Branch names from your SCM system (for example, main, production) |
To include the main branch, use Destination Branch Equals main. To include release branches, use Destination Branch Starts With release/.
Change exclusion criteria
Exclude non-deployment changes, such as automated or administrative commits, from delivery metrics.
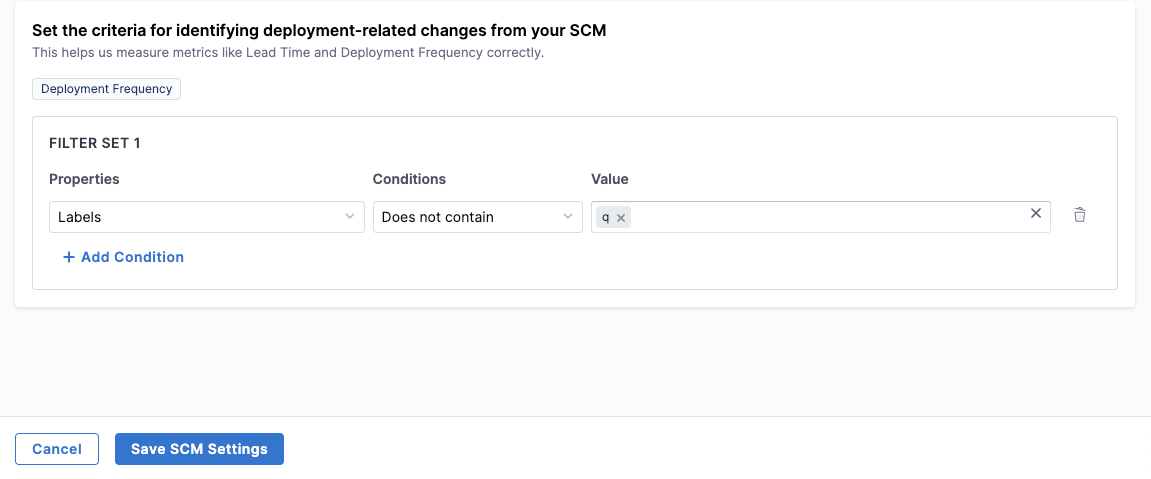
| Filter field | Available options |
|---|---|
| Properties | Labels |
| Conditions | Equals, Not Equals, Contains, Does Not Contain, Starts With, Ends With |
| Values | Custom label values (for example, chore, docs-only) |
To exclude maintenance changes, use Labels Does Not Contain chore. This helps prevent noise from inflating deployment metrics.
Label-based filters apply across all selected SCM integrations, ensuring deployment-related changes are identified consistently even when multiple SCM tools are configured. Once you've configured the repositories, branches, and deployment criteria, click Save SCM Settings to apply the configuration to the team.
Correctly defining repositories, branches, and deployment-related criteria ensures AI DLC Insights accurately calculates Lead Time for Change and Deployment Frequency, especially when multiple SCM integrations are configured.
Use the CD Pipelines tab in Team Settings to define which CD pipelines belong to your team and how AI DLC Insights identifies successful and failed deployments when calculating deployment-related metrics.
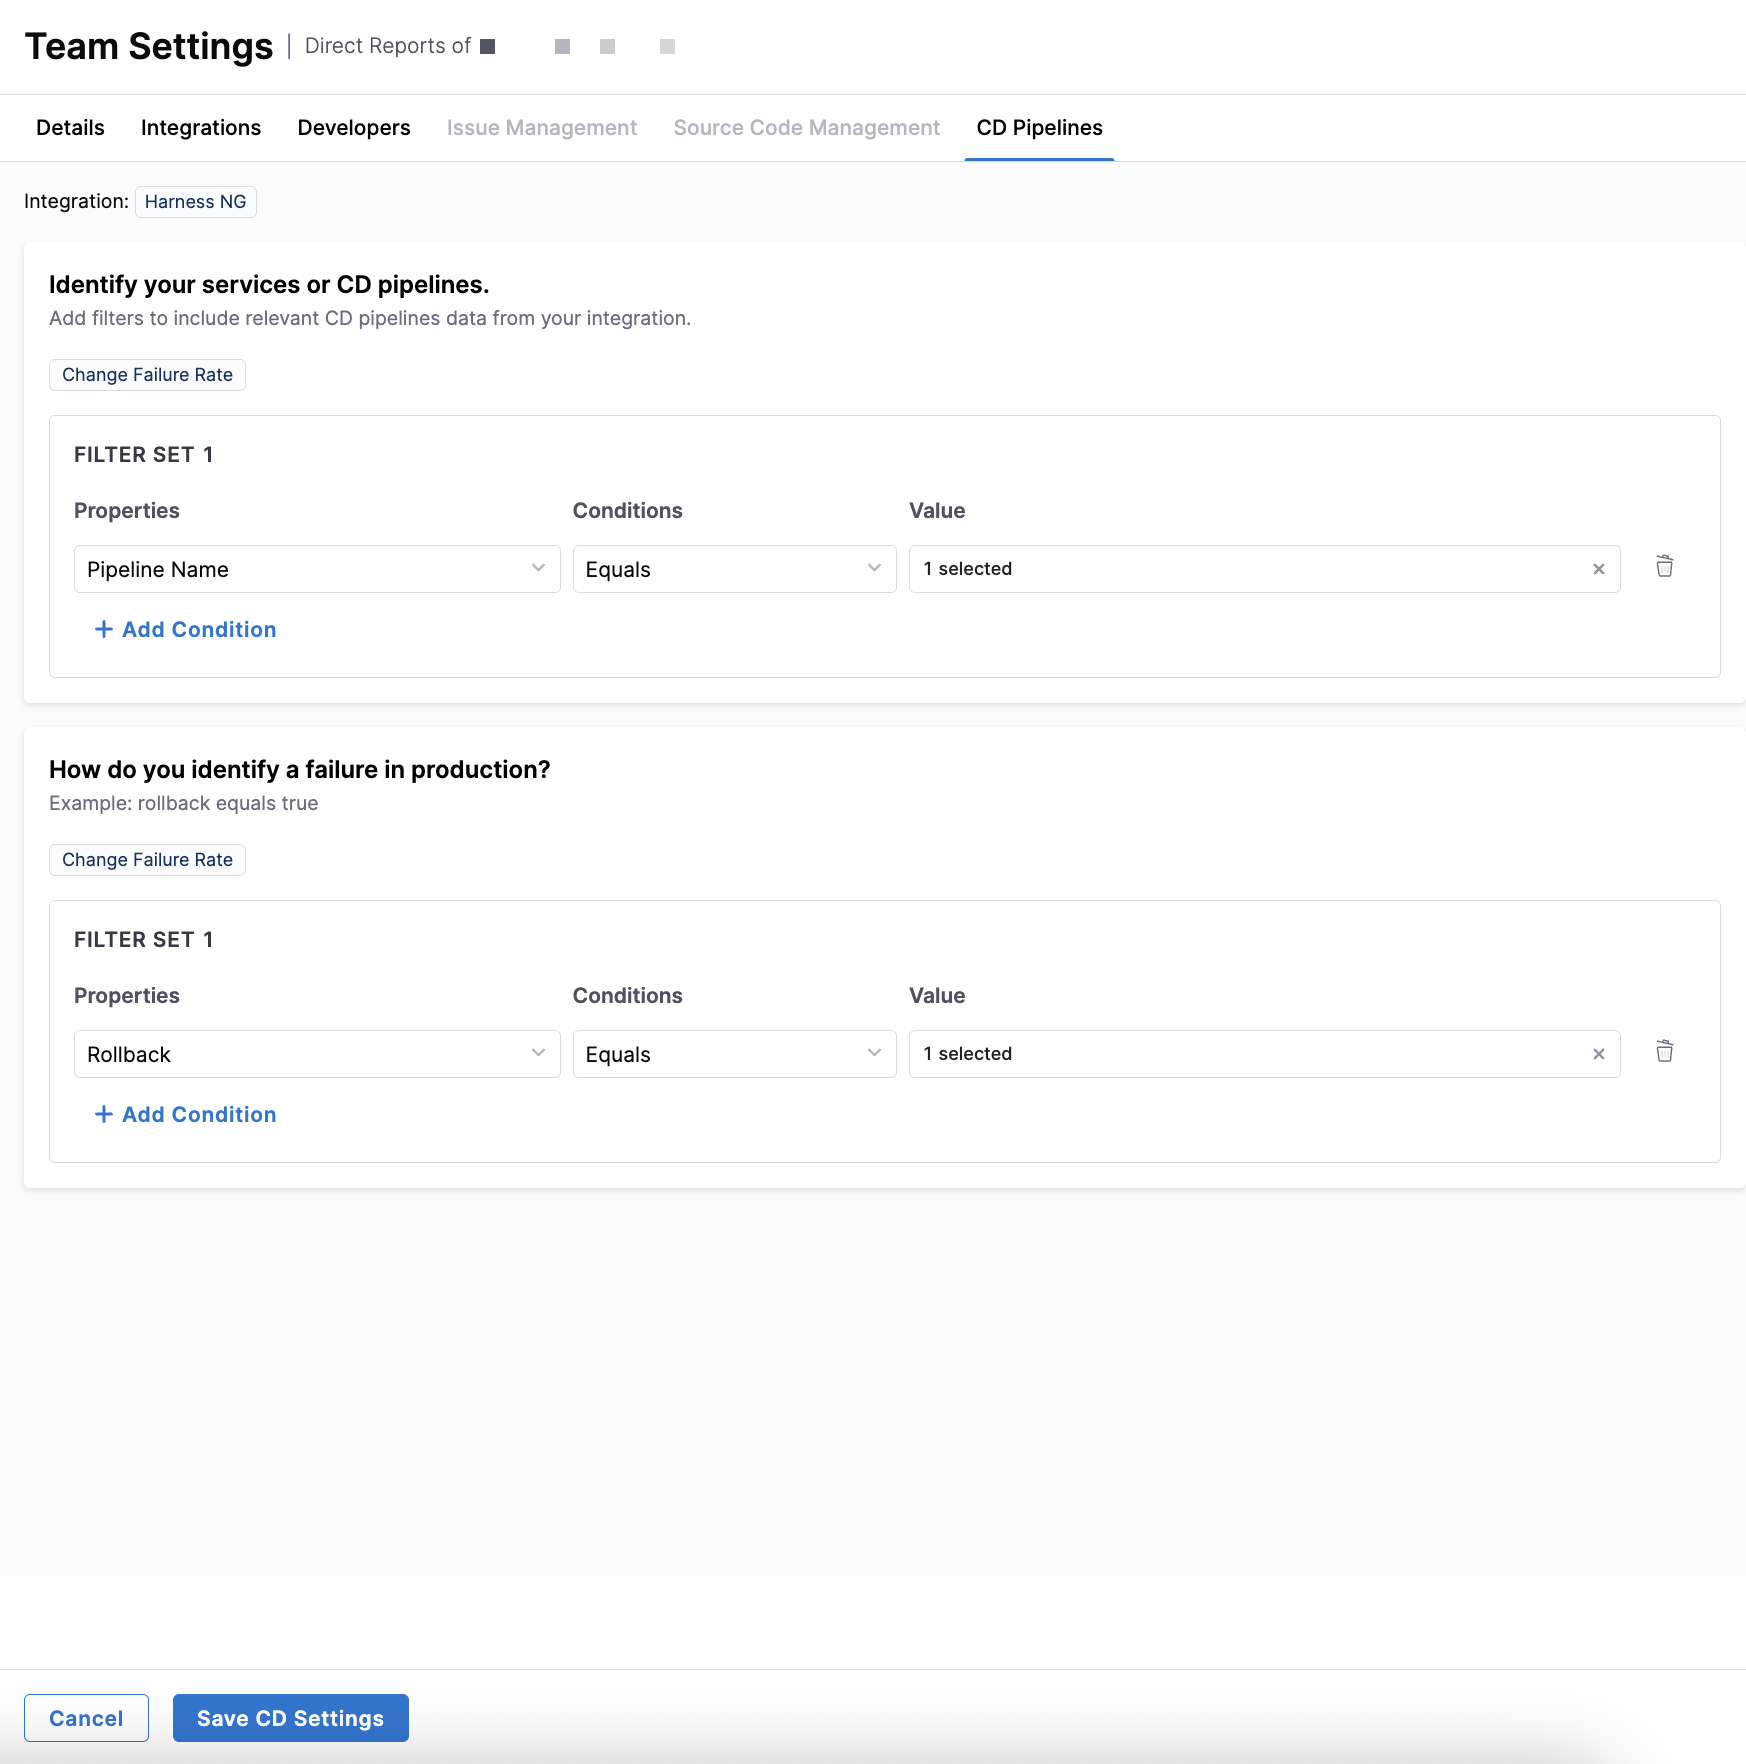
Services or CD pipelines
Define the scope of CD pipelines by creating one or more filter sets.
| Filter field | Available options |
|---|---|
| Properties | Service Name, Infrastructure ID, Environment ID, Tags, Pipeline Name, Project, Organization |
| Conditions | Equals, Not Equals, Contains, Does Not Contain, Starts With, Ends With |
| Values | Values from your CD system (for example, service names, pipeline names, or tags) |
To include pipelines by name, use Pipeline Name Contains deploy. To scope services to a production environment, use Environment ID Equals prod.
Only services and CD pipelines that match these filters are used to calculate Change Failure Rate.
Failed deployments or rollbacks
Define how AI DLC Insights detects failed deployments or rollbacks in your CD system. These filters determine when a deployment is classified as a failure.
| Filter field | Available options |
|---|---|
| Properties | Pipeline Status, Rollback |
| Conditions | Equals, Not Equals |
| Values | Values from your CD system (for example, Failure, true) |
To identify a rollback, use Rollback Equals true. To identify failed executions, use Pipeline Status Equals Failure.
Correct failure detection ensures AI DLC Insights accurately calculates Change Failure Rate.
After completing all CD Pipelines filters, click Save CD Settings to apply the configuration to the team.
Security Insights is in beta. To request access, contact Harness Support.
Use the Security tab in Team Settings to define how AI DLC Insights maps Application Security Posture Management (ASPM) data to your teams.
Click + Add Condition to set the scope of security assets. These filters determine which ASPM data is associated with the team and used to calculate security-related metrics. If you add several filter sets, these filter sets are evaluated together to determine the final scope of security data mapped to the team.
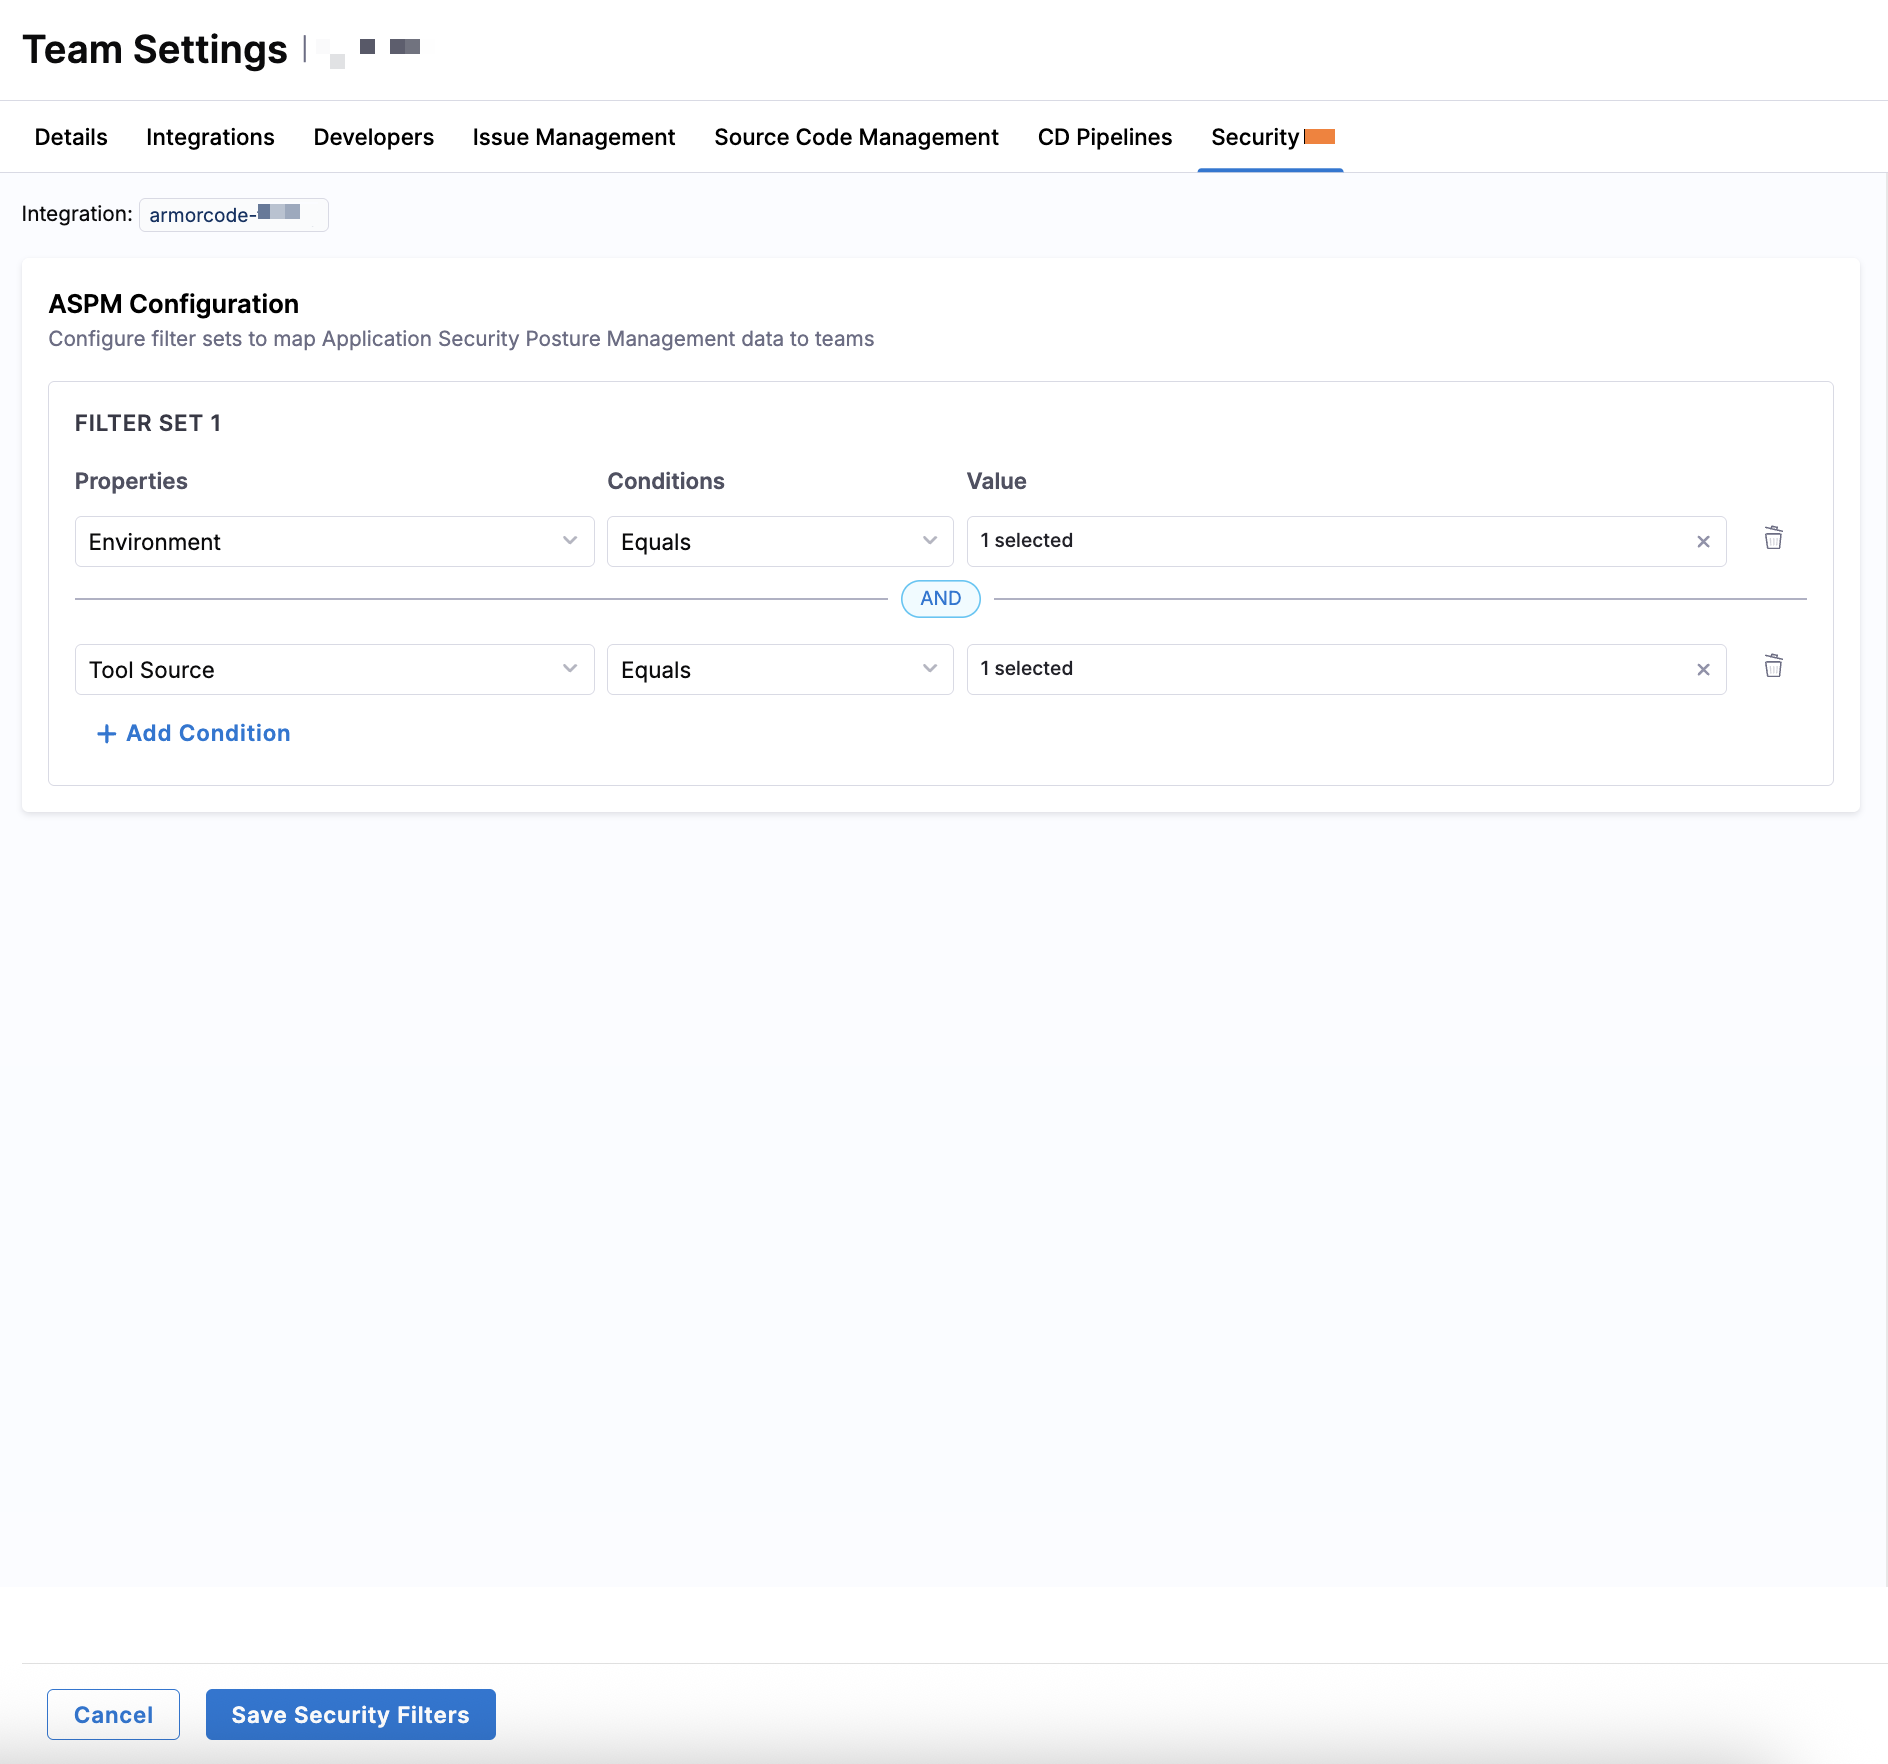
| Filter field | Available options |
|---|---|
| Property | Product Name, Sub Product Name, Environment, Asset Name, Asset Type, Asset URL, Tool Source |
| Condition | Equals, Contains, Starts With, Ends With |
| Value | A value from your ASPM data (for example, production, api-service, or snyk) |
To associate assets from a specific environment, use Environment Equals Production. To scope assets by a source, use Tool Source Equals Snyk.
Only ASPM data that matches these filters is used to calculate Security metrics in AI DLC Insights.
After adding Security filters, click Save Security Filters to apply the configuration to the team.
Use the Incident Management tab in Team Settings to define how AI DLC Insights maps incident and change request data from ServiceNow to your teams. Filters determine which records are included in metric calculations.
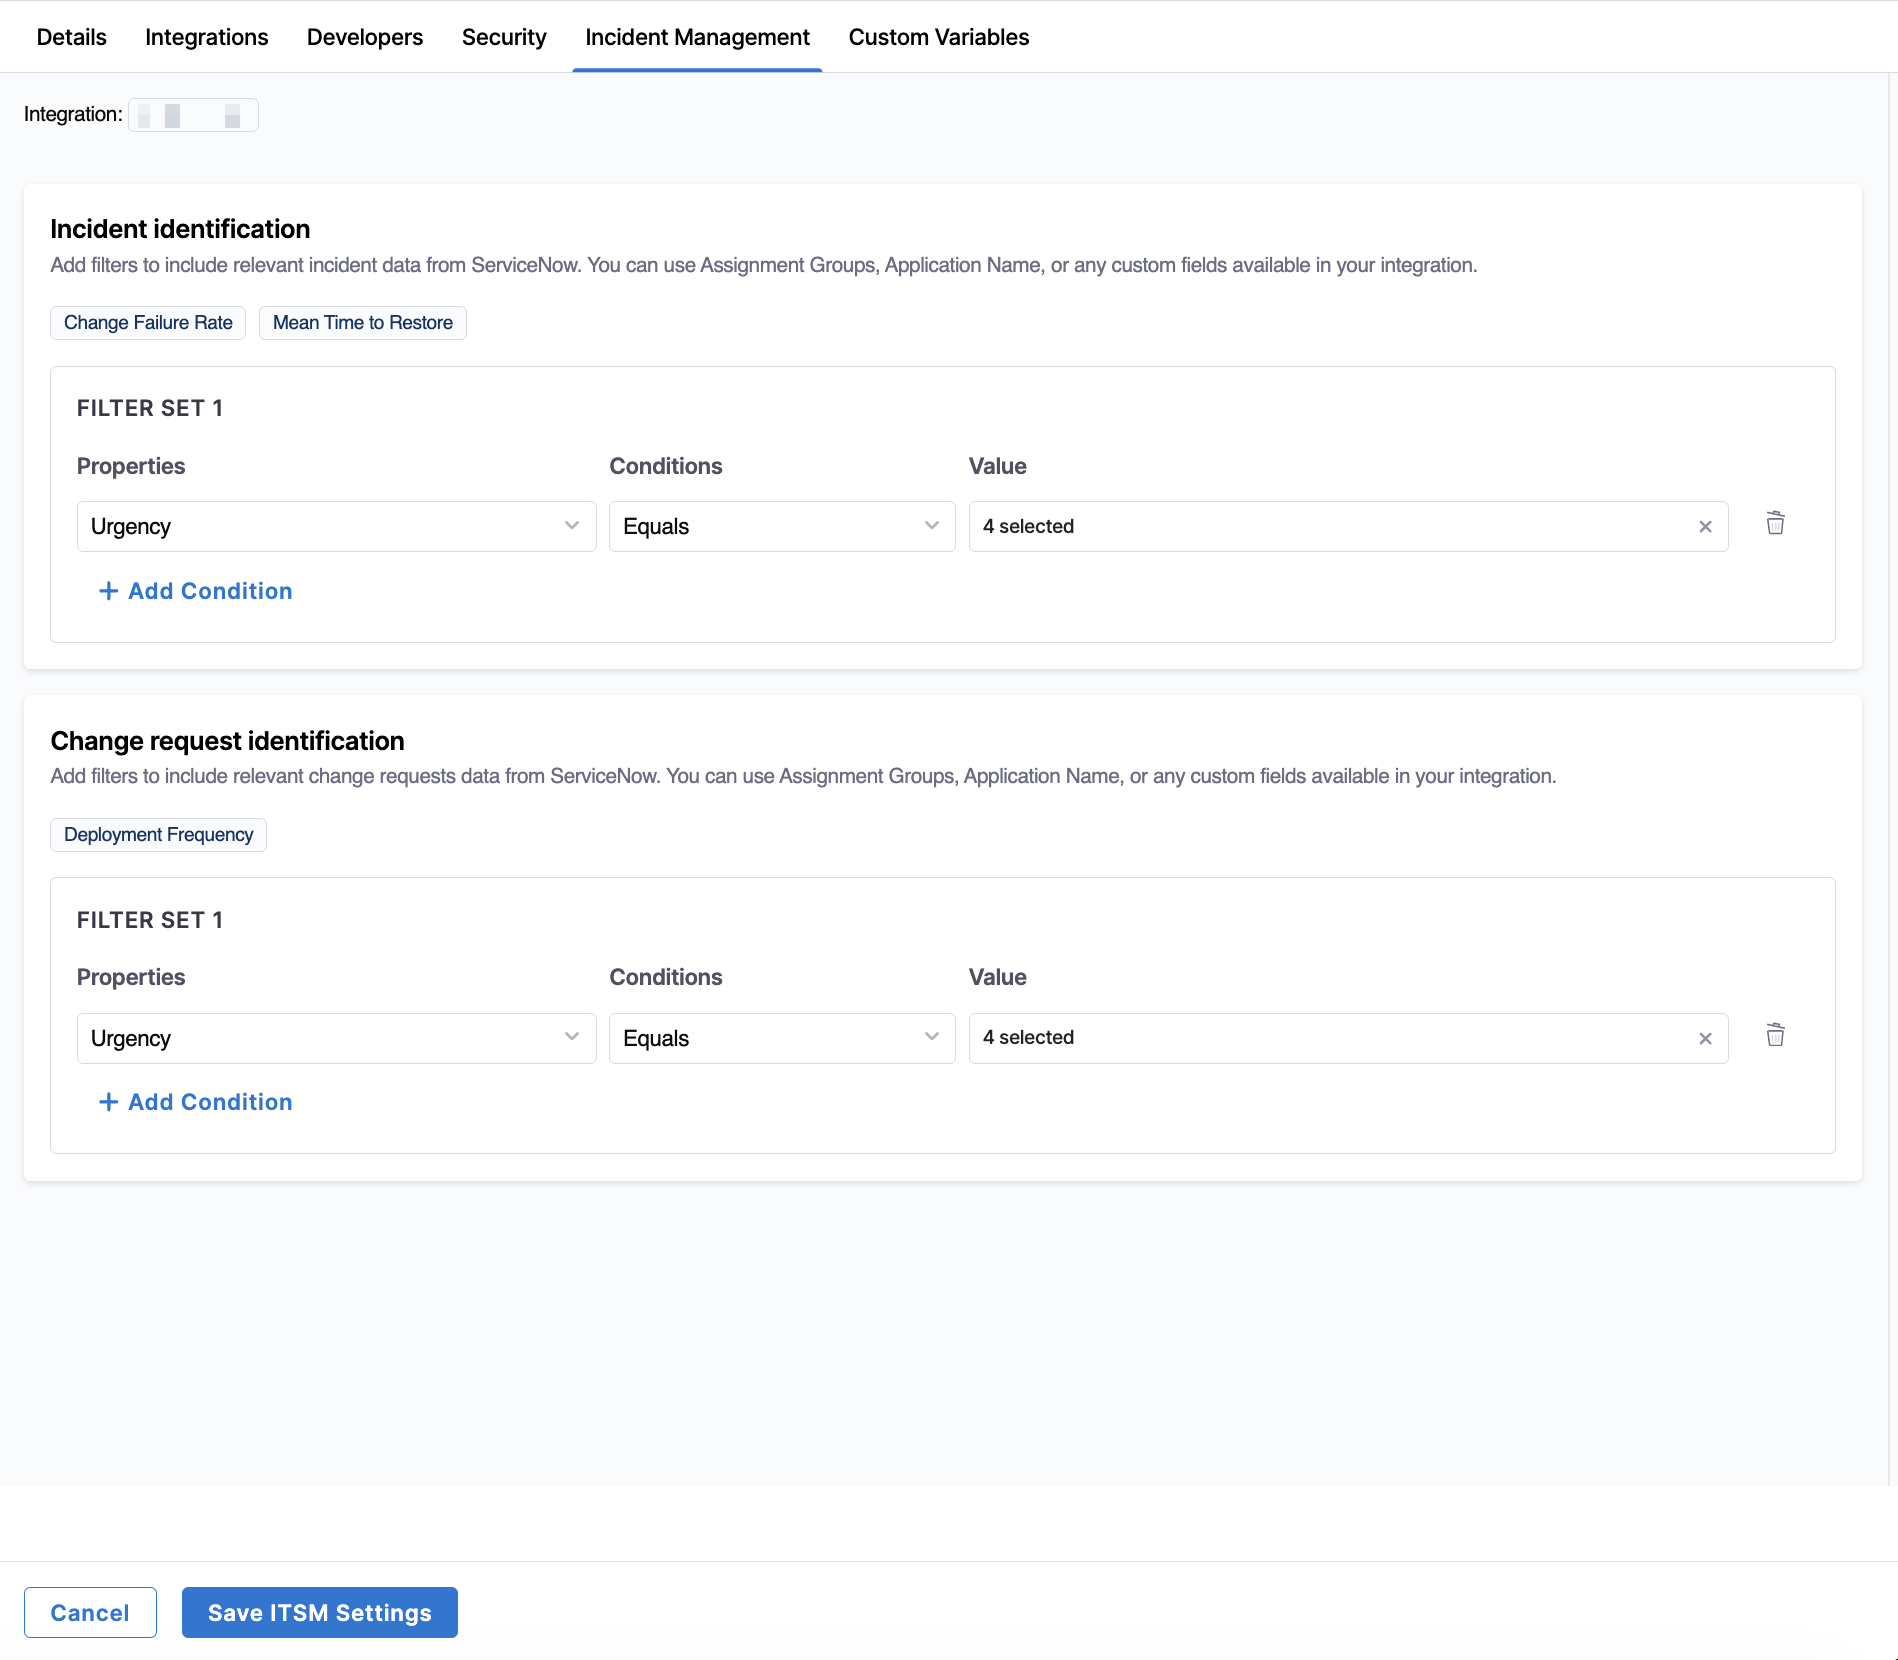
Click + Add Condition to define filter sets for incident identification and change request identification using fields such as Assignment Group or custom fields available in your ServiceNow integration.
Use the AND/OR toggle to control how conditions are evaluated:
AND: All conditions must be true for data to be included.OR: Any condition can be true for data to be included.
For example, Assignment Group Equals Platform AND Urgency Equals High includes only high-urgency incidents owned by the Platform team, while Urgency Equals High OR Urgency Equals Medium includes all high and medium-priority records.
Incident identification
Add filters to include relevant incident data from ServiceNow.
| Filter field | Available options |
|---|---|
| Property | Assignment Group, Priority, Severity, Business Service, Urgency, and custom fields |
| Condition | Equals, Not equals, Contains, Does not contain, Starts with, Ends with |
| Value | Values from your ServiceNow data |
For example, Urgency Equals High only includes high-priority incidents, Urgency Equals High OR Urgency Equals Medium includes both high and medium priority incidents, and Assignment Group Equals Mobile scopes incidents to a specific team.
Correct incident identification ensures AI DLC Insights accurately calculates Change Failure Rate and MTTR.
Change request identification
Add filters to include relevant change request data from ServiceNow.
| Filter field | Available options |
|---|---|
| Property | Assignment Group, Priority, Severity, Business Service, Urgency, and custom fields |
| Condition | Equals, Not equals, Contains, Does not contain, Starts with, Ends with |
| Value | Values from your ServiceNow data |
For example, Urgency Equals High only includes high-priority change requests, Assignment Group Equals Platform scopes changes to a specific team, and Business Service Contains Payments includes changes to a specific service.
Correct change request identification ensures AI DLC Insights accurately calculates Deployment Frequency.
After configuring filters, click Save ITSM Settings to apply the configuration.
Configure team-specific custom variables
Studio is in beta. To request access, contact Harness Support.
Use the Custom Variables tab in Team Settings to override default values for variables defined in Studio metrics. Custom variables are created in the Query Variables menu on the Studio page and automatically appear for each team. You can override the default value to tailor how metrics are computed for that specific team.
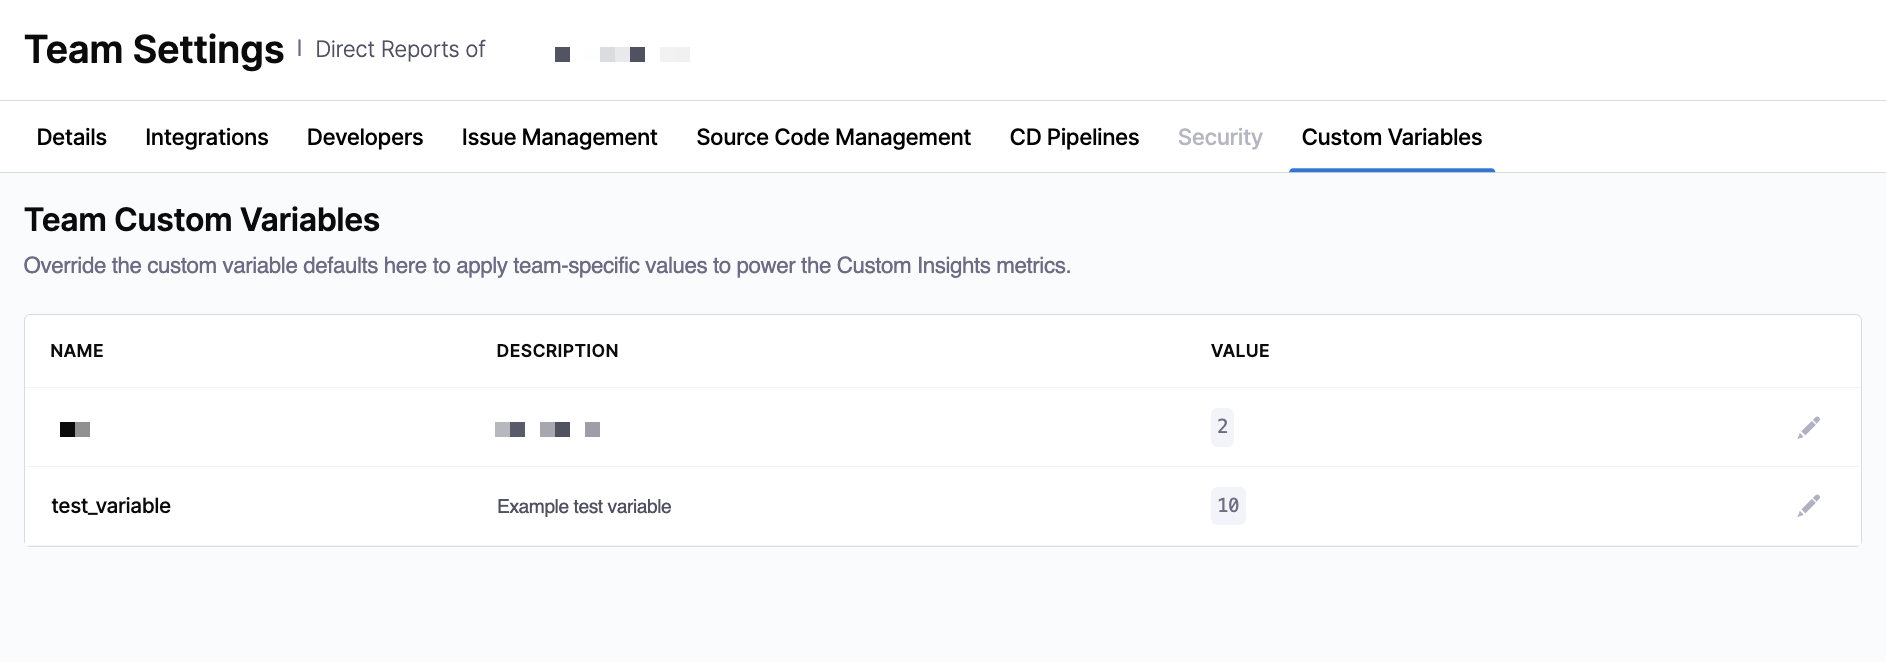
Each variable includes the following fields:
| Field | Description |
|---|---|
| Name | The variable identifier used in queries (for example, ${priority_issues}). |
| Description | A description of what the variable controls. |
| Value | The team-specific value that overrides the default. |
To override a variable:
- Click the Edit icon next to a variable value.
- Enter a new value.
- Click the Checkmark icon to save.
If no override is provided, the default value defined in Studio is used. Overrides apply only to the selected team, and changes affect how metrics are calculated in Studio dashboards.
Access insights
After you save your tool-specific settings, AI DLC Insights automatically attributes data to your team, mapping events and activity from integrated systems based on your filters and developer identifiers. AI DLC Insights calculates all relevant Efficiency, Productivity, and Business Alignment metrics using your defined criteria, and all dashboards on the Insights page update reflect these data-driven insights in real time.
Once your settings are configured, you can explore team insights by reviewing metrics and trends for individual teams and organizational insights by analyzing aggregated data across your Org Tree.