Issues reports
Use these issues reports to analyze data related to issues in issue management systems, such as Jira. Some reports can also be used for support tickets and tickets or issues that cover multiple systems (support, issue management, SCM, and CI/CD).
Issue count reports
Issue count reports are versatile reports that you can use to examine metrics related to tickets or work items (epics, stories, bugs, tasks, story points, and so on) in your issue management system. You can examine any measurable aspect of your issue management data, such as type, priority, status, labels, components, or any other field, including custom fields.
- Issues Report: Analyze issues by priority, status, or any other field.
- Issues Trend Report: Examine changes over time in issues.
- Issues Single Stat: Show a single stat.
- Issue First Assignee Report: This is an initial response and assignment time report.
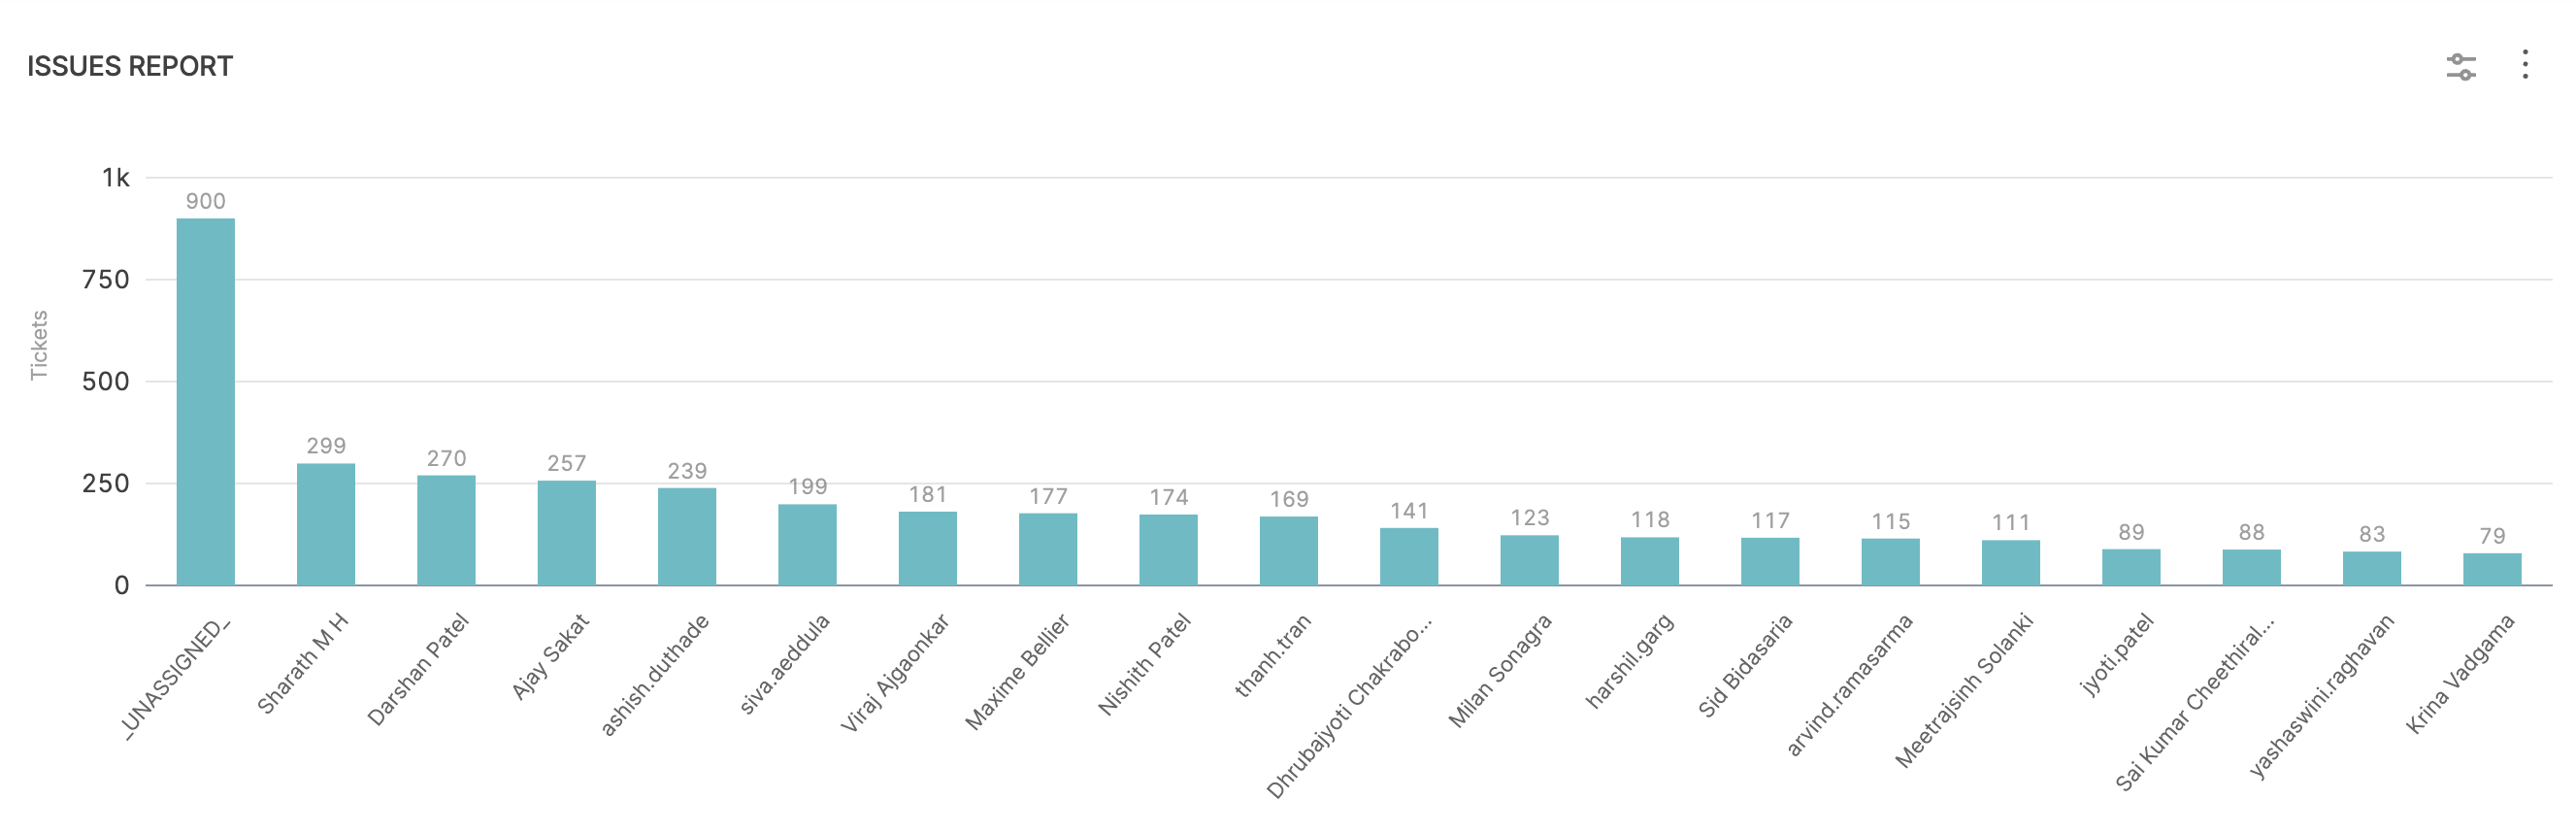
Issues Report
Definition
Use the Issues Report to examine metrics related to issues in your issue management system. The report aggregates data based on selected attributes, such as priority, status, labels, components, or any other field. This report helps you create comparisons based on various fields and draw conclusions to make decisions.
Add the report
To configure the Issue Hygiene report, follow these steps:
Step 1: Add the widget
- Go to the Insight where you want to add the widget, Select Settings, and then Add Widget.
- Choose the Issues Report widget.
The following settings are available to configure the Issues Report:
Step 2: Configure the Filters for the widget
Select attributes that you want to use to filter the data, and then select filter values and operators. Depending on the selected attribute, you can select one or more filter values, select values to exclude, or use pattern matching rather than strict values. If you add multiple filters, they are inherently combined by AND operators.
- Dependency Analysis: Use this option to include dependent or linked issues in the data.
- Status: Select specific issue statuses to include in the data.
- Projects: Select specific projects to include in the data.
Step 3: Select the Metrics to measure on the widget
Select a metric to use for the Y-axis. You can select either Number of Tickets or Sum of Story Points.
Step 4: Configure the Aggregations for the widget
- X-axis: Select the attribute to use for the X-axis. For example, if you selected the Number of Tickets metric for the Y-axis, you could select Issues Resolved by week for the X-axis. Additional examples of X-axis dimensional attributes include Project, Assignee, Labels, Priority, and so on.
- Stacks: Select how you want to group data in each X-axis dimension. For example, if you select Priority for the X-axis and stack by Status Category, then data in each X-axis column are grouped by status.
Step 5: Configure the Settings
- Select the issue management system to use for this widget. Available options are based on your SEI integrations.
- Select how you want to sort X-axis data, such as ascending or descending.
- Select the maximum number of values to show on the X-axis.
- Select the visualization style for the widget, such as bar chart, donut chart, multi-line chart, or percentage-stacked bar chart.
- Select the date format.
Step 6: Save the widget
Complete the widget settings and select Next: Place Widget, place the widget on Insight and then select Save Layout.
Issues Report use cases
Here are some examples of configurations for the Issues Report.
Defects raised weekly
To configure the Issues Report to show bug tickets created weekly:
- On the Filter tab, add an Issue Type filter set to Bug/Defect.
- For the time range, either Use Insight time or set Issue Created In to the desired time range. Use Insight time allows the user to select a desired time range when viewing the Insight.
- On the Metrics tab, select Number of Tickets.
- On the Aggregations tab, set X-axis to Issue created by week.
- On the Settings tab, set the Visualization to Bar Chart.
- Set the widget Name to Defects raised weekly.
Stories resolved weekly
To configure the Issues Report to show stories resolved weekly:
- On the Filter tab, add an Issue Type filter set to Story.
- For the time range, either Use Insight time or set Issue Created In to the desired time range. Use Insight time allows the user to select a desired time range when viewing the Insight.
- On the Metrics tab, select Number of Tickets.
- On the Aggregations tab, set Stacks to Priority, and set X-axis to Issue resolved by week.
- On the Settings tab, set the Visualization to Bar Chart.
- Set the widget Name to Stories resolved weekly.
Distribution of tickets in an active sprint
To configure the Issues Report to show the distribution of tickets in the active sprint:
- On the Filter tab, add a Sprint filter set to Select Active Sprints only.
- On the Metrics tab, select Number of Tickets.
- On the Aggregations tab, set Stacks to Issue Type, and set X-axis to Sprint.
- On the Settings tab, set the Visualization to Bar Chart.
- Set the widget Name to Active sprint tickets distribution.
Team workload (in stories)
To configure the Issues Report to show the number of stories associated with each team member for a given time period:
-
On the Filter tab, add a Status filter, set the value to all closed statuses (Done, Closed, Resolved, Won't Do, and so on), and select Exclude.
This ensures the widget only shows active or not-started work.
-
On the Metrics tab, select Number of Tickets.
-
On the Aggregations tab, set Stacks to Issue Type, and set X-axis to Assignee.
-
On the Settings tab, set the Visualization to Bar Chart.
-
Set the widget Name to Team workload.
Issue resolution time reports
Issue resolution time reports help you understand how long tickets remain open, including cycle time and lead time metrics.
- Issue Resolution Time Report: A configurable bar graph showing the number of tickets closed along with the average time it took to close those tickets, based on the time the tickets were created.
- Issue Resolution Time Trend Report: Monitor changes over time in issue resolution time.
- Issue Resolution Time Single Stat: A single stat widget showing the number of issues marked as resolved in a given time period.
- Issue Time Across Stages: Analyze cycle time by status. Cycle time is the elapsed time for an iteration of the issue workflow, from open to close.
- Issue Lead Time by Stage Report
- Issue Lead Time By Type Report
- Jira Releases Report: Analyze your team's release pattern by understanding the average time elapsed between issue creation and release.
Mean Time To Recover (MTTR) and Mean Time Between Failures (MTBF) are DORA metrics. You can use the Issue Resolution Time Report and Issue Resolution Time Single Stat widgets to monitor MTTR and MTBF. To do this, configure the filters and settings for these widgets so that they only track issues related to failure recovery.
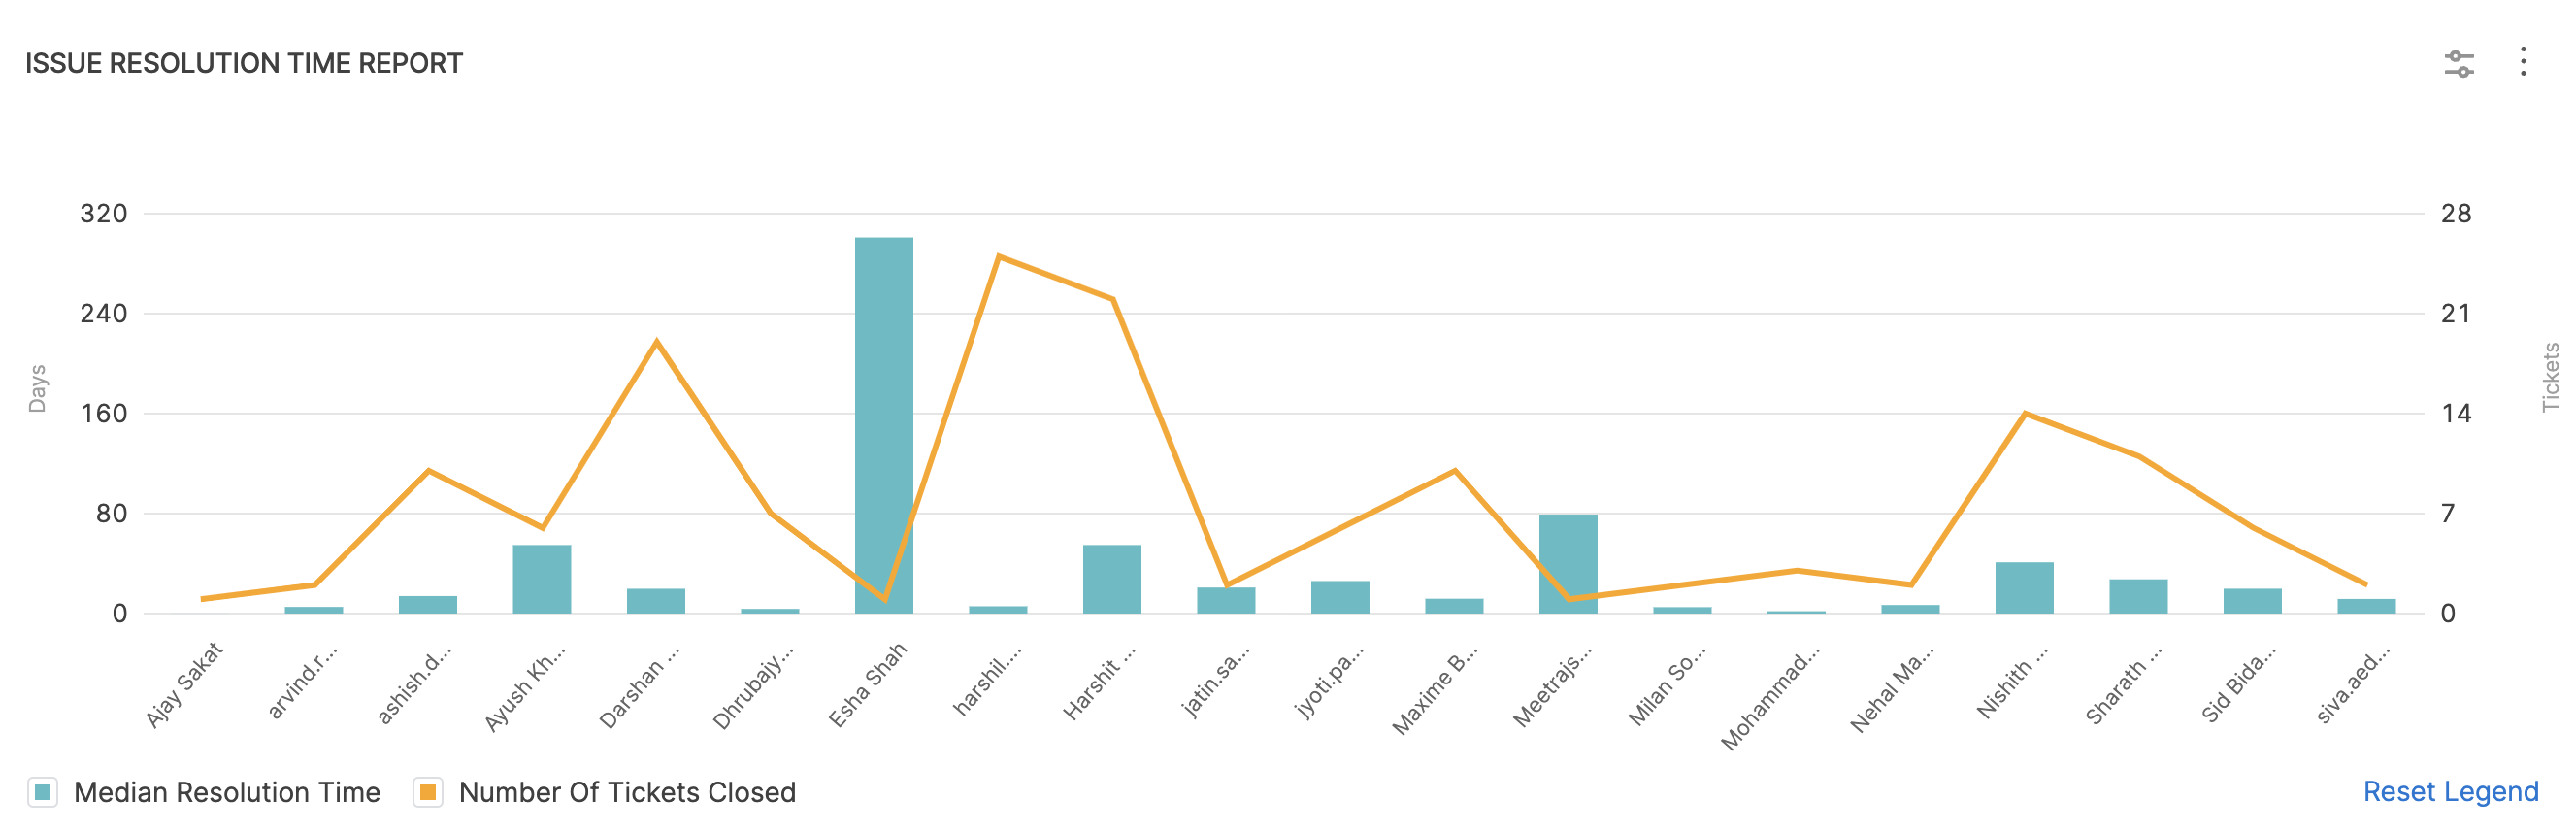
Issue Resolution Time Report
Definition
The Issue Resolution Time report helps you understand how long tickets remain open, including cycle time and lead time metrics. The report displays a configurable Bar Graph showing the number of tickets closed along with the average time it took to close those tickets, based on the time the tickets were created.
The Issue Resolution Time Report can help answer questions like:
- Is my team getting faster at delivering features or fixing issues?
- Is the resolution times for a project or component decreasing over time?
- On average, how long does it take fix customer issues? Are we able to meet the SLA timeline?
Add the report
Step 1: Add the widget
To configure the Issue Resolution Time report, follow these steps:
- Go to the Insight where you want to add the widget, Select Settings, and then Add Widget.
- Choose the Issue Resolution Time report widget.
Step 2: Configure the Filters on the widget
By default, the Issue Resolution Time Report is filtered by issues closed (Last Closed Date) within a selected time range. Usually, the time range is set to Use Insight time, which allows the user to select a time range when viewing Insights.
Step 3: Configure the Aggregations for the widget
On the Aggregations tab, you can select the dimension, from your issue management system, to use for the X-axis, such as Assignee, Story Points, Ticket Category, Issue Closed Last Time Period, and so on. This determines what you want the widget to focus on. For example, focusing on Category or Component can show you the issue resolution time for different work areas; whereas, focusing on Assignee can show you issue resolution time by developer.
Step 4: Configure the Settings
On the Settings tab, you can:
- Select the issue management system to use for this widget. Available options are based on your configured SEI integrations.
- Select how you want to sort X-axis data, such as ascending or descending.
- Select the maximum number of unique values to show on the X-axis.
Step 5: Save the widget
Complete the widget settings and select Next: Place Widget, place the widget on Insight and then select Save Layout.
Issue Resolution Time Report use cases
The primary way to modify the Issue Resolution Time Report is to change the X-axis dimension on the Aggregations tab. Here are some examples of configurations for this widget.
Average time to issue closed by assignee
This configuration produces a bar graph showing which assignees are taking the most time to close issues within the selected time frame.
- On the Aggregations tab, select Assignee for the X-axis dimension.
- On the Settings tab, set Sort X-axis to By Value, High --> Low, and set the Max X-Axis Entries high enough so that it can show all team members.
Median bug resolution time by priority
This configuration produces a bar graph showing the median resolution time for bugs, grouped by priority.
-
On the Aggregations tab, select Issue Last Closed (Week, Month, Quarter) for the X-axis dimension. Set the date to the desired time range, such as the last four quarters.
-
On the Filters tab:
- Add a Type filter, and set the filter value to Bug.
- Add a Status Category filter, and add filter values for done-equivalent statuses that you want to track, such as done, closed, resolved, and so on.
-
On the Settings tab, set Sort X-axis to Priority, and set the Max X-Axis Entries high enough so that it can show all priority levels.
-
For Stacks, use the Median Resolution Time and the Number of Tickets.
Story point estimation accuracy
This configuration produces a bar graph showing how well your story points are estimated. Good estimation is evidenced by a graph showing linear progression, with higher point issues taking longer to resolve than lower ones.
- On the Aggregations tab, select Story Points for the X-axis dimension.
- On the Filters tab, exclude backlog stages by adding an Exclude Time In Status filter, and set the filter value to your backlog status(es), such as To Do or Backlog.
- On the Settings tab, set Sort X-axis to By Label, Low --> High.
MTTR and Lead Time for Changes
This configuration produces a bar graph showing a historical record of the average time it took to close all issues within the selected time frame.
-
On the Aggregations tab, select Issue Last Closed (Week, Month, Quarter) for the X-axis dimension.
-
On the Filters tab, add filters to demonstrate MTTR or Lead Time For Changes trends:
- For MTTR: Add an Issue Type filter, and set the filter value to Bugs.
- For Lead Time For Change: Add an Issue Type filter, and set the filter values to Tasks and Stories.
-
On the Settings tab, set Sort X-axis to By Label, Low --> High.
Median issue resolution time over time
This configuration produces a bar graph showing the median resolution time to close all issues each month in the selected time frame.
- On the Aggregations tab, select Issue Last Closed (Week, Month, Quarter) for the X-axis dimension. Set the date to the desired time range, such as the last four months.
- On the Filters tab, add a Status Category filter, and add filter values for all the closed-equivalent statuses that you want to track, such as done, closed, delivered, won't do, and so on.
- On the Settings tab, set Sort X-axis to Issue Closed Month.
- For Stacks, use the Median Resolution Time and the Number of Tickets, which will show, for each bar on the bar chart, the median resolution time for all tickets closed in that month.
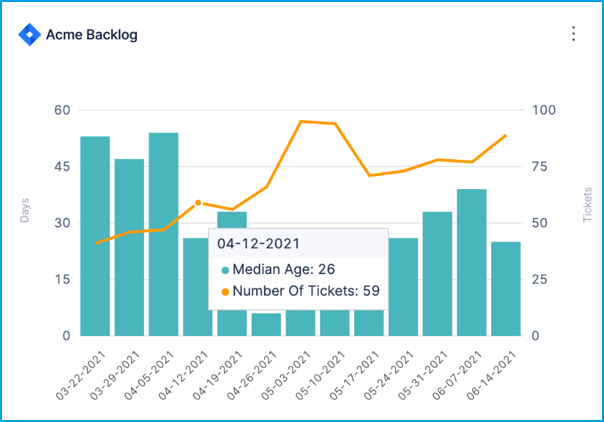
Issue Backlog Trend Report
The Issue Backlog Trend report allows you to analyze the historical data of your current issues. This report can help you answer questions about your backlog. To learn more, go to Issue Backlog Trend Report.
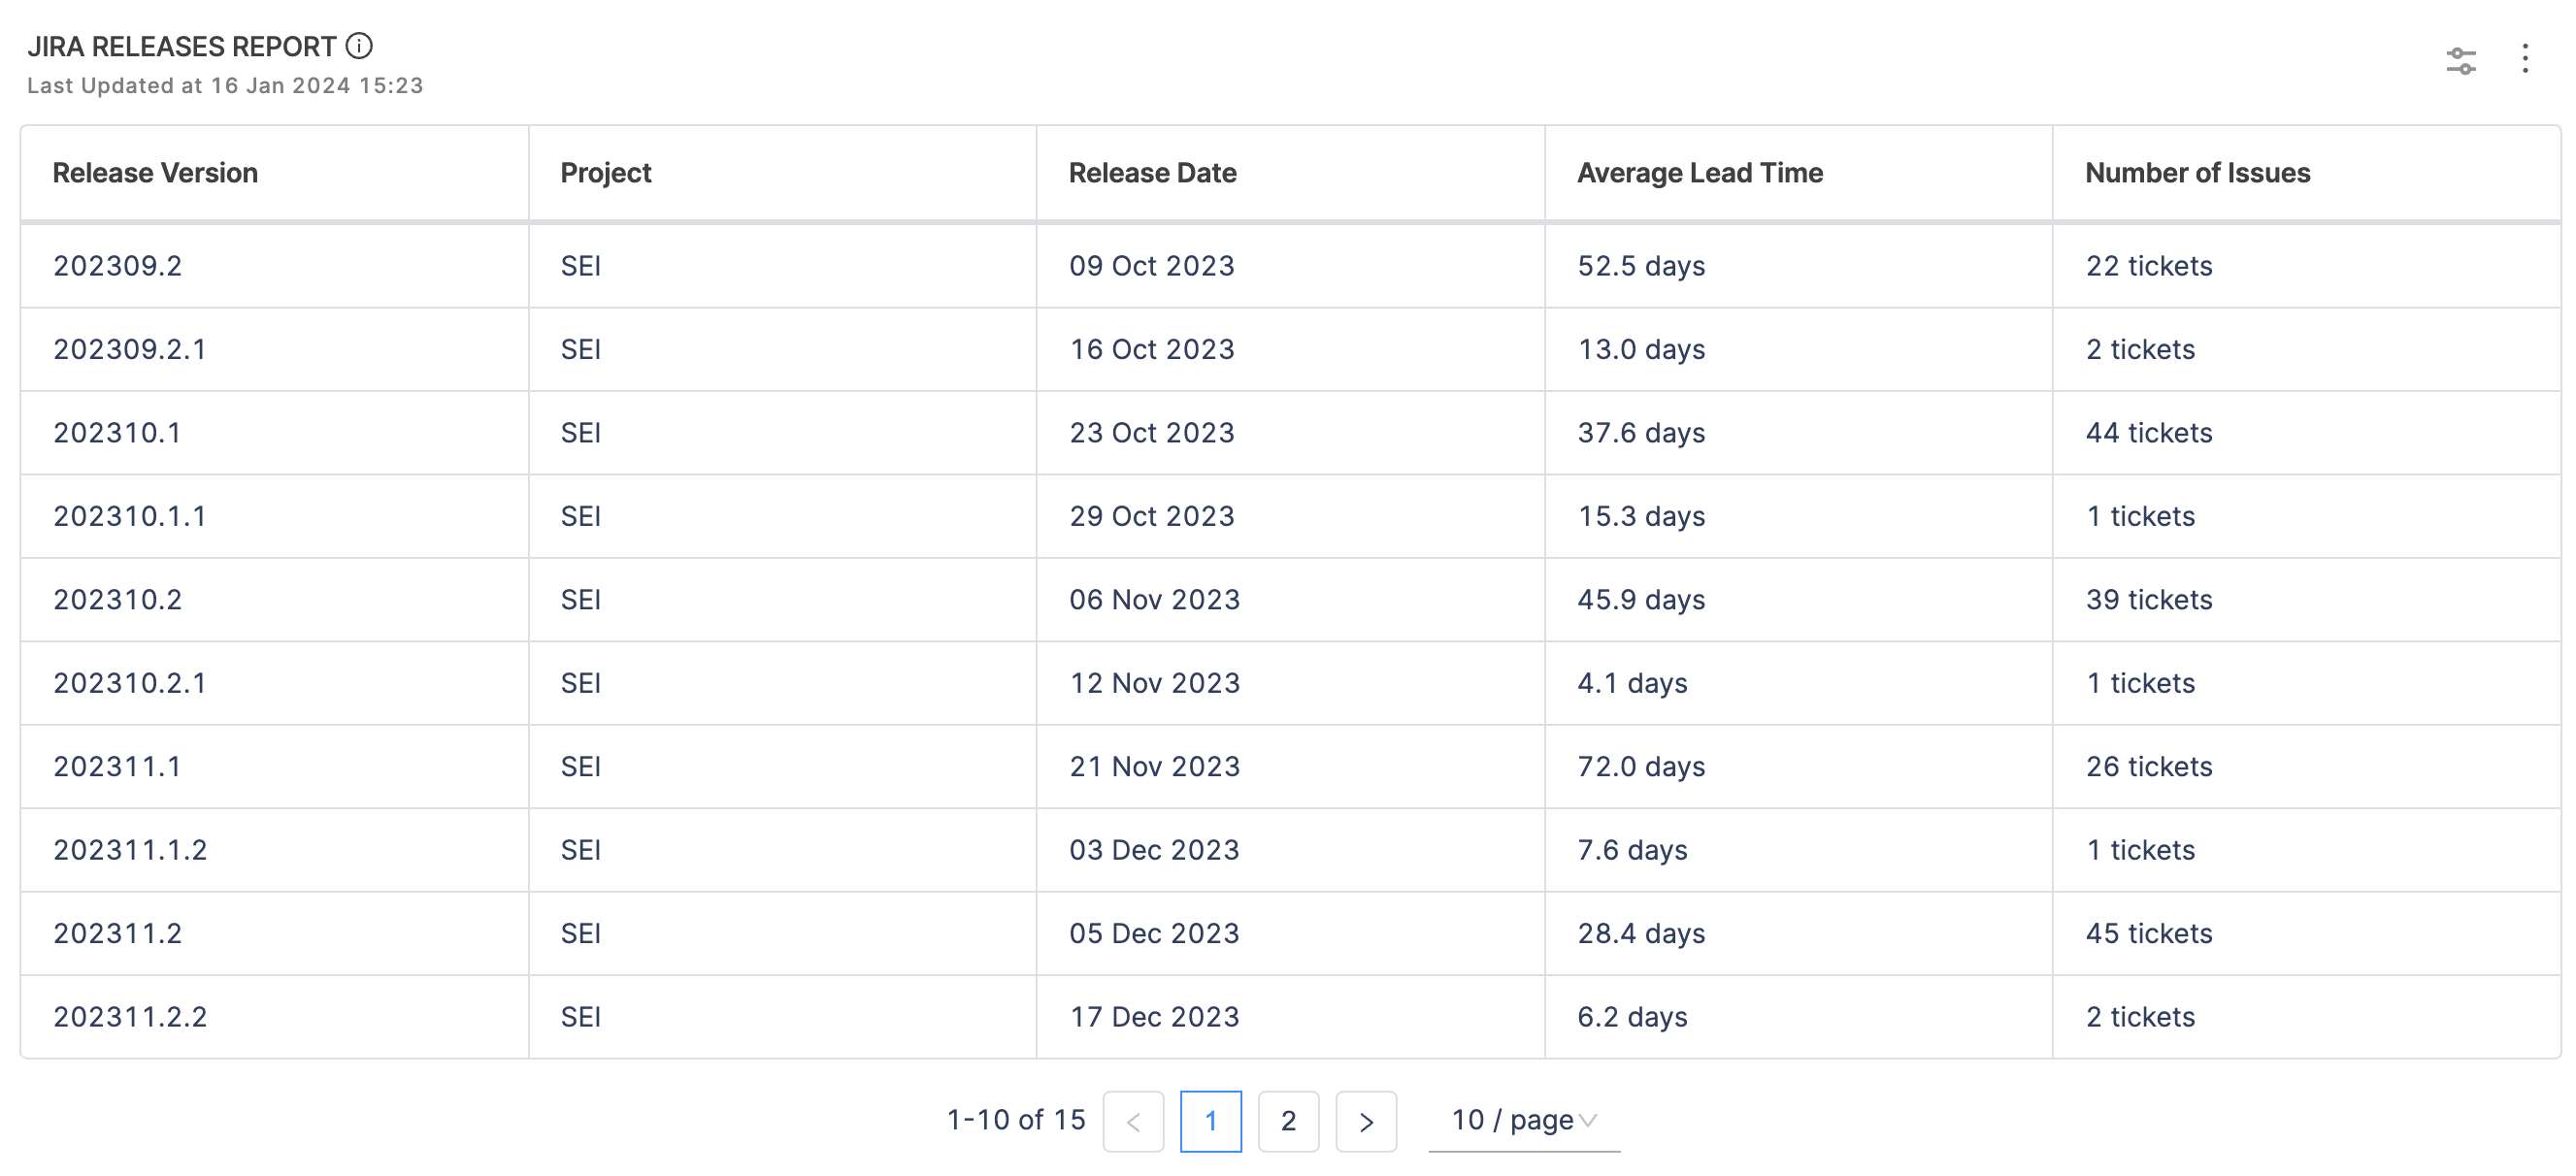
Jira Releases Report
Definition
Use the Jira Releases Report to analyze your team's release pattern by understanding the average time elapsed between issue creation and release.
Benefits
The benefits of the Jira Releases Report include:
- In-depth analysis: By combining Jira releases with lead time measurements, you can understand the time taken for each stage of your release process. This helps you identify areas where you can optimize and make data-driven decisions to improve efficiency.
- Improved predictability: By tracking lead time for each release, you can gain a better understanding of the time required to deliver features and enhancements. This improved predictability allows you to set realistic expectations with stakeholders and ensure smoother project planning and resource allocation.
- Continuous process improvement: The combination of Jira releases and lead time measurements facilitates a continuous improvement mindset. By analyzing lead time data, you can identify patterns, recurring issues, and areas of inefficiency.
Add the report
To configure the Jira Releases report, follow these steps:
Step 1: Add the report
- Go to the Insight where you want to add the widget, Select Settings, and then Add Widget.
- Choose the Jira Releases report widget.
Step 2: Configure the Filters for the widget
This widget requires both the Release Date and Resolution Time of issues as mandatory inputs. This is because the deployment process can only include tickets that have reached the Resolved status.
You can select any attributes, such as priority, status, labels, components, or any other field, to precisely refine this report according to your release process. Available options are based on your SEI integrations. If you add multiple filters, they are inherently combined by AND operators.
Step 3: Configure the Settings
Select the Jira-based Velocity Lead Time profile for this report. Since this report measures only the Jira releases thus the widget can only be associated with the Jira-based Velocity Lead Time profile.
Step 4: Save the widget
Complete the widget settings and select Next: Place Widget, place the widget on Insight and then select Save Layout.
Use the Jira Releases Report along with the Lead Time by Time Spent in Stages Report, which can show you a breakdown of stages that contribute to the average lead time value present in your Jira Releases Report.
Best practices
To get the most benefit from this report, the following best practices are recommended:
- Practice good Jira hygiene, especially when changing issue statuses. Selecting the incorrect status, having an unclear status workflow, or having too many similar statuses can result in poor or inaccurate lead time measurements.
- Whenever possible, map issues to a single version, rather than multiple versions.
- Make sure all Done issues are eventually moved to the Resolved status (Ideally, moved to completion from the development and testing perspective).
- Perform releases only after all linked issues are in the Resolved status.
Initial response and assignment time reports
These reports measure the first assignee or response on an issue, including who receives the most "first assignments" and how much time passes between issue creation and the first assignment or response.
- Issue First Assignee Report: Analyze the time taken for initial assignment of issues (from issue creation to first assignment). You can use this to confirm that high priority issues are being assigned as soon as possible.
- Issues By First Assignee: Analyze who receives the most "first assignments" for issues.
- Issue Response Time Report: Issue response time is the elapsed time between when an issue is created and the first response.
- Issue Response Time Trends Report: Analyze changes over time in initial response time.
- Issue Response Time Single Stat: Show a single stat related to initial response time.
For details about issues bouncing between assignees or being reassigned to new assignees, use the issue bounce reports and issue hops reports.
For details about issues that are in the backlog or sitting with one assignee for a long time, use the issue backlog reports.
Issue backlog reports
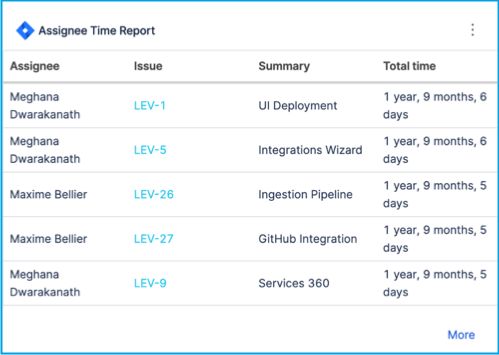
- Issue Assignee Time Report: A table of issues that have sat with the same assignee for the longest amount of time.
- Issue Backlog Trend Report: Understand whether your issue backlog is under control. This can help answer questions about backlog growth and age. When you configure this widget, make sure the Status Category is set to To Do so that you only track open, unstarted issues. You can use a Project filter to limit the report to a specific project's backlog.
Bounce reports
Bounce describes tickets that are reassigned to a previous assignee or return to a previous stage. Bounce can occur if an issue isn't triaged correctly initially, or if the issue doesn't have enough information to be assigned correctly. Excessive bounce can potentially cause missed SLAs and unnecessary resource utilization.
- Issue Bounce Report: Shows the number of times a ticket "bounced" between assignees. Instances of reassignment to new assignees are captured by the issue hops reports.
- Issue Bounce Trends Report: Analyze changes over time in issue bounce.
- Issue Bounce Single Stat: Show a single stat related to issue bounce.
- Stage Bounce: Analyze the number of times issues bounced between stages.
- Stage Bounce Single Stat: Show a single stat related to stage bounce.
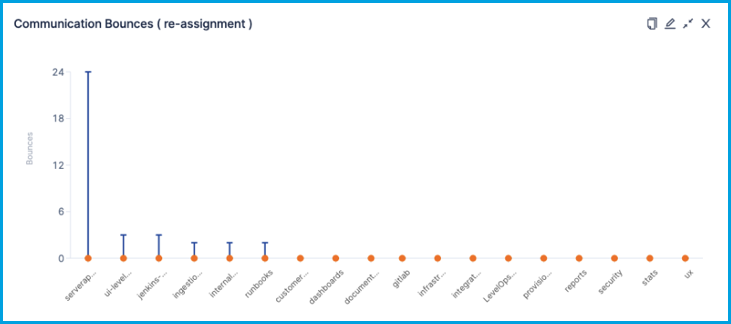
Issue Bounce Report
Definition
This report shows the number of times a ticket "bounced" between assignees. Instances of reassignment to new assignees are captured by the issue hops reports.
The Issue Bounce Report can highlight issues that are being excessively bounced around to different resources. You can then inspect those issues in your issue management system and determine why they are being bounced so much.
Add the report
To configure the Issue Bounce report, follow these steps:
Step 1: Add the widget
- Go to the Insight where you want to add the widget, Select Settings, and then Add Widget.
- Choose the Issue Bounce report widget.
Step 2: Configure the Filters for the widget
- Add additional conditions to specify what data feeds into the widget by creating inclusive and exclusive filters.
- If you include multiple filters, they are inherently combined with an
ANDoperator. - If you want to observe bounce for tickets that have been open for a long time, set the Issue Created In filter to a long time range, such as 90 or 180 days. This can provide insight into why the tickets have been open so long.
Step 3: Configure the Aggregations for the widget
This report is usually configured to observe the median number of bounces by component, project, or initiative. To do this, set the X-Axis to Component, Project, or Initiative.
If you only want the report to track active tickets, include a Status filter, and set it to exclude inactive or closed statuses, such as Done and Won't Do.
Step 4: Configure the Settings
- Select how you want to sort X-axis data, such as ascending or descending.
- Select the maximum number of values to show on the X-axis.
Step 5: Save the widget
Complete the widget settings and select Next: Place Widget, place the widget on Insight and then select Save Layout.
Issue hops reports
Hops describes the number of times a ticket is reassigned to a new assignee (someone who has never been assigned to that issue before). Hops can occur if an issue isn't triaged correctly initially, or if the issue doesn't have enough information to be assigned correctly. Excessive hops can potentially cause missed SLAs and unnecessary resource utilization.
- Issue Hops Report: Shows the number of times tickets "hopped" to new assignees. Instances of reassignment to a previous assignee are captured by the issue bounce reports.
- Issue Hops Trends Report: Analyze changes over time in issue hops.
- Issue Hops Single Stat: Show a single stat related to issue hops.
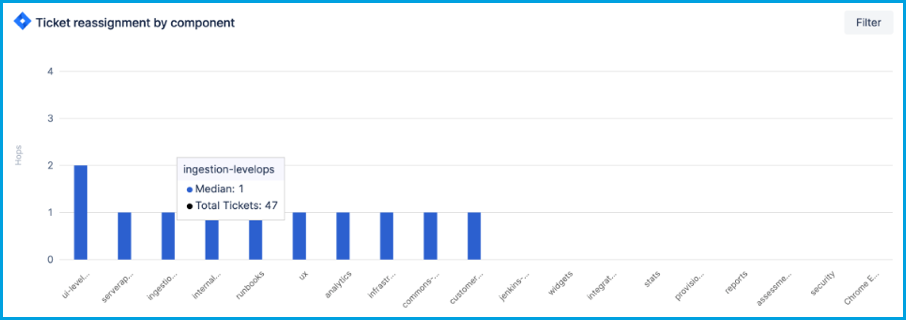
Issue Hops Report
Definition
This report shows the number of times tickets "hopped" to new assignees. Instances of reassignment to a previous assignee are captured by the issue bounce reports.
The Issue Hops Report can highlight issues that are being reassigned excessively. You can then inspect those issues in your issue management system and determine why they are hopping so much.
Add the report
To configure the Issue Bounce report, follow these steps:
Step 1: Add the widget
- Go to the Insight where you want to add the widget, Select Settings, and then Add Widget.
- Choose the Issue Hops Report widget.
Step 2: Configure the Filters for the widget
- Add additional conditions to specify what data feeds into the widget by creating inclusive and exclusive filters.
- If you include multiple filters, they are inherently combined with an
ANDoperator. - If you want to observe hops for tickets that have been open for a long time, set Issue Created In to a long time range, such as 90 or 180 days. This can provide insight into why the tickets have been open so long.
Step 3: Configure the Aggregations for the widget
This report is usually configured to observe the median number of hops by component, project, or initiative. To do this, set the X-Axis to Component, Project, or Initiative.
If you only want the report to track active tickets, include a Status filter, and set it to exclude inactive or closed statuses, such as Done and Won't Do.
Step 4: Configure the Settings
- Select how you want to sort X-axis data, such as ascending or descending.
- Select the maximum number of values to show on the X-axis.
Step 5: Save the widget
Complete the widget settings and select Next: Place Widget, place the widget on Insight and then select Save Layout.
Issue hygiene reports
For information about issue hygiene reports, go to Hygiene reports.
Issue single stats
Single stats are versatile widgets that provide a single metric over a given time range. These are useful for tracking events (created, resolved, etc.) happening over a period of time. For example:
- Issues Single Stat: Show a single value such as total issues/tickets created, total issues/tickets due, total issues/tickets updated, and so on.
- Issue Resolution Time Single Stat: Show how many issues were resolved in a given time frame.
- Issue Response Time Single Stat: Show a single stat for issue response time.
- Issue Bounce Single Stat: Show a single stat related to issue bounce between assignees.
- Stage Bounce Single Stat: Show a single stat related to issue bounce between stages.
- Issue Hops Single Stat: Show a single stat related to issue hops.
When you configure a single stat widget:
- You can create filters for any field that can be viewed as a single value, such as issue type, priority, status, labels, components, and so on.
- The available fields depend on your integrations, and you can choose from custom fields, if they exist in your SCM, issue management, or support tool.
- If you use multiple filters to focus the widget (such as to show the total number of bugs in the won't do status for a specific project), the filters are inherently combined by
ANDoperators. - Keep in mind that single stat widgets intend to show a single value, such as the total number of tickets or the sum of story points. Determine what single stat you want to show, and then create your filters accordingly.
You might want to set the time range to Use Insight time, which allows the user to select a time range when viewing the Insight where this widget is present.
Other issues reports
- Issue Hotspots Report: Determine code hotspots most often result in issues being created in your issue management system. This can help you identify code areas that need better test coverage.
- Issue Progress Report: Analyze progress on effort investment categories.
- SCM issues: For information about reports that track SCM issues, go to SCM reports.