Lead time reports
Lead time measures elapsed time to deliver features, close issues, or complete workflows. For example, it can measure:
- The time elapsed from when a new feature is requested to when it is delivered to the customer.
- How long do support tickets, SCM issues, or issues in your issue management system remain open?
- The time between PR creation and merge.
The overall lead time is the sum of the average time spent in each stage configured in a workflow, such as the commit-to-deployment cycle in SCM or the issue lifecycle in an issue management system. This can help identify where the team is spending time and if the amount of time spent in each stage falls in an acceptable range.
Lead time can be calculated and displayed using two types of reports:
- Lead Time with Issues
- Lead Time with SCM PRs
Lead Time is calculated by combining Issue Management, SCM, and relevant CI/CD tools. To ensure the correct lead time is calculated, it is necessary to maintain proper hygiene and workflow profile configuration (DORA or Velocity Lead Time) across all development stages.
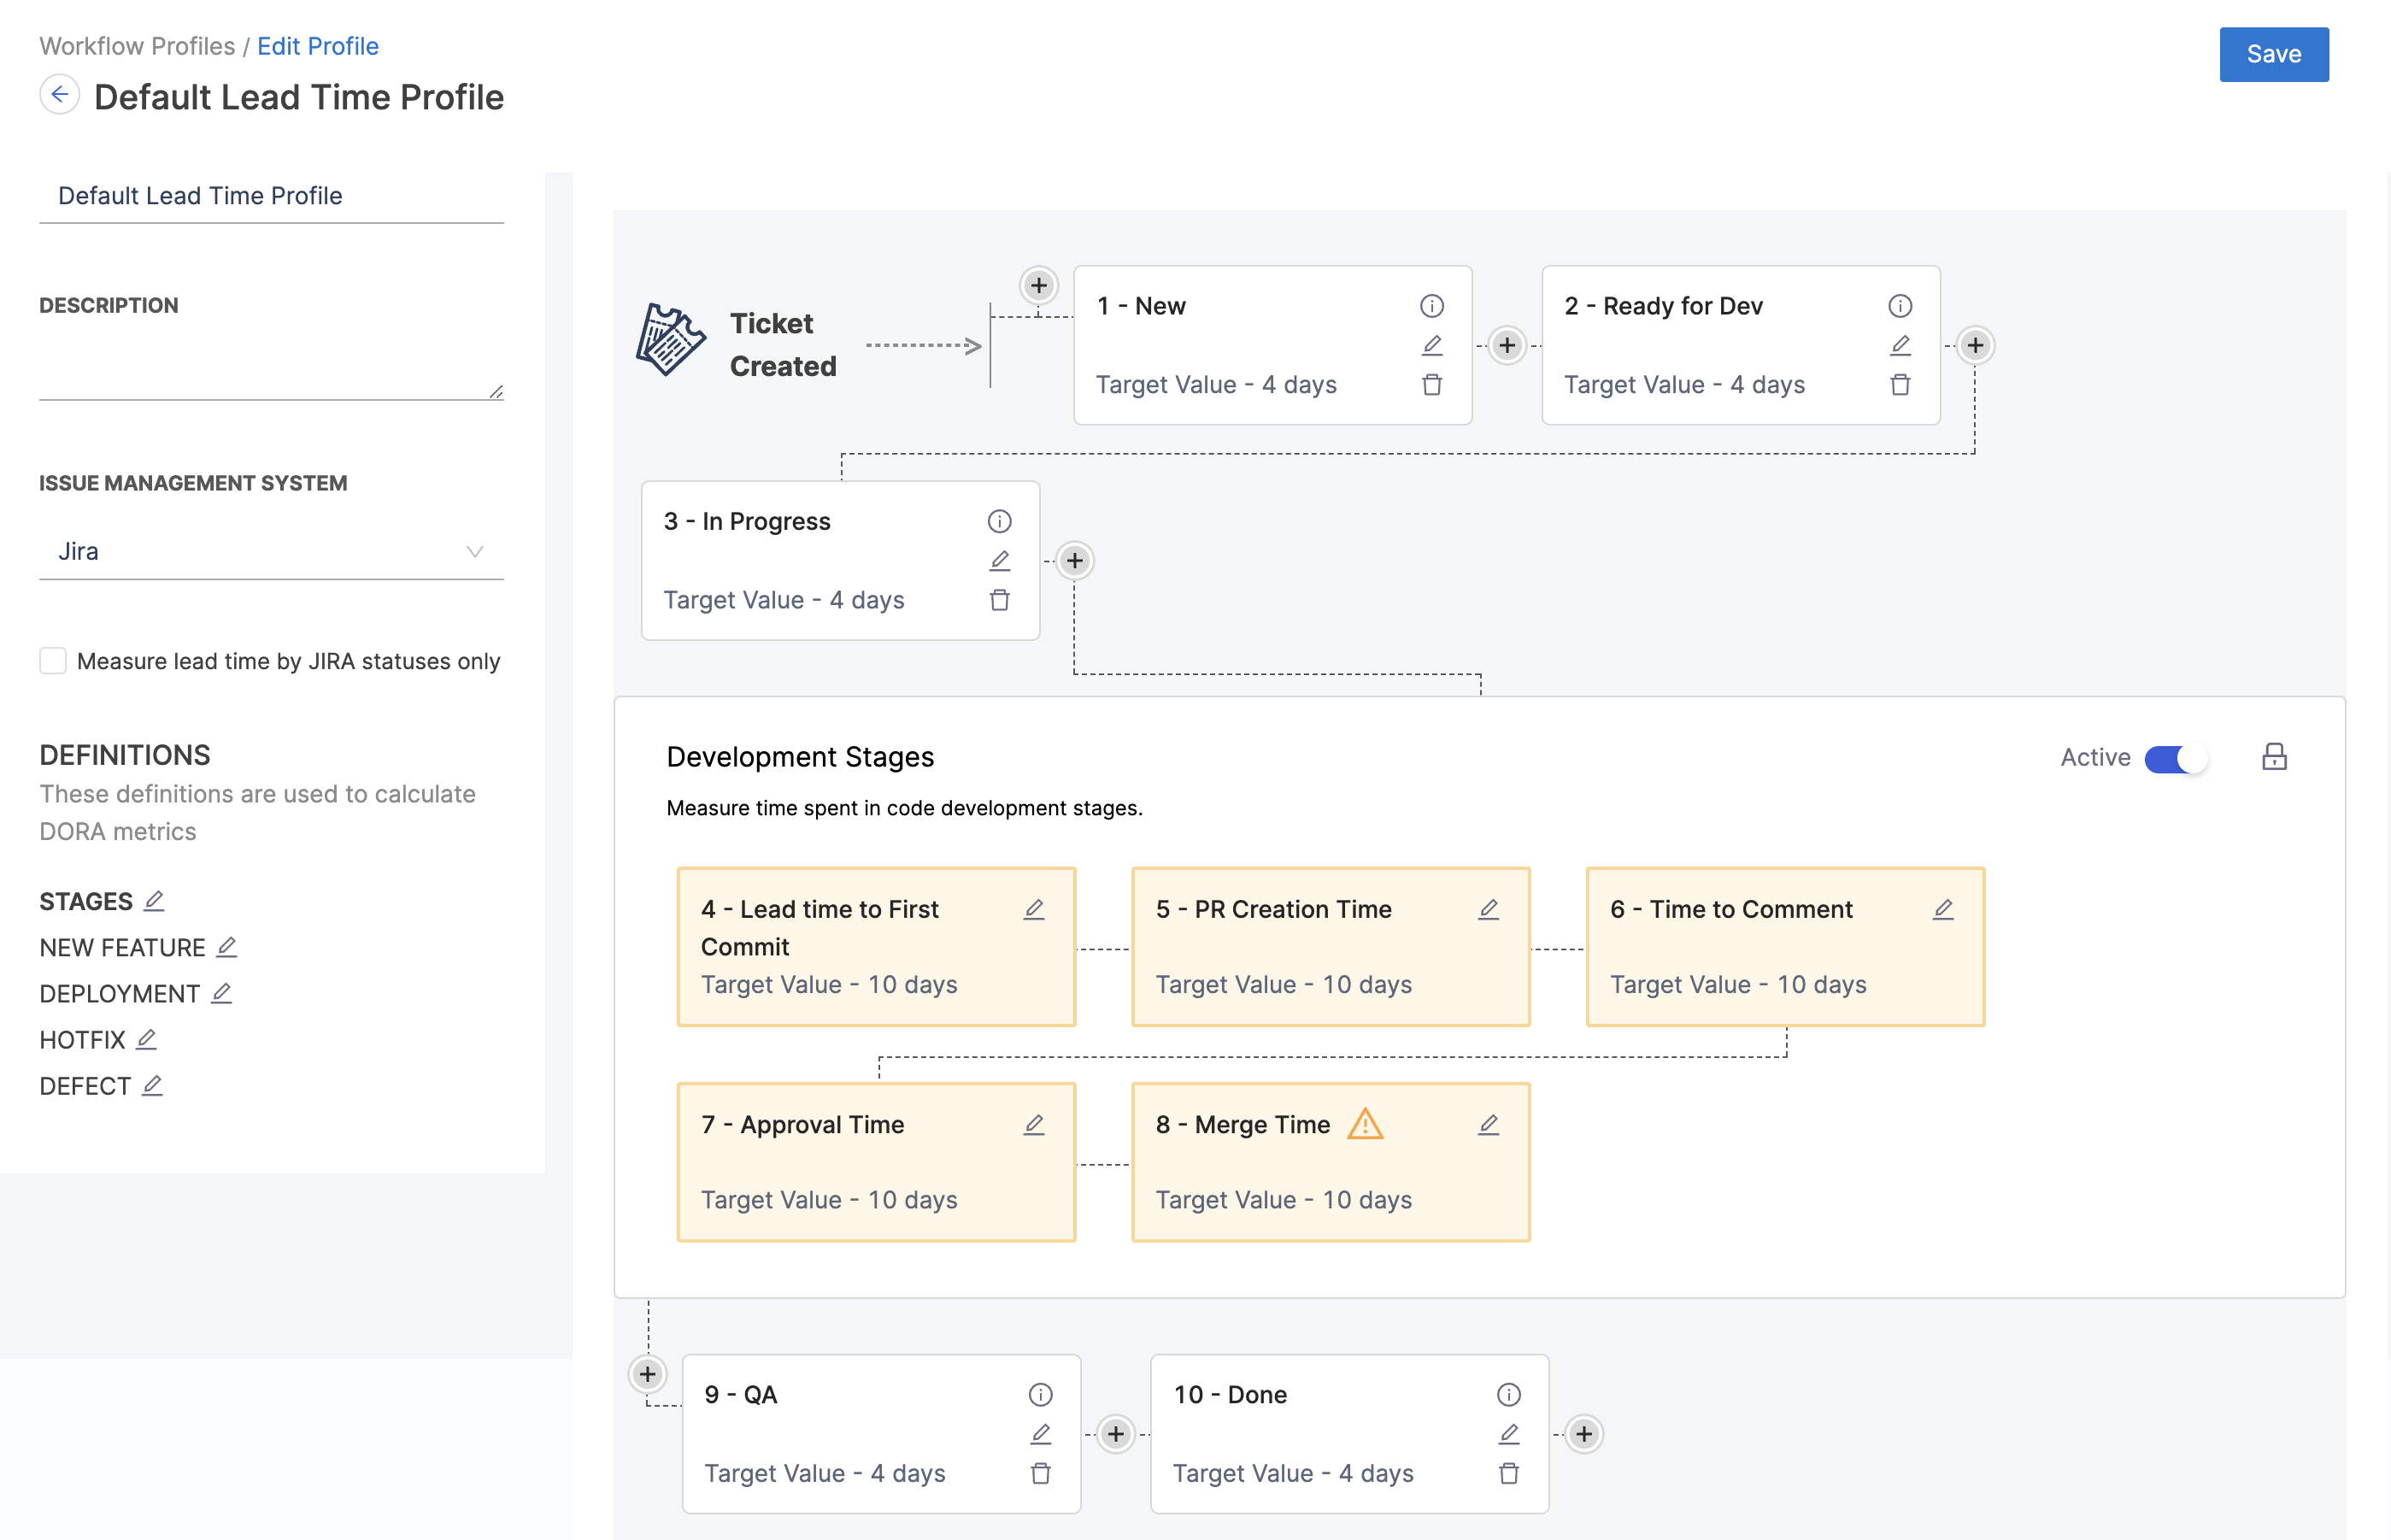
Workflow profiles for lead time
Lead time is based on time spent in stages defined in a Workflow profile.
For example, the default configuration for a [PR-based Workflow profile]/docs/software-engineering-insights/sei-profiles/workflow-profiles/velocity-profile#create-velocity-profiles) has four stages:
- PR creation time.
- Time to Comment.
- Approval time.
- Merge time.
Similarly, the default configuration for a Ticket-based Workflow profile has five stages:
- Lead time to First Commit.
- PR Creation time.
- Time to Comment.
- Approval time.
- Merge time.
When calculating lead time, the time spent in each stage depends on the stages that a PR or issue actually goes through. For example, if your Workflow profile includes a time to comment stage, but there are no comments on the PR or ticket, then the time to comment is zero.
You can configure grading thresholds (good, acceptable, and slow) for each stage. These thresholds determine grades that appear on your lead time widgets. Grades are reported for each stage as well as a cumulative grade for all stages combined.
You can modify Workflow profile stages and grades according to your team's SDLC process. If your Workflow profile includes stages across issue management, SCM, and CI/CD, make sure the same event is not tracked in multiple tools, such as Deploy to Production in Jira and a CI/CD Deploy stage.
For more information about modifying Workflow profiles and configuring stages for lead time calculation, go to Workflow profile.
Development Stages
Lead Time to First Commit
This metric refers to the amount of time that passes from the beginning of a development cycle (like the start of a sprint or when a feature is first planned) to the first commit in the SCM. Essentially, it measures how long it takes to start actual coding work after a task is defined.
PR Creation Time
This is the duration between the first commit in a repository and the creation of the first pull request that includes this commit. It reflects how promptly changes are proposed for review after initial development.
Time to Comment
This metric measures the duration from the moment a pull request is created to the time the first comment is made on it. It's an indicator of the engagement and response time of the team or reviewers.
Approval Time
This measures the time taken from the creation of a pull request to its first approval. It's a gauge of how quickly a PR is reviewed and approved by the team.
Merge Time
This is the time taken to merge the first pull request after it has been created. It indicates the speed at which changes are integrated into the main branch.
Lead time calculation
Overall lead time is the sum of the time spent in each stage in a workflow, such as commit-to-deployment time for a change, open-to-merge time for PRs, or the issue workflow for issues in your issue management system. Lead time can help identify where a team is spending time and if the amount of time spent in each stage falls in an acceptable range.
The specific events or stages considered in a lead time calculation depend on the report and the stages defined in the associated Workflow profile. The lead time ultimately depends on the stages that a PR or issue actually goes through. For example, if there are no comments on the pull request, then the time to comment is zero.
Average
When configured to calculate the Lead Time as the Average time in stage, the individual lead time for each stage is calculated as the average across all the tickets or commits or both depending on the profile configuration, The overall lead time is then calculated as the sum of all the stages.
Median
The median lead time is the duration by which half of the tasks or tickets are completed. It gives you idea about the typical completion time by showing the point where half of the tickets are resolved faster and the other half take longer.
90th Percentile
The 90th percentile lead time is the duration within which 90% of tasks or tickets are completed, representing an upper bound for typical completion times while excluding the most extreme delays.
95th Percentile
The 95th percentile lead time is the duration within which 95% of tasks or tickets are completed, representing an upper bound for typical completion times while excluding the most extreme delays. The calculation of the 95th percentile lead time follows the same steps as the 90th percentile, with the only difference being the percentile value used.
If you want to learn more about the calculations behind these metrics, you can check out the DORA Lead Time calculations.
Examples
The following examples demonstrate how PR lead time would be calculated in different scenarios. These examples are based on the default configuration for a PR-based Workflow profile, which has four stages: PR Creation Time, Time to Comment, Approval Time, and Merge Time.
When reviewing these examples, consider the following:
- Time to Comment helps you understand the lead time between PR creation time and the associated review.
- There are two ways to track the time taken for a PR approval:
- Default Approval Time configuration: The overall approval time, starting from PR creation.
- Approval Time minus Time to Comment: Time spent in the review cycle when an active reviewer is involved.
PR Lead Time calculation example #1
For this example, assume the following series of events occurs:
- Contributor makes a commit (
Commit created event). - Contributor creates a pull request (
Pull Request created event). - Reviewer adds a comment (
Review1 event). - The Pull Request is approved by an approver (
Pull Request approval event). - The Pull Request is merged to the repository (
Pull Request Merged event).
As a result, the following calculations are made:
PR creation time = Pull Request created event - Commit created event
Time to Comment = Review1 event - Pull Request created event
Approval Time = Pull Request approval event - Pull Request created event
Merge Time = Pull Request Merged event - Pull Request approval event
PR Lead Time calculation example #2
For this example, assume the following series of events occurs:
- Contributor makes a commit (
Commit created event). - Contributor creates a pull request (
Pull Request created event). - Reviewer adds a comment (
Review1 event). - Reviewer adds a comment (
Review2 event). - Reviewer adds a comment (
Review3 event). - The Pull Request is approved by an approver (
Pull Request approval event). - The Pull Request is merged to the repository (
Pull Request Merged event).
Considering the Approval Time settings defined as Time from the PR Creation to the Last Approval.
As a result, the following calculations are made:
PR creation time = Pull Request created event - Commit created event
Time to Comment = Review1 event - Pull Request created event
Approval Time = Review3 event - Pull Request created event
Merge Time = Pull Request Merged event - Pull Request approval event
How data is correlated between the Tickets, Commits and Pull Requests?
To ensure the accuracy of SEI calculations, it is necessary to maintain code hygiene throughout the development lifecycle.
- Tickets and Pull Requests: In order to correlate data between the ticketing system and pull request (PR) information in SEI, the PR title must include the ticket key from the ticketing system. By doing so, SEI can associate the relevant data from both systems and provide a comprehensive view of each issue's progression.
- Commits and Default Branch: SEI captures all commits made to the default branch, typically named
mainormaster. These commits serve as the basis for calculating various metrics within SEI. - Commits and Pull Requests: SEI collects commit data related to pull requests (PRs), irrespective of the target branch. This information is vital for measuring lead time metrics during the PR process.
To learn more about how SCM Commits are ingested on Harness SEI, go to Technical Reference: SCM Commits
It's important to note that certain usecases like the Lead Time calculations, offer valuable insights only after the work has been completed and merged. Consequently, when assessing these metrics in SEI, make sure to configure the Workflow Profile based on the final code changes rather than individual contributions before merging.
Lead Time reports
Harness SEI provides two different reports i.e. Issue Lead Time by Stage report and SCM PR Lead Time by Stage report for measuring lead time across Issue Management System and Source Code Manager. By default, the report will display data for all contributors as defined under the given collection to which Insight is associated.
To consider the Issue Lead Time by Stages report, the start event should be Ticket Created.
Similarly, for the SCM PR Lead Time by Stages report, the start event should be Commit Created. However in this case you cannot add custom stages before the development stages, as the calculation starts with a Commit Created event.
The only difference between the Issue Lead Time by Stage report and the SCM PR Lead Time by Stage report is in the drill-down view. The former displays the number of issues and timelines, while the latter displays data associated SCM pull requests.
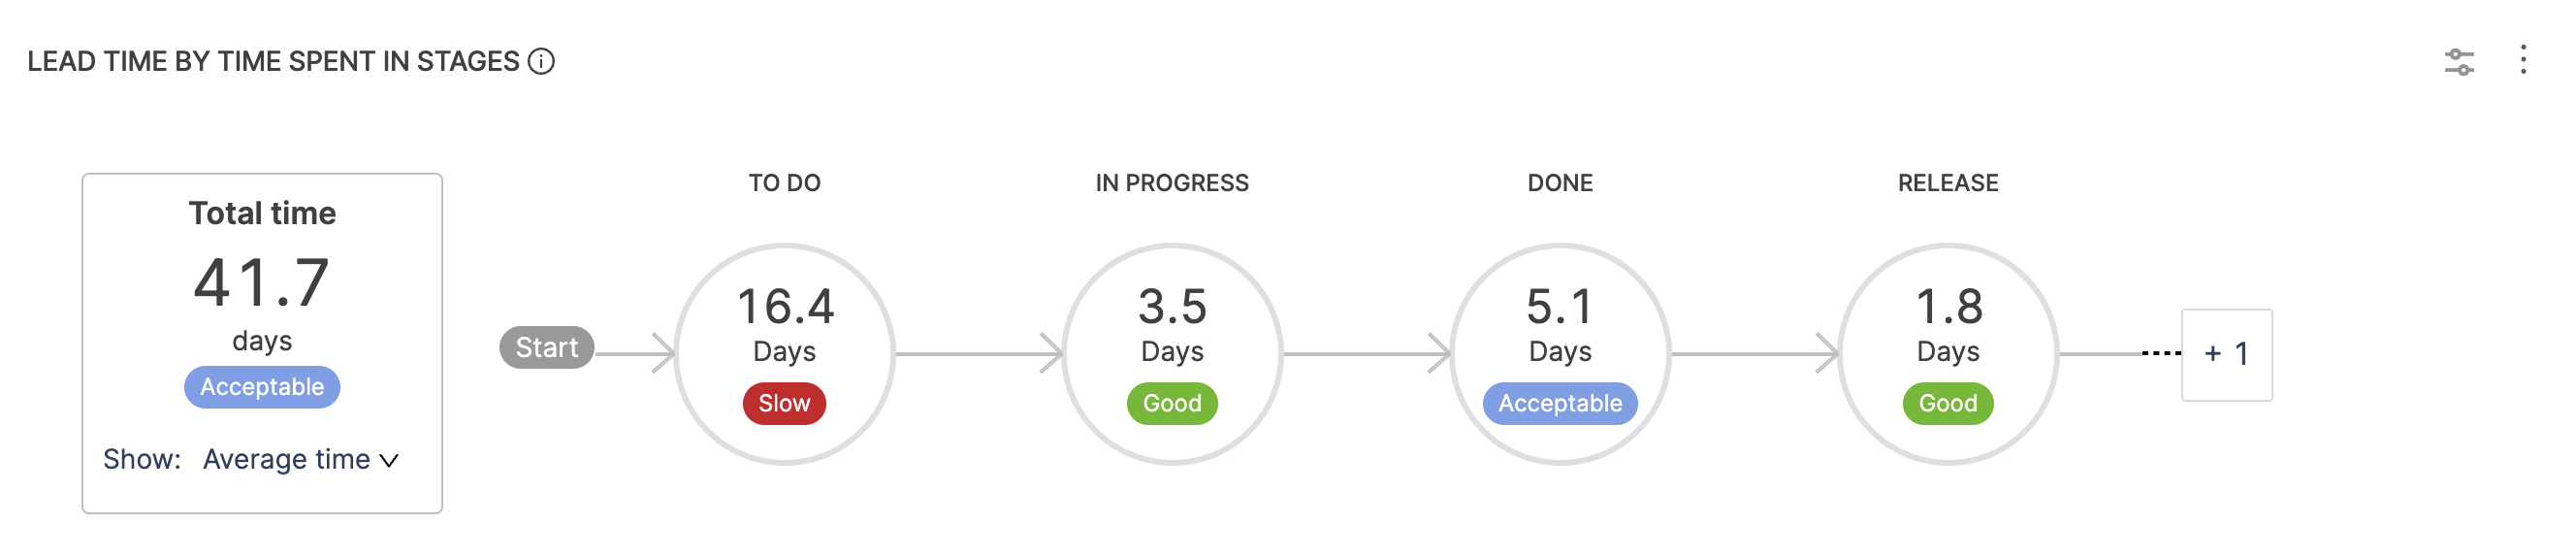
Lead Time by Time Spent in Stages Report
Definition
Use the Lead Time by Time Spent in Stages Report to calculate lead time for issues moving through your issue management system, such as Jira. By default, this report shows the average total lead time for all issues. You can drill down to explore data for individual issues. You can also configure this report to show the median, 90th percentile, or 95th percentile, instead of the average time.
Lead time is based on the stages configured in the Workflow profile. Elapsed time for a stage is based on when an issue enters a given stage and when it leaves that stage. Overall lead time for all issues is based on all issues that have passed through the defined stages.
Add the report
Step 1: Configure the Workflow profile settings
When configuring the Workflow profile for this report, make sure you only track issues in Issue Management. To do this:
- Make sure the Start Event is
Ticket Created. - Disable the Development (SCM) Stages.
- Make sure the workflow only includes Stages related to the Issue Management Platform.
Step 2: Add the widget
To add the widget on the Insight follow the following steps:
- Go to the Insight where you want to add the widget. Make sure you are in the correct project.
- Select Settings, and then select Add Widget.
- Select the Lead Time by Time Spent in Stages report widget.
The following settings are available to configure this report:
Step 3: Configure the Filters for the widget
This report requires that you set the Issues Resolved In or Released Date filter because only issues that have completed the entire issue management workflow should be considered in the lead time calculation.
- When the Released Date filter is applied, it is universally applied for the entire report. Tickets that fall outside the specified release date range are not included in the Total number of tickets.
- When the Issue Resolved In filter is applied only issues that have completed the entire issue management workflow are considered in the calculation.
Step 4: Select the Metrics to measure on the widget
Select the metric you want to display in the stages of the widget. For example: Average Time in the Stage measures the average time spent in each stage.
Step 5: Configure the Settings
Select the relevant Workflow Profile that you want to use for the Lead Time calculation on this widget.
Step 6: Save the widget
Complete the widget settings and select Next: Place Widget, place the widget on Insight and then select Save Layout.
Calculation
This report by default shows the Average of the Total Lead Time for all issues from your Issue Management Platform. You can also configure this report to show the Median, 90th percentile, or 95th percentile, instead of the Average Time.
Lead time is calculated based on the Stages configured in the Workflow profile.
The time displayed on a stage is based on when an issue enters a given stage and when it leaves that stage. Overall lead time for all issues is based on all issues that have passed through the defined stages. To learn more, go to Lead Time Calculations.
-
For the most accurate lead time measurements, keep track of your Issue Hygiene i.e. updating issue statuses, and ensure that your workflow has a sufficient variety of statuses to capture the entire development process. This report tracks the complete issue lifecycle, including bounces back into previous stages.
-
Use this report with the Jira Releases report, which helps analyze your team's release pattern and understand the average time elapsed between issue creation and release.
-
To reduce the loading time for this report, you can request to enable pre-calculation. This feature pre-computes and stores the report data for specific time intervals, allowing users to quickly access the report without waiting for a live calculation.
-
To enable pre-calculation for a report, please request the Support Team to enable the pre-calculation flag for a particular report (using the
report ID). After some time, the report will have the<PRE-CALCULATED>label applied to the report header.
Pre-calculation is available for the following time ranges: Last Two Weeks, Last Month, Last Three Months, Last 30 Days, Last Quarter, and Last Two Quarters.
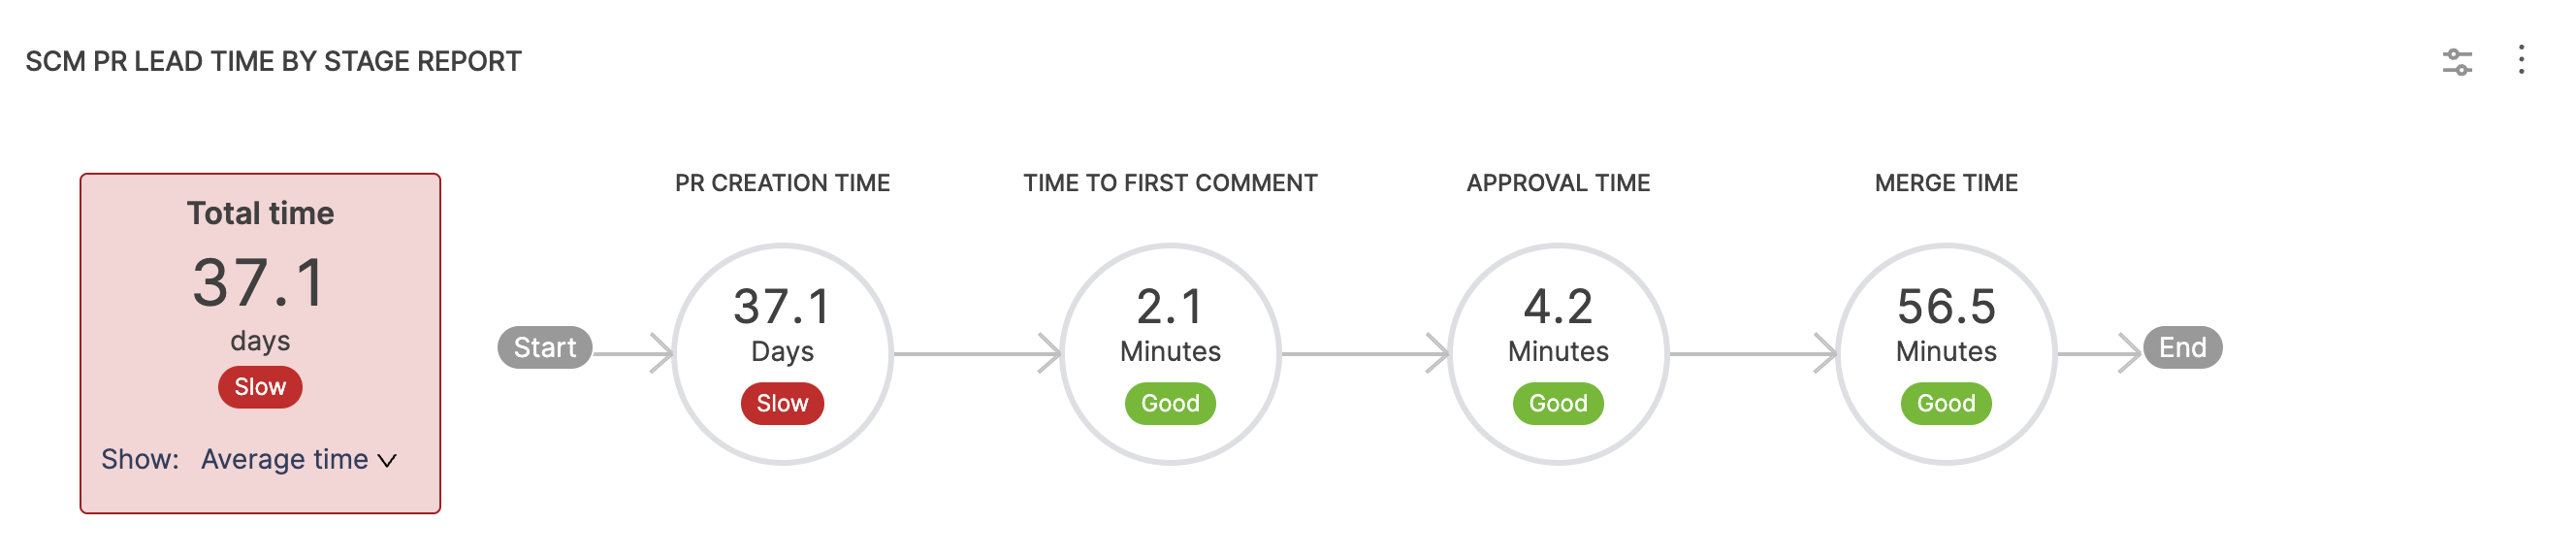
SCM PR Lead Time by Stage Report
Definition
Use the SCM PR Lead Time by Stage Report to examine PR velocity based on time spent in various PR lifecycle stages. By default, this report shows the average time for all PRs. You can drill down to explore data for individual PRs. You can also configure this report to show the median, 90th percentile, or 95th percentile, instead of the average time.
Add the report
Step 1: Add the widget
- Go to the Insight where you want to add the widget. Make sure you are in the correct project.
- Select Settings, and then select Add Widget.
- Select the SCM PR Lead Time by Stage Report widget.
The following settings are available to configure this report:
Step 2: Configure the Filters on the widget
- Add conditions to specify what data feeds into the widget by creating inclusive and exclusive filters.
- If you include multiple filters, they are inherently combined with an
ANDoperator.
Step 3: Select the Metrics to measure on the widget
Select the metric that you want to display on the widget stages. You can select either of the following metrics:
- 90th percentile time in stage: Displays the 90th percentile of the time taken by pull requests in the specific stage
- 95th percentile time in stage: Displays the 95th percentile of the time taken by pull requests in the specific stage
- Average time in stage: Displays the average time taken by pull requests in the specific stage
- Median time in stage: Displays the median time taken by pull requests in the specific stage
Step 4: Configure the Settings
- Select the Workflow Profile that you want to use for this widget. Available options are based on the configured Workflow Profiles in the SEI account.
- Select how you want to apply the filters in the widget. You can either choose to Apply Filters Only For The Initial Node or Apply Filters To All Nodes.
Step 5: Save the widget
Complete the widget settings and select Next: Place Widget, place the widget on Insight and then select Save Layout.
Calculation
This widget calculated the Lead Time only for the SCM stages i.e. the velocity time spent on different stages across the lifecycle of a Pull Request.
In this example, we consider a use case for a single Pull Request (PR). The Lead Time calculation includes several stages as shown above.
The table provides details on the different stages, their descriptions, formulas, and an example calculation.
| Stage | Description | Formula | Example |
|---|---|---|---|
| PR Creation Time | The time taken to create the first pull request (PR) after the first commit. | First PR Creation Time - First Commit Time | 10:10 AM - 10:05 AM = 5 minutes |
| Time to First Comment | The time taken to add the first comment after the PR is created. | First PR Comment Time - First PR Creation Time | 10:11 AM - 10:10 AM = 1 minute |
| Approval Time | The time taken for the first approval after the first pull request is created. | First PR Approval Time - First PR Comment Time | 10:15 AM - 10:11 AM = 4 minutes |
| Merge Time | The time taken to merge the pull request after it is approved. | Last PR Merge Time - First PR Approval Time | 10:19 AM - 10:15 AM = 4 minutes |
Total Lead Time is the sum of all the above stages:
Total Lead Time = 5 min + 1 min + 4 min + 4 min = 14 min
Therefore, the Total Lead Time in this case is 14 minutes.
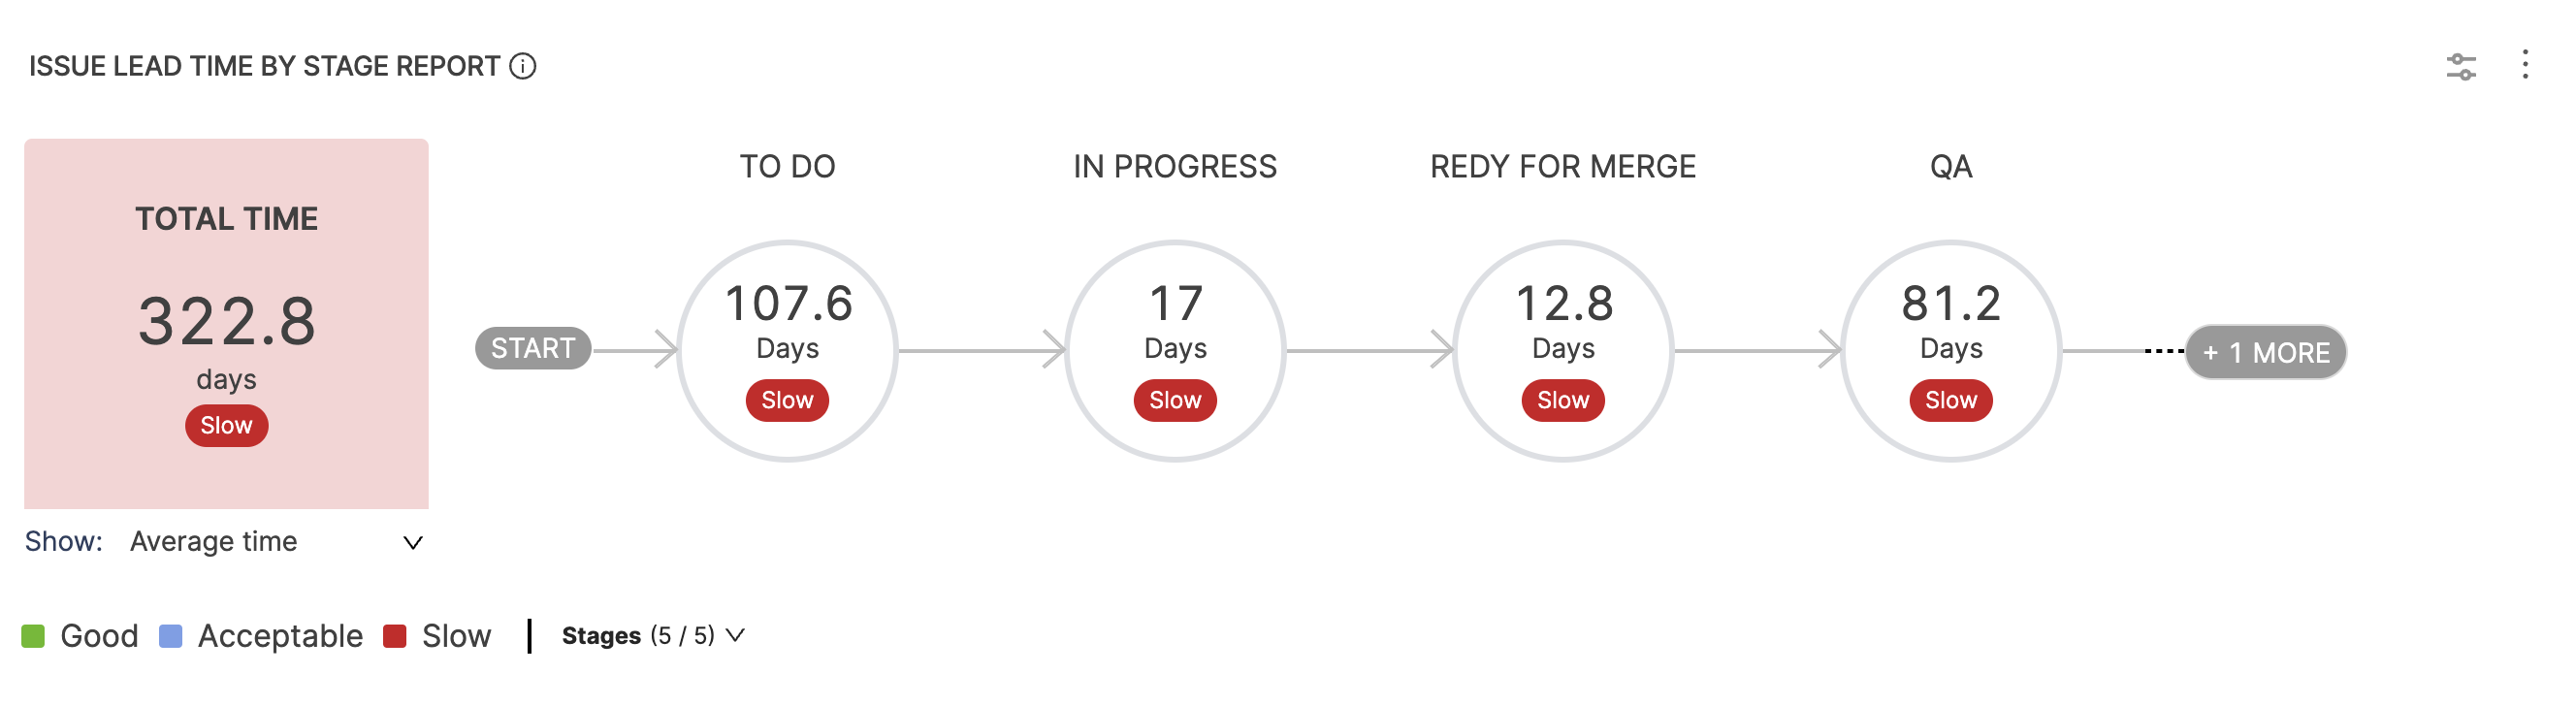
Issue Lead Time by Stage Report
Definition
The Issue Lead Time by Stage Report tracks lead time by development stages. You can limit it to issue management or track your entire SDLC (including issue management, SCM, and CI/CD). By default, this report shows the average total lead time for all issues. You can drill down to explore data for individual issues. You can also configure this report to show the median, 90th percentile, or 95th percentile, instead of the average time.
This report is useful for measuring the velocity of tasks from the time they are created in issue management to the time they are deployed through CI/CD.
Add the report
Lead time is based on the stages configured in the Workflow profile. Elapsed time for a stage is based on the first time an issue enters a given stage and the first time it leaves that stage. Overall lead time for all issues is based on all tickets that have passed through the defined stages.
Step 1: Configure the Workflow profile settings
When configuring the Workflow profile for this report, make sure:
- The Start Event is
Ticket Created. This ensures that lead time tracking starts in the Issue Management Platform. - Configure stages for Issue Management and other tools you want to track, such as SCM and CI/CD.
- Stages flow sequentially from one tool to the next, such as
Development In Progressin Jira followed by your SCM Development Stages (First Commit and PR Creation to Merge time). - Stages do not overlap. Meaning, that the same event is not tracked in multiple tools, such as
Deploy to Productionin Jira and a CI/CD Deploy stage.
Step 2: Add the widget
- Go to the Insight where you want to add the widget, Select Settings, and then Add Widget.
- Choose the Issue Lead Time by Stage report widget.
The following settings are available to configure this report:
Step 3: Configure the Filters on the widget
This report requires that you set the Issues Resolved In filter because only issues that have completed the entire issue management workflow are considered in the lead time calculation.
You can add additional filters to the widget to define what type of issues or PRs should be considered in the lead time calculation. Filters are associated with the report, and they persist even if you change collections associated with Insights. When configuring widgets or modifying Insight associations. widgets may break or gain/lose data when associations change.
Step 4: Add Filters at the Collection scope if needed
You can also add filters at the collection level. Collection-level filters take precedence over widget-level filters when defined for the same attribute. For non-conflicting filters, both filters are considered.
If you have multiple filters, they are inherently combined with AND operators.
Step 5: Save the widget
Complete the widget settings and select Next: Place Widget, place the widget on Insight and then select Save Layout.
Issue Lead Time by Type Report
Definition
Similar to the Issue Lead Time by Stage Report, the Issue Lead Time by Type Report presents lead time measurements broken down by issue type (bug, story, task, and so on).
Lead Time Single Stat
Definition
Lead Time Single Stat presents a single stat related to lead time over a given time range.
When you configure a single stat widget:
- You can create filters for any field that can be viewed as a single value, such as issue type, priority, status, labels, components, and so on.
- The available fields depend on your integrations, and you can choose from custom fields, if they exist in your SCM, issue management, or support tool.
- If you use multiple filters to focus the widget (such as to show the total number of bugs in the won't do status for a specific project), the filters are inherently combined by
ANDoperators. - Keep in mind that single stat widgets intend to show a single value, such as the total number of tickets or the sum of story points. Determine what single stat you want to show, and then create your filters accordingly.
You might want to set the time range to Use Insight time, which allows the user to select a time range when viewing the Insight where this widget is present.
Other Lead Time reports
DORA Lead Time For Changes
DORA calculation is similar to how lead time, in general, is calculated, with the difference being the ability to associate a collection while defining the profile, i.e., at the Profile level.
DORA Lead Time for Change and DORA Mean Time for Restore reports do not require a DORA profile to be associated in the widget configuration, as it is already expected to be associated with a collection under which Insight is defined.
DORA profiles can be configured to calculate the Lead time concerning either Issue (start event: Ticket Created) or SCM Pull Requests (start event: Commit Created).
For information about the DORA Lead Time For Changes report, go to DORA Reports.
PR and SCM lead time
For information about reports that track PR lead time, SCM issue lead time, and lead time between SCM commits and CI/CD jobs, go to SCM reports. Such reports include:
Support lead time
For information about support lead time reports, such as the Support Response Time Report and the Support Response Time Trend Report, go to Support reports.