> For the complete documentation index, see [llms.txt](https://developer.harness.io/llms.txt). Markdown versions of documentation pages are available by appending `.md` to page URLs; this page is available as [Markdown](https://developer.harness.io/harness-platform/use-harness-platform/git-experience/monitor-git-experience/monitor-git-provider-rate-limits.md).
# Monitor Git provider rate limits
Use the Observability tab to monitor Git provider API rate-limit consumption across your Git connectors, and identify connectors approaching their API limits.
The **Rate limit consumption** section of the **Observability** tab provides visibility into Git provider API rate-limit usage across your Git connectors. Use this view to monitor API consumption, identify connectors approaching their rate limits, and take corrective action before rate-limit exhaustion affects Git operations.
Git providers enforce API rate limits on requests made within a given time window. This view helps you track API usage by connector so you can avoid disruptions to Git operations caused by rate-limit exhaustion.
{% hint style="info" %}
If your Git connector authenticates through a Harness Delegate, the delegate must be running version **896xx** or later to use the rate limit consumption feature.
{% endhint %}
***
### What you will learn in this topic
This topic explains how to monitor Git provider API rate limits. It covers:
* How to [view rate-limit consumption by connector](#view-rate-limit-consumption).
* How to [interpret rate-limit metrics](#view-rate-limit-consumption).
* How to [view historical API usage](#view-historical-api-usage).
* How to [filter and customize the rate-limit view](#view-rate-limit-consumption).
***
### View rate-limit consumption
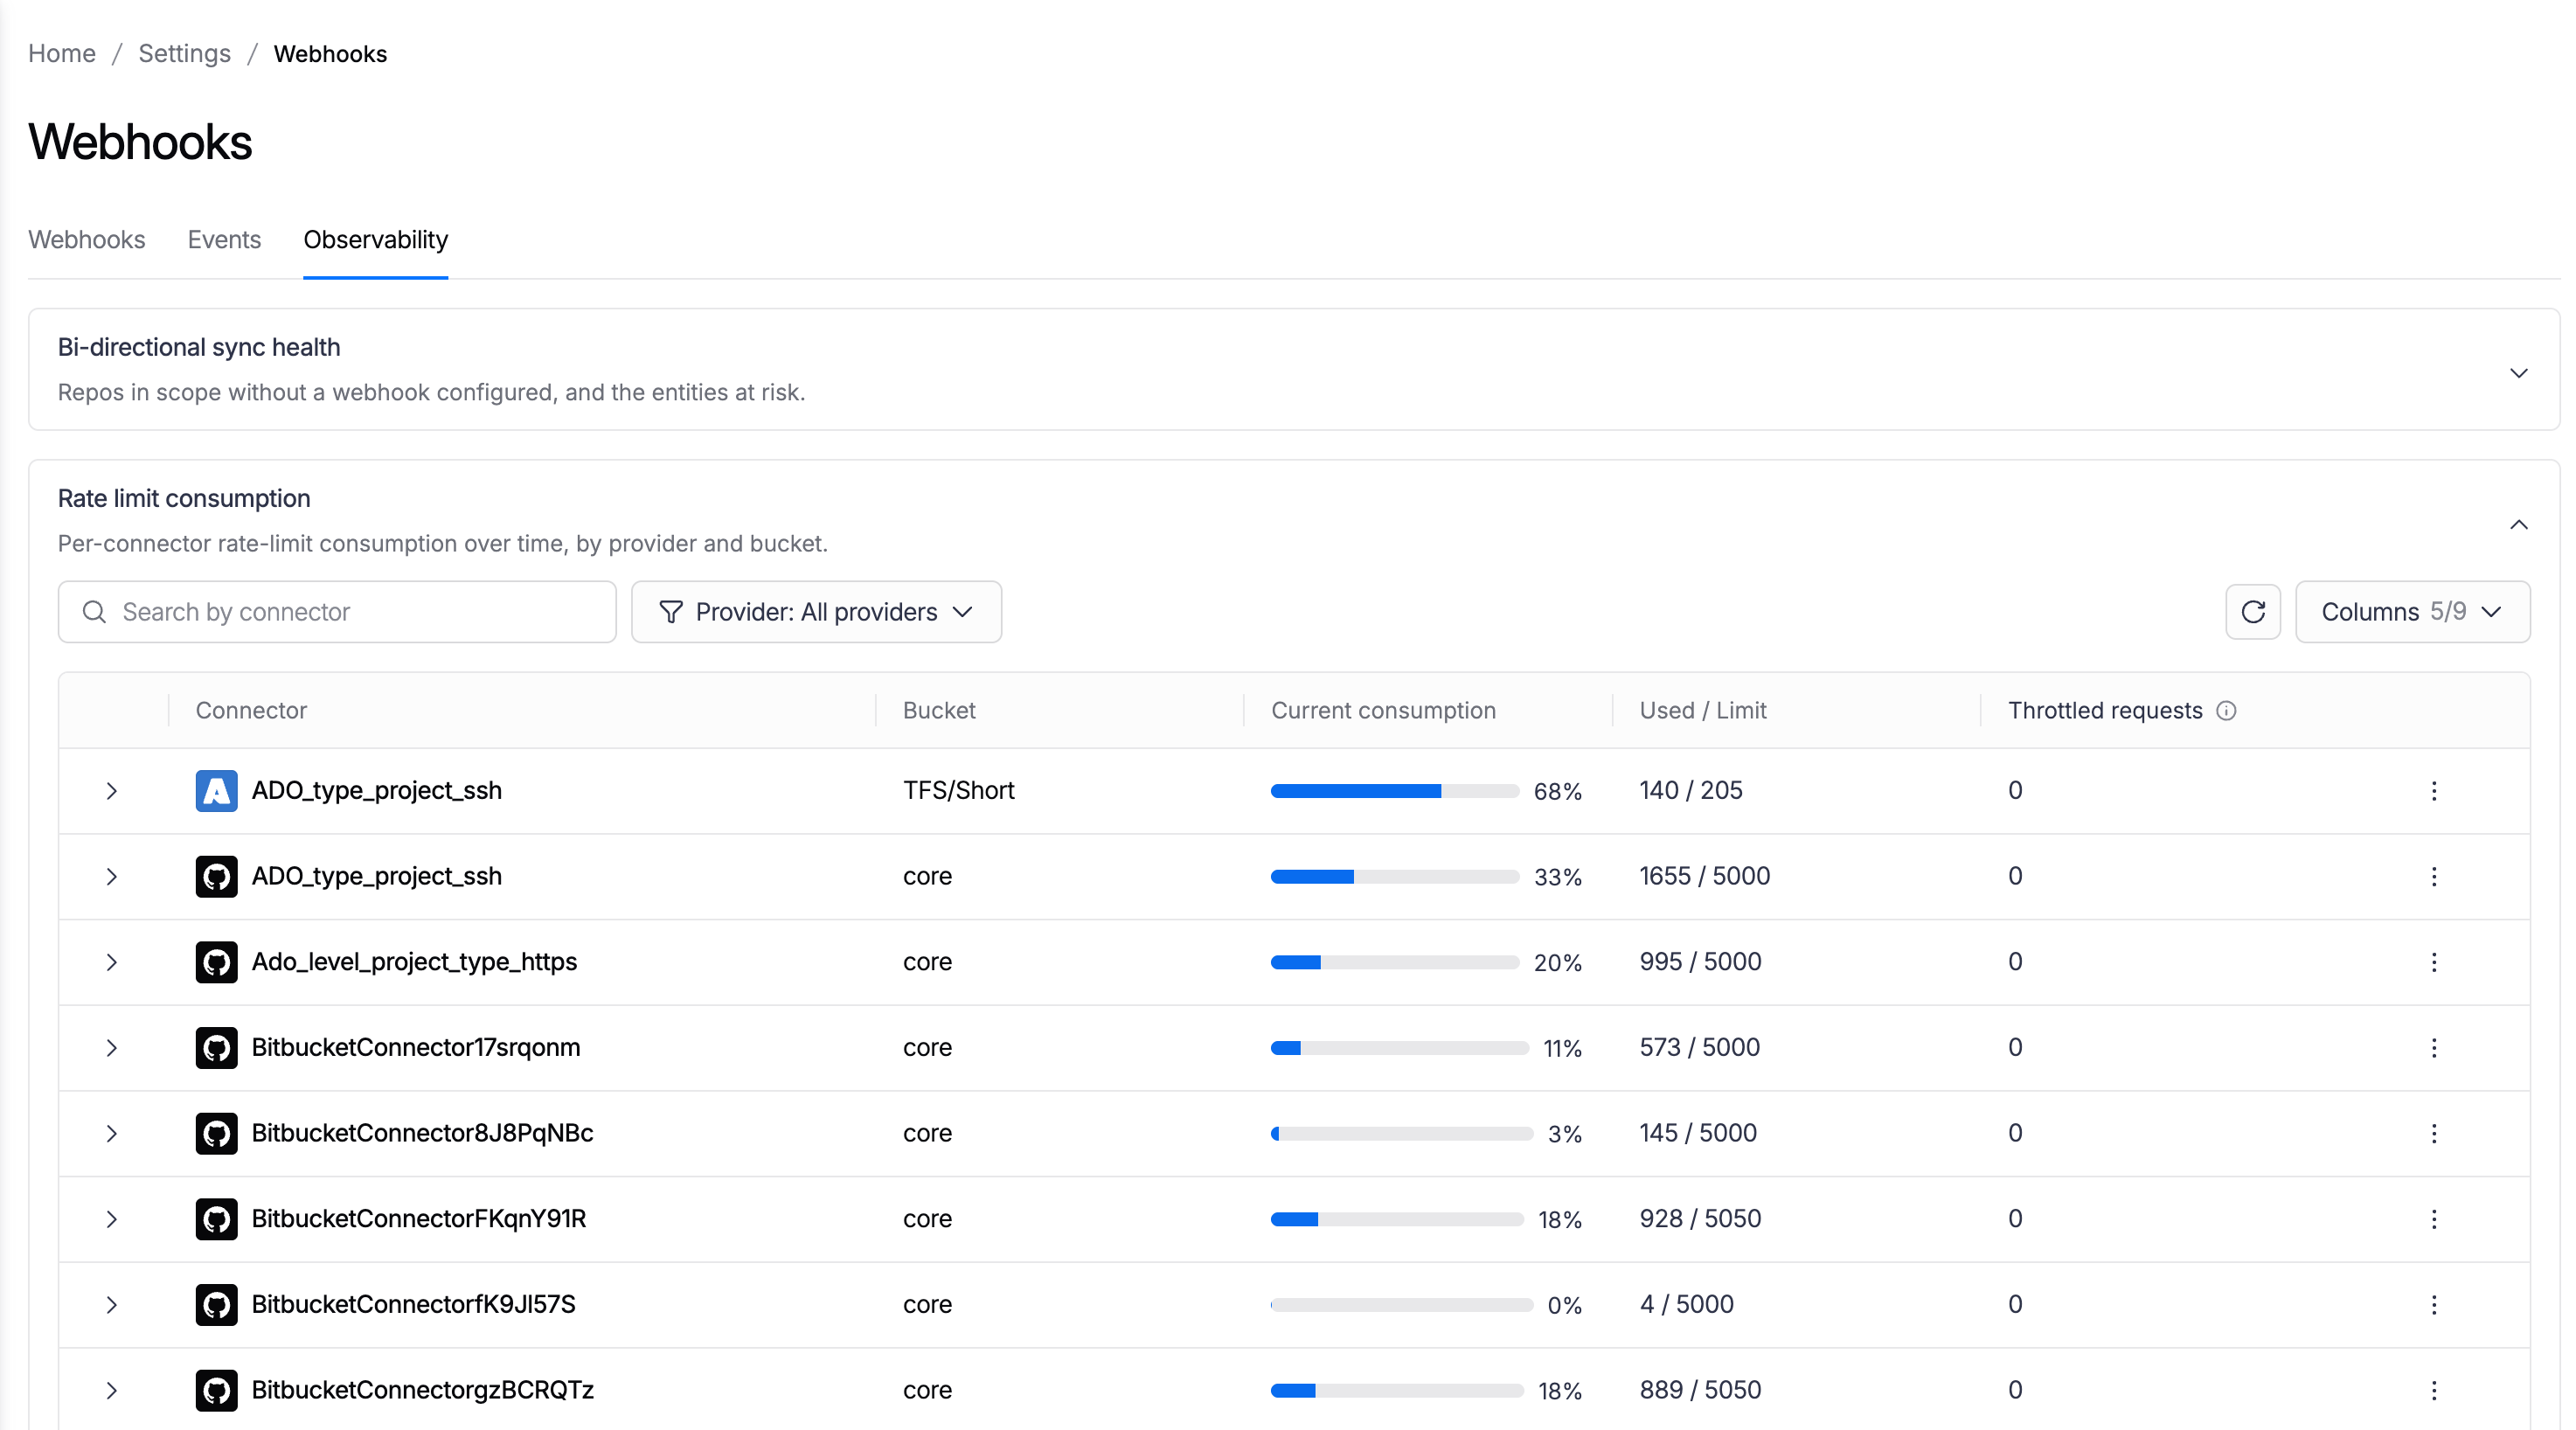
To access this view, go to the **Webhooks** page, select the **Observability** tab, and expand the **Rate limit consumption** section.
{% hint style="info" %}
The rate-limit metrics displayed in this view include **only Git provider API calls made by Harness** using the configured Git connector credentials. API requests made **outside of Harness** (for example, by users, scripts, CI/CD systems, or other applications using the same credentials) are **not tracked** and are **not reflected** in the reported consumption.
Rate-limit data is retained for the **last one day** only. If no Git API requests have been made by Harness using a connector during this period, the stored data is reset, and rate-limit data is unavailable for that connector. In this case, the UI displays the default (`-`) or `null` values.
{% endhint %}
To scope and customize the view:
* Use the **Search by connector** field and the **Provider** filter to scope the list.
* The **Provider** filter supports All providers, GitHub, GitLab, Bitbucket, Bitbucket Server, and Azure Repos.
* Select the refresh icon to reload the metrics, and use the **Columns** selector to show or hide columns (select **Reset** to restore the defaults). The active filters are reflected in the page URL, so you can bookmark or share a specific view.
Each row shows a connector's consumption for a rate-limit bucket:
| Column | Description |
| ----------------------- | ----------------------------------------------------------------------------------------------------------------------------------------------------------------------------------------------------------------------------------------------------------------------------------------------------------------- |
| **Connector** | The connector consuming the Git provider API. |
| **Provider** | The Git provider for the connector. |
| **Bucket** | The rate-limit bucket, for example `core`. Harness shows a bucket for each rate-limit category the provider supports. For example, GitHub exposes buckets such as `core` and `search`, while providers like Bitbucket do not expose named buckets, so their consumption is shown under a single `default` bucket. |
| **Current consumption** | A progress bar and the percentage of the limit currently used. |
| **Used / Limit** | Requests used against the maximum allowed, for example `29 / 5000`. |
| **Remaining** | The number of requests still available in the current window. |
| **Resets in** | When the current rate-limit window resets. |
| **Throttled requests** | The number of requests blocked because the limit was reached. |
| **Last updated** | When Harness last refreshed the metrics for the connector. |
***
### View historical API usage
To see historical usage:
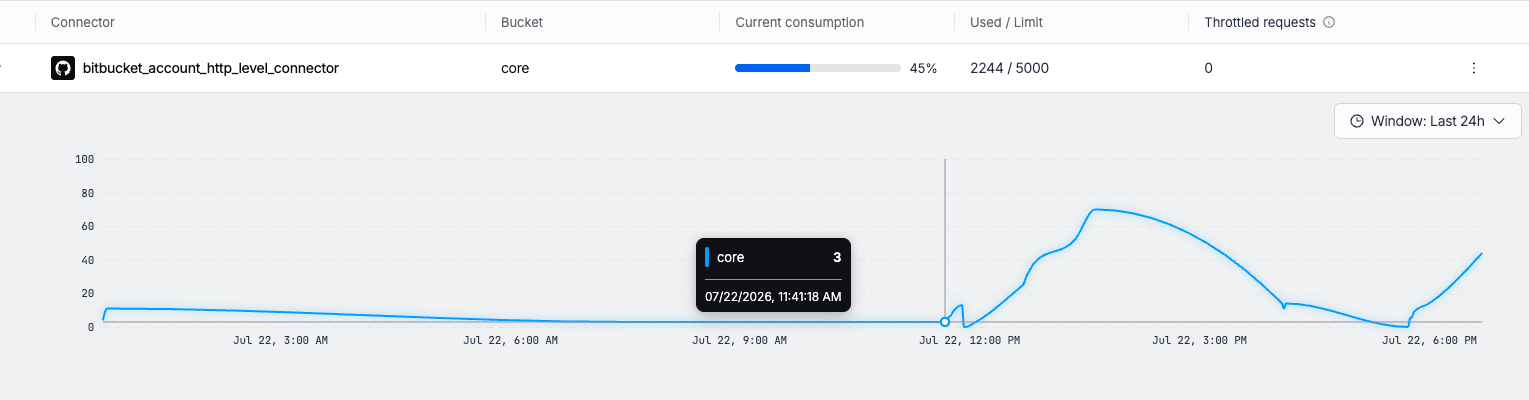
1. Expand a connector row or select **View details** from the **⋮** menu to display the consumption chart.
* To retrieve the latest metrics, select **Refresh** from the **⋮** menu in the expanded view.
2. Use the **Window** selector to change the time range:
* Last 1h
* Last 3h
* Last 6h
* Last 12h
* Last 24h
3. Hover over a data point to view the bucket, consumption value, and timestamp.
If Harness has no data for the selected connector and time window, the chart displays **No timeline data**.
{% hint style="info" %}
This view is behind the feature flag `PIPE_GITX_RATE_LIMITS_API`. Contact [Harness Support](mailto:support@harness.io) to enable the feature.
{% endhint %}
***
### Next steps
* [Monitor repository sync health](/harness-platform/use-harness-platform/git-experience/monitor-git-experience/monitor-repository-sync-health.md): Monitor webhook coverage and synchronization status.
* [Git rate limit best practices](/harness-platform/use-harness-platform/git-experience/git-ratelimit-bestpractice.md): Reduce Git provider API consumption and avoid rate-limit exhaustion.
{% @harness-feedback/feedback module="harness-ai" pagePath="harness-ai/use-harness-platform/git-experience/monitor-git-experience/monitor-git-provider-rate-limits" %}