For the complete documentation index, see llms.txt. This page is also available as Markdown.

Configure audit streaming

Stream your audit logs to an external destination.

Audit logs help you track and analyze your system and user events within your Harness account. You can stream these audit logs to external destinations and integrate them with Security Information and Event Management (SIEM) tools to:

  • Trigger alerts for specific events

  • Create custom views of audit data

  • Perform anomaly detection

  • Store audit data beyond Harness's 2-year retention limit

  • Maintain security compliance and regulatory requirements

Add a streaming destination

You can only add streaming destinations at the Account scope. Follow these steps to create a new streaming destination:

  1. In your Harness account, select Account Settings.

  2. Navigate to Security and Governance > Audit Trail > Audit Log Streaming.

  3. Select New Streaming Destination to open the configuration settings.

  4. Enter a name for the streaming destination.

  5. (Optional) Enter a description and tag(s) for the streaming destination.

  6. Select Continue to proceed.

Configure the streaming connector

Once a streaming destination is added, you're ready to configure the streaming connector. For object storage services(AWS S3 and GCP GCS), you can choose to stream audit events in either JSON and NDJSON formats.

To configure the Amazon S3 streaming connector:

  1. Select Amazon S3.

  2. In Select Connector, select an existing AWS Cloud Provider connector or create a new one.

    You must use the Connect through a Harness Delegate connectivity mode option when you set up your AWS Cloud Provider connector. Audit streaming does not support the Connect through Harness Platform connector option.

    Go to Add an AWS connector for steps to create a new AWS Cloud Provider connector.

  3. Select Apply Selected.

  4. Select the Format of the data — either JSON or NDJSON.

    NDJSON format is supported in Harness Delegate version 25.10.87100 or later.

  5. In Amazon S3 Bucket, enter the bucket name.

    Harness writes all the streaming records to this destination.

  6. Select Save and Continue.

  7. After the connection test is successful, select Finish.

    The streaming destination gets configured and appears in the list of destinations under Audit Log Streaming. By default the destination is inactive.

Amazon S3 audit file details

Here is an example of an audit stream file in one of the Amazon S3 buckets.

Currently, this feature is behind the feature flag PL_GCP_GCS_STREAMING_DESTINATION_ENABLED. Contact Harness Support to enable the feature.

To configure the GCP GCS streaming connector:

  1. Select GCP GCS.

  2. In Select Connector, select an existing GCP connector or create a new one.

    You can use either to Connect through a Harness Delegate or Connect through Harness Platform connectivity mode options when setting up your GCP connector. Audit streaming supports both options.

    Go to Add an GCP connector for steps to create a new GCP Provider connector.

  3. Select Apply Selected.

  4. Select the Format of the data — either JSON or NDJSON.

    NDJSON format is supported in Harness Delegate version 25.11.87200 or later.

  5. In Google Cloud Storage Bucket, enter the bucket name. Harness writes all the streaming records to this destination.

  6. Select Save and Continue.

  7. After the connection test is successful, select Finish.

    The streaming destination gets configured and appears in the list of destinations under Audit Log Streaming. By default the destination is inactive.

Currently, this feature is behind the feature flag PL_AUDIT_STREAMING_USING_SPLUNK_HEC_ENABLE and requires Harness Delegate version 82500 or later. Contact Harness Support to enable the feature.

Splunk audit log streaming is compatible with Splunk enterprise and SaaS.

To configure the Splunk streaming connector:

  1. Select Splunk.

  2. In Select Connector, select an existing Splunk connector or create a new one.

    IMPORTANT

    When you set up your Splunk connector, you must:

    • Select HEC Authentication

    • Set up and use your Splunk HEC token.

    • Use the Connect through a Harness Delegate connectivity mode option. Audit streaming does not support the Connect through Harness Platform connector option.

  3. Select Apply Selected, then select Save and Continue.

  4. Select the Format of the data — either JSON or NDJSON.

  5. After the connection test is successful, select Finish.

    The streaming destination gets configured and appears in the list of destinations under Audit Log Streaming. By default the destination is inactive.

TROUBLESHOOT HEC CONFIGURATIONS

At times, you might experience issues with the HEC connector. Here are some troubleshooting steps you can take to resolve common issues.

  • You should set HEC connectors without a declared SourceType. Although the data will be JSON-formatted, it is not declared as such. Setting a SourceType as JSON might filter data from the stream.

  • Harness utilizes the following standard endpoints and appends them automatically to the customer's URL. They are not customizable.

    • /services/collector/event

    • /services/collector/health

    • /services/server/info

Currently, this feature is behind the feature flag PL_ENABLE_SUMOLOGIC_AUDIT_STREAMING and requires Harness Delegate version 85500 or later. Contact Harness Support to enable the feature.

IMPORTANT NOTE

Starting with Harness Delegate version 25.10.87100, each audit event is streamed as a separate log line in Sumo Logic.

Example event streamed to Sumo Logic

```json { "event": "Harness-Audit-Event-68ffa287f277183fb388a560", "fields": { "auditResource.identifier": "string", "auditResourceScope.accountIdentifier": "string", "auditEventAuthor.principal.type": "string", "auditEventAuthor.principal.identifier": "string", "auditAction": "string", "auditEventMetadata.batchId": "string", "auditHttpRequestInfo.requestMethod": "string", "auditResource.type": "string", "auditModule": "string", "auditEventId": "string", "auditEventTime": "number", "auditEventAuthor.principal.email": "string", "auditHttpRequestInfo.clientIP": "string" } } ```

PREREQUISITES

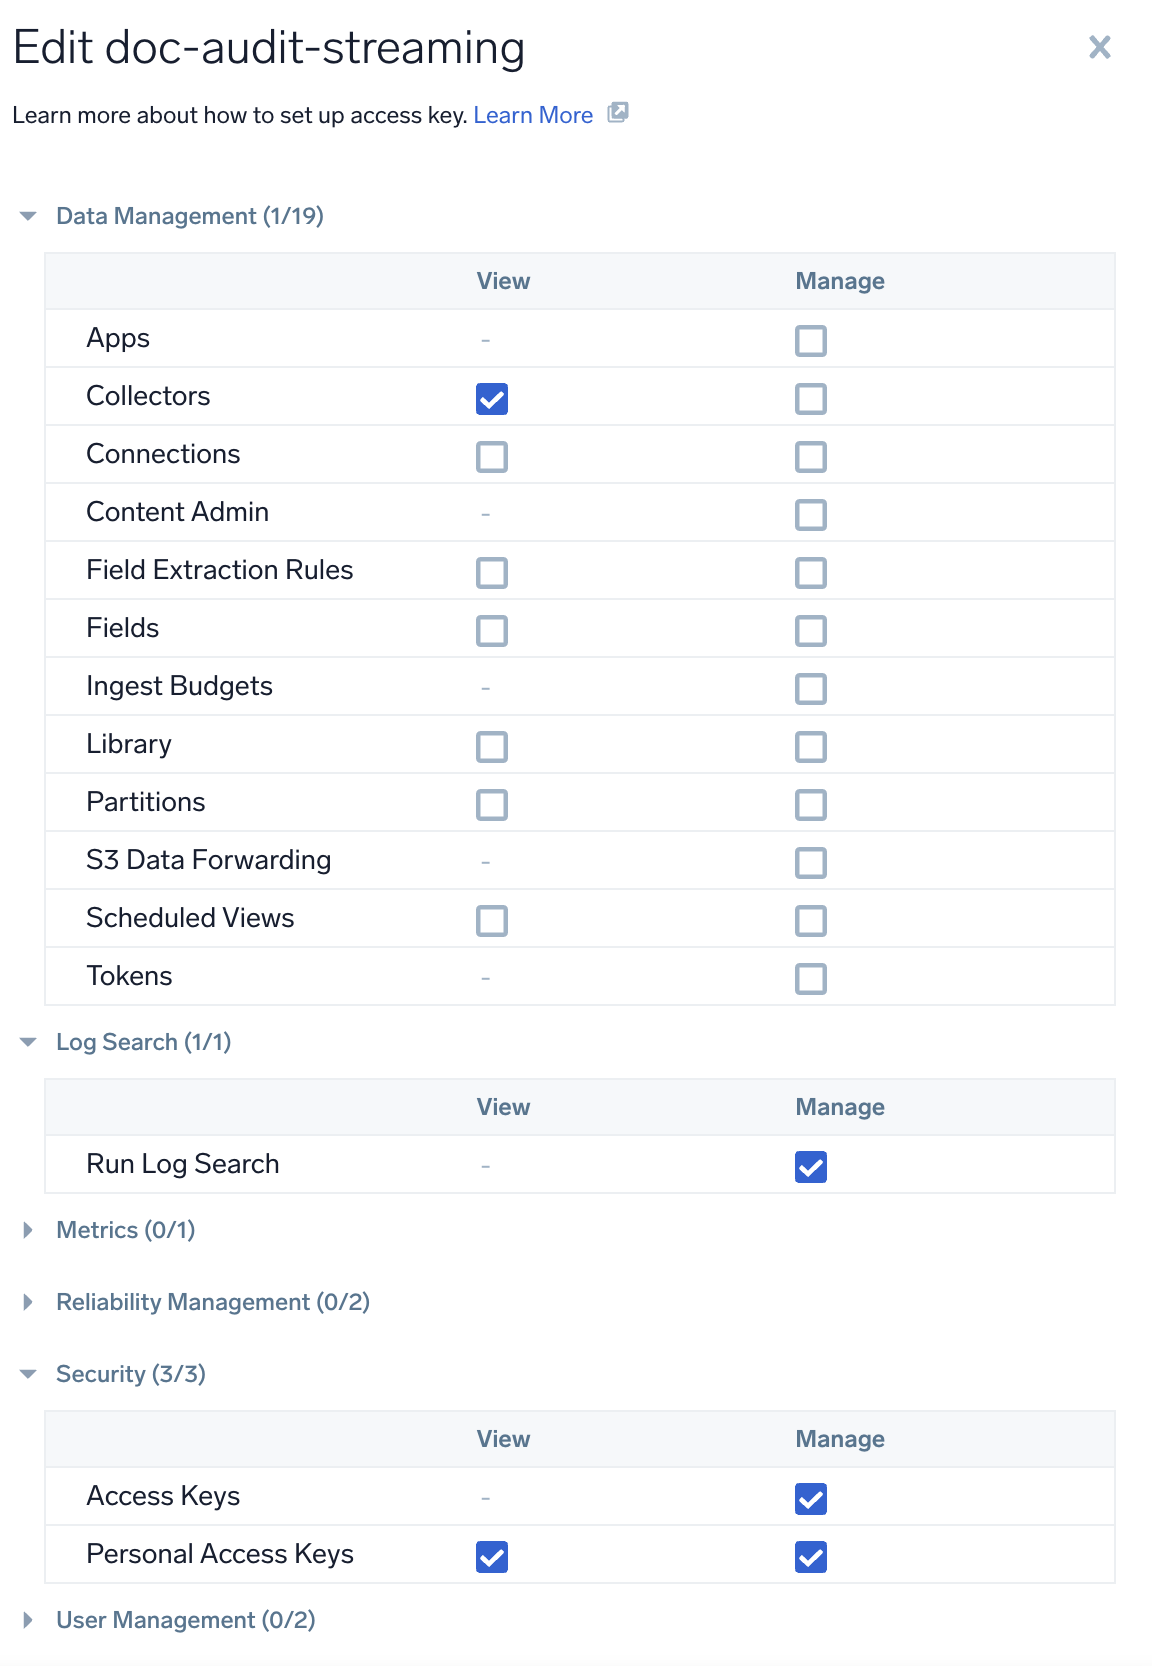
  1. Sumo Logic's Access ID and Access Key. An Access Key can have two scope types: Default and Custom. If selecting Custom, ensure you enable the permissions shown in the image below.

To configure Sumo Logic as a New Streaming Destination:

  1. Select Sumo Logic.

  2. In Select Connector, select an existing connector or create a new one. For now, let's add a new connector.

    sumo-stream-connector
    • Click New Connector → Add a name, description, and tags accordingly.

    • Add the Sumo Logic API server URL. To know your Sumo Logic API Endpoint refer Sumo Logic documentation

    • Add Sumo Logic Access ID and Access Key. You can either add new secrets or use existing ones. For now, we have used the existing secrets as shown in the GIF below.

    • Complete the Delegate setup → Save and Continue.

      add-sumo-logic-connector
    • Verify the connection and click Finish to complete the setup.

  3. Add the HTTP Source Address. Click Save and Continue to proceed.

    sumo-http-stream
  4. Verify the connection and click on Finish.

Activate or deactivate streaming

  1. To start streaming to this destination, toggle the status to Active. Audit logs will begin writing once the destination is activated and are streamed every 30 minutes.

  2. You can pause audit streaming, preventing any new audit events from being streamed to the configured endpoint by setting the status to Inactive.

    When you reactivate the streaming destination, Harness starts streaming the audit logs from the point where it was paused.

Update audit stream

You can change the audit stream configuration by clicking three dots beside the stream destination. This opens a pop-up menu with the following options:

  • Edit: Select a different streaming destination or make changes to the existing destination.

  • Delete: Delete the audit stream destination. You must set the audit stream destination to inactive before you can delete it.

Payload schema

Streamed audit events have a predictable schema in the body of the response.

Field

Description

Is required

auditEventId

Unique ID for the audit event.

Required

auditEventAuthor

Principal attached with audit event.

Required

auditModule

Module for which the audit event is generated.

Required

auditResource

Resource audited.

Required

auditResourceScope

Scope of the audited resource.

Required

auditAction

Action on the audited resource.

Required

auditEventTime

Date and time of the event.

Required

auditHttpRequestInfo

Details of the HTTP request.

Optional

Example audit event

This file contains a list of audit events in JSON format. Key points about the audit stream file naming convention:

  • The file name includes three timestamps: <t1>_<t2>_<t3>.

  • <t1> and <t2> indicate the time range of the audit events in the file. This range is provided for reference only and may not always be accurate. Timestamps can also be out of range if there is a delay in capturing events.

  • <t3> represents the time when the file was written.

In JSON format, an array of object is streamed per batch. Each object in the array represents an audit event.

In NDJSON format, each audit event is streamed as a single log line with the following structure:

Last updated

Was this helpful?