> For the complete documentation index, see [llms.txt](https://developer.harness.io/llms.txt). Markdown versions of documentation pages are available by appending `.md` to page URLs; this page is available as [Markdown](https://developer.harness.io/internal-developer-portal/use-idp/software-catalog/create-entity/catalog-discovery/custom-integrations/custom-metrics.md).
# Metrics
Ingest time-series metric data into Harness IDP, correlate it with catalog entities, and display it as charts on entity pages.
Metrics let you push time-series data into Harness IDP and display it as charts on catalog entity pages. Use them for anything you would plot over time, for example, latency percentiles, error rates, deployment frequency, uptime, or any numeric value that changes continuously.
Metrics are configured and managed separately from [Custom Integrations](/internal-developer-portal/use-idp/software-catalog/create-entity/catalog-discovery/custom-integrations/overview.md), but they share the same feature flag (`IDP_CUSTOM_INTEGRATION`), sit on the same Integrations page, and use the same correlation model.
{% hint style="info" %}
Custom Integrations ingest records (discrete events like builds, deployments, and incidents) displayed as tables. Metrics ingest data points (numeric values over time) displayed as charts. If your data is a table of events, use a [Custom Integration](/internal-developer-portal/use-idp/software-catalog/create-entity/catalog-discovery/custom-integrations/overview.md). If your data is a number that changes over time, use a Metric.
{% endhint %}
***
### Before you begin
Make sure you have the following in place:
* The `IDP_CUSTOM_INTEGRATION` feature flag must be enabled on your account. Contact [Harness Support](https://www.harness.io/support) to enable it.
* You need a Harness [Service Account Token (SAT)](https://developer.harness.io/harness-platform/use-harness-platform/platform-access-control/add-and-manage-service-account) or [Personal Access Token (PAT)](https://developer.harness.io/harness-platform/use-harness-platform/automation/api/add-and-manage-api-keys#create-personal-api-keys-and-tokens).
***
### Create a Metric
To create a metric, complete the following steps:
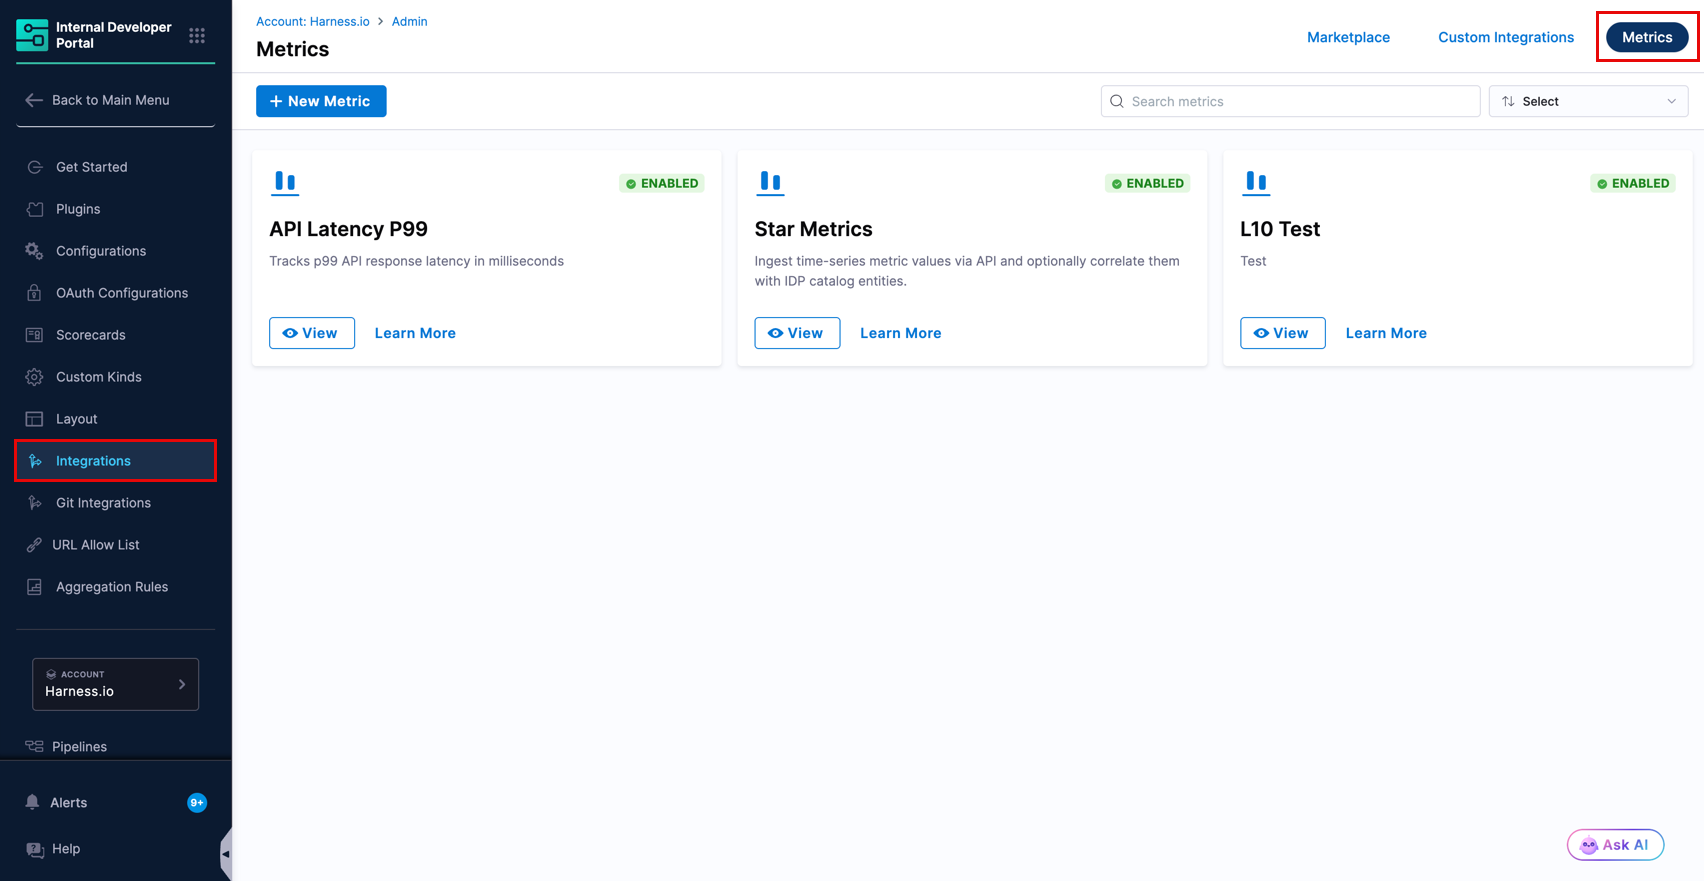
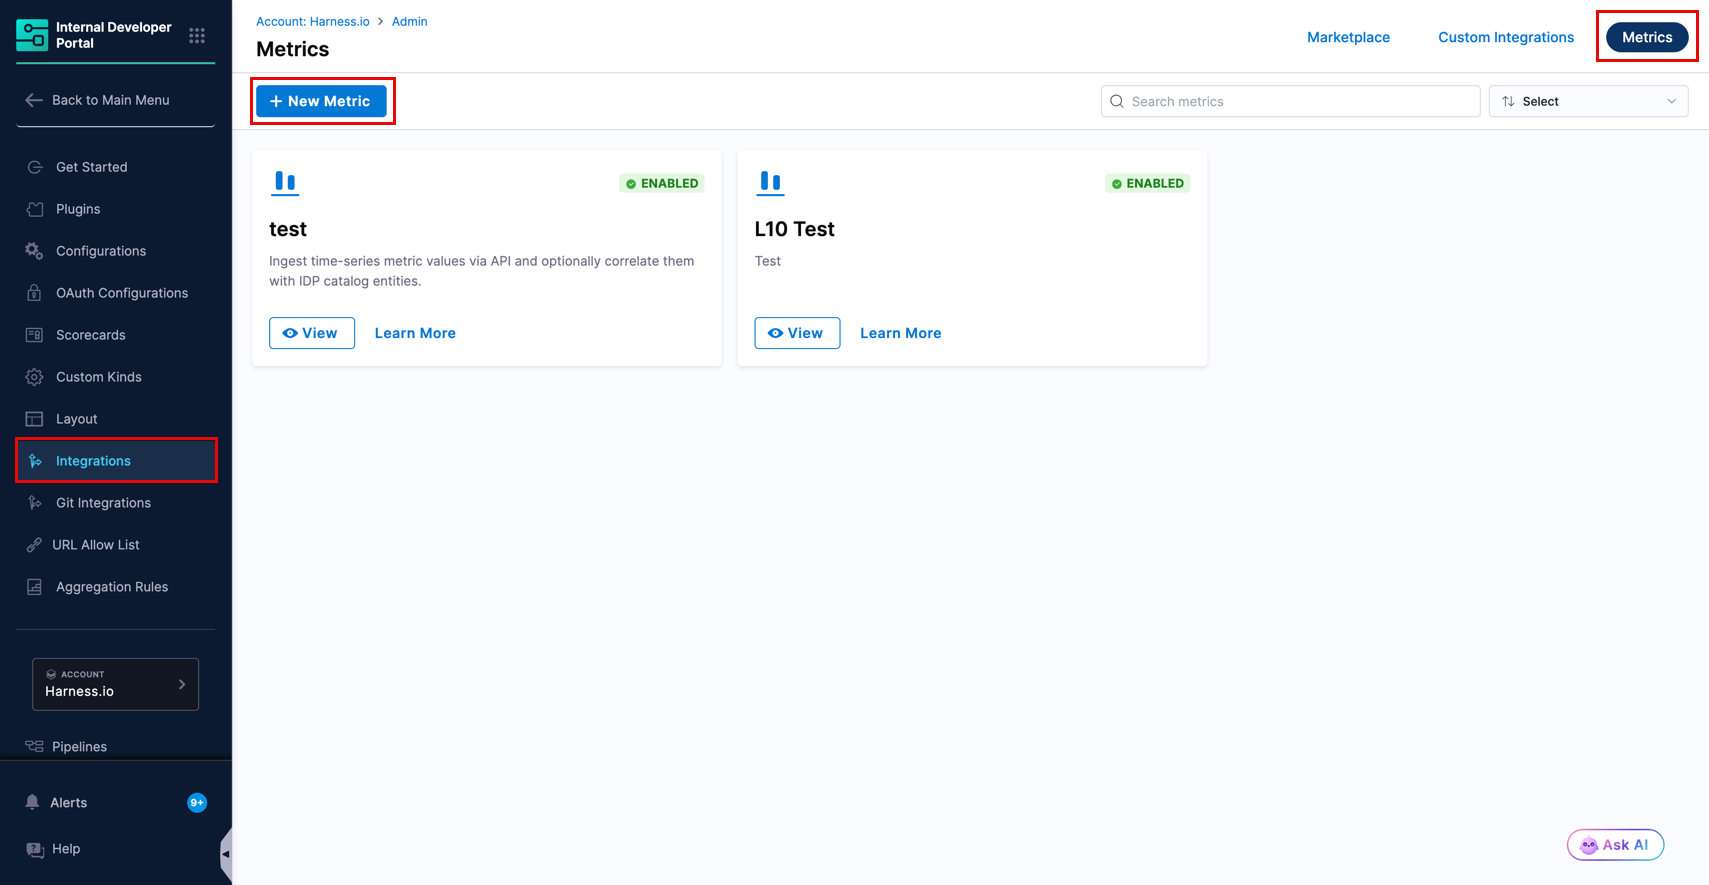
1. In Harness IDP, go to **Configure** → **Integrations**.
2. Select **Metrics** at the top right of the page.
3. Select **+ New Metric**.
#### Step 1: Configure the metric
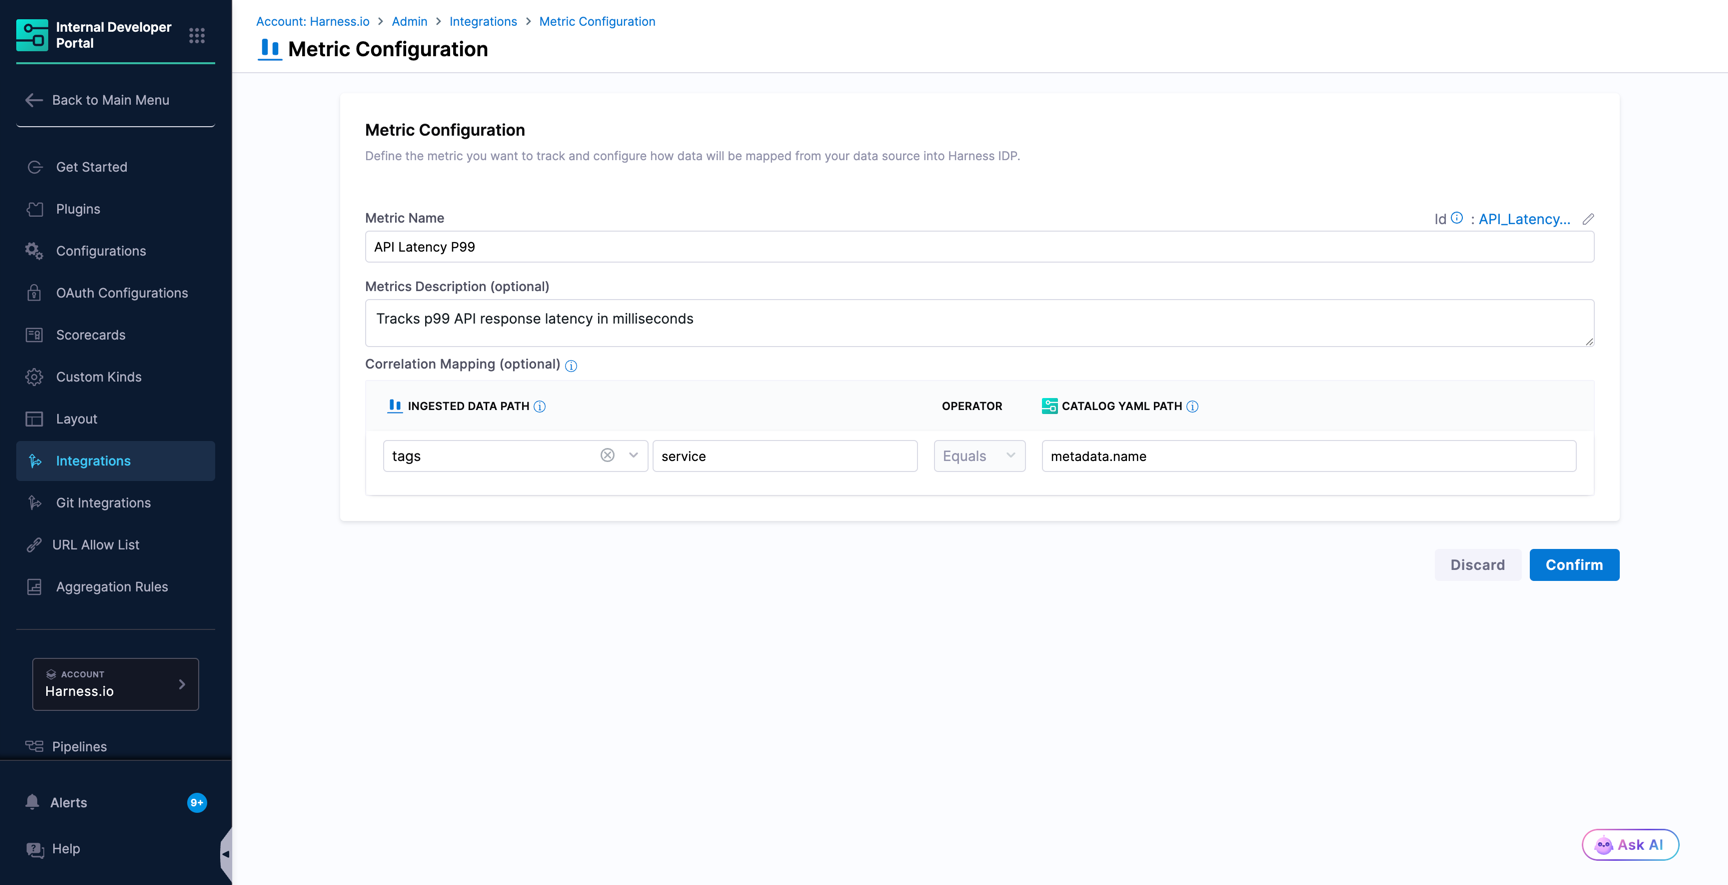
The **Metric Configuration** form has three sections:
| Field | Required | Description |
| ----------------------- | -------- | ---------------------------------------------------------------------------------------------------------------------------------------------------------- |
| **Metric Name** | Yes | A human-readable name, for example `Deployment Frequency` or `API Latency P99`. |
| **Id** | Yes | Auto-generated from the name. Select the pencil icon to change it. The Id becomes part of the ingestion endpoint URL and cannot be changed after creation. |
| **Metrics Description** | No | What the metric tracks, for example "Tracks how often code is deployed to production". |
#### Step 2: Configure Correlation Mapping (optional)
**Correlation Mapping** links metric data points to catalog entities, using the same model as Custom Integrations.
| Field | Description |
| ---------------------- | ---------------------------------------------------------------------------------------------------------------------- |
| **Ingested Data Path** | The field in the incoming payload to match on. The dropdown lists the available fields: `entity_ref` and any tag keys. |
| **Operator** | The comparison to apply. **Equals** is supported. |
| **Catalog YAML Path** | The path in the catalog entity YAML to match against, for example `metadata.name`. |
If you leave Correlation Mapping empty, data points must carry an `entity_ref` in the payload to be linked to an entity.
#### Step 3: Confirm
Select **Confirm**. The metric is created and its detail page opens.
***
### Ingest metric data
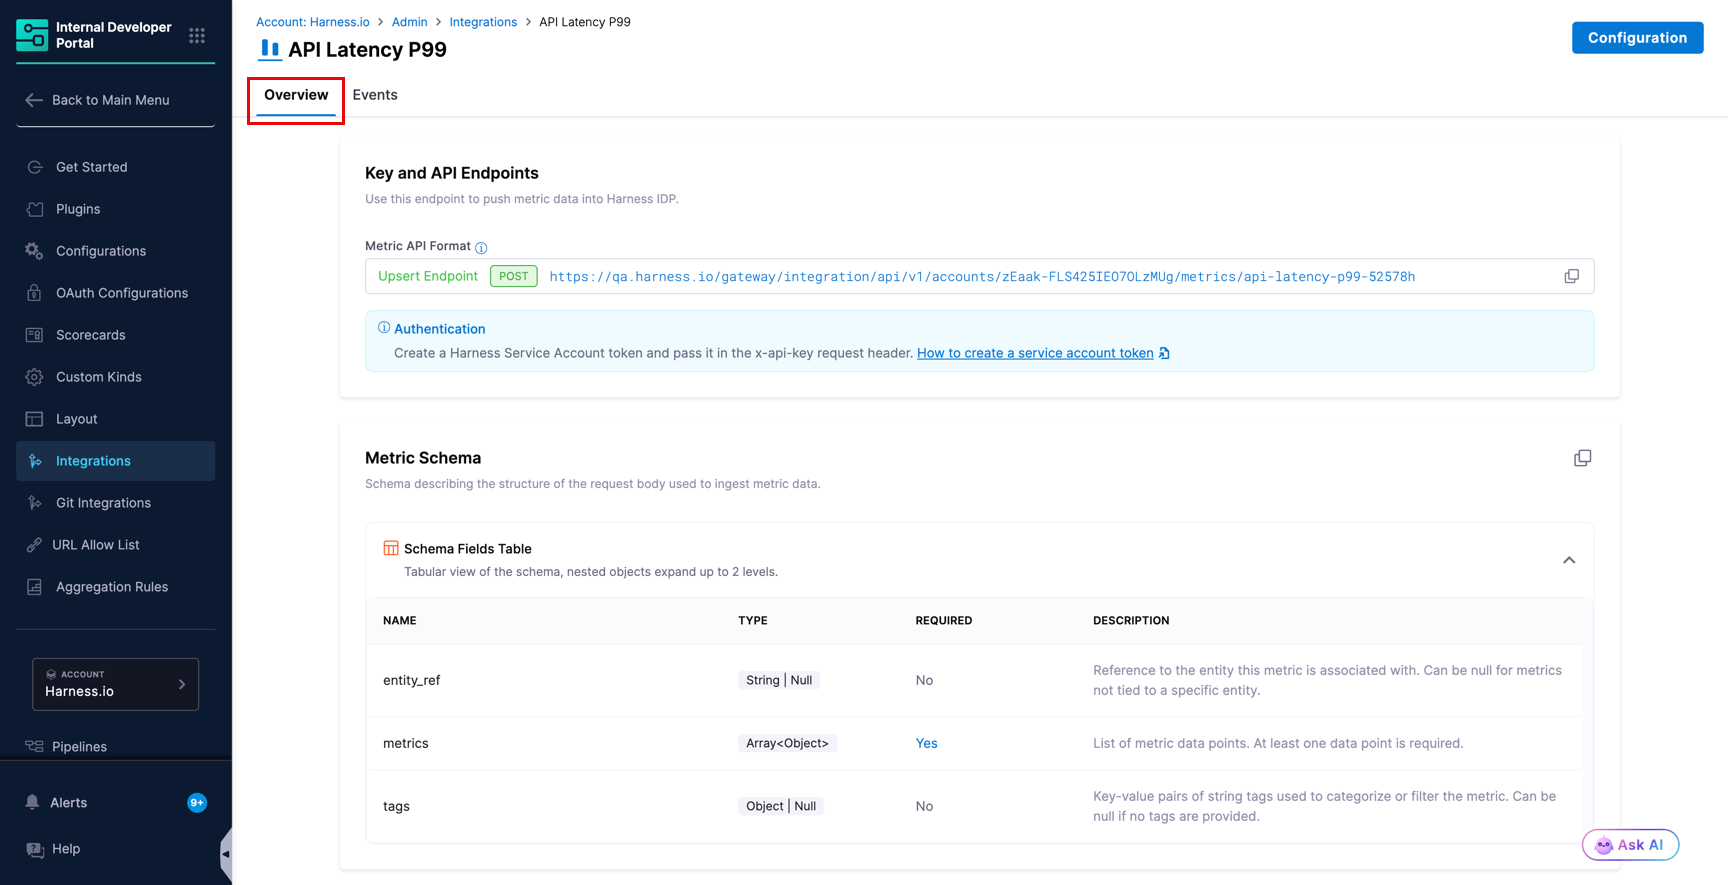
On the metric's **Overview** tab, copy the **Upsert Endpoint**:
The endpoint has this shape:
```http
POST https://app.harness.io/gateway/integration/api/v1/accounts/{accountId}/metrics/{metricId}
```
#### Headers
| Header | Required | Value |
| ----------------- | -------- | ----------------------------------------------------------------------------------------------------------------------------------------------------------------------------------------------------------------------------- |
| `x-api-key` | Yes | Both service account tokens (SAT) and personal access tokens (PAT) are supported. Refer [Add and manage api keys](https://developer.harness.io/harness-platform/use-harness-platform/automation/api/add-and-manage-api-keys). |
| `Harness-Account` | Yes | Your Harness account ID. |
| `Content-Type` | Yes | `application/json` |
#### Request body
| Field | Type | Required | Description |
| ------------ | ---------------- | -------- | ---------------------------------------------------------------------------------------------------------------------- |
| `metrics` | array of objects | Yes | At least one data point. Each point has a `value` (number) and a `timestamp` (ISO 8601 string). |
| `entity_ref` | string | No | Links these data points to a catalog entity directly. Can be null for metrics not tied to a specific entity. |
| `tags` | object | No | Key-value pairs of string tags to categorize or filter the metric. Usable as the source side of a Correlation Mapping. |
```json
{
"entity_ref": "component:default/auth-service",
"tags": { "env": "prod", "region": "us-east-1" },
"metrics": [
{ "value": 245.8, "timestamp": "2026-05-26T12:00:00Z" },
{ "value": 312.1, "timestamp": "2026-05-26T12:05:00Z" }
]
}
```
#### cURL example
```sh
curl \
--location 'https://app.harness.io/gateway/integration/api/v1/accounts//metrics/' \
--header 'Content-Type: application/json' \
--header 'x-api-key: ' \
--header 'Harness-Account: ' \
--data '{
"entity_ref": "component:default/auth-service",
"tags": { "env": "prod", "region": "us-east-1" },
"metrics": [
{ "value": 245.8, "timestamp": "2026-05-26T12:00:00Z" },
{ "value": 312.1, "timestamp": "2026-05-26T12:05:00Z" }
]
}'
```
{% hint style="info" %}
Metric data points are append-only. Each push inserts new points; it does not update or replace earlier ones. There is no delete endpoint for metrics.
{% endhint %}
***
### Monitor ingestion with the Events tab
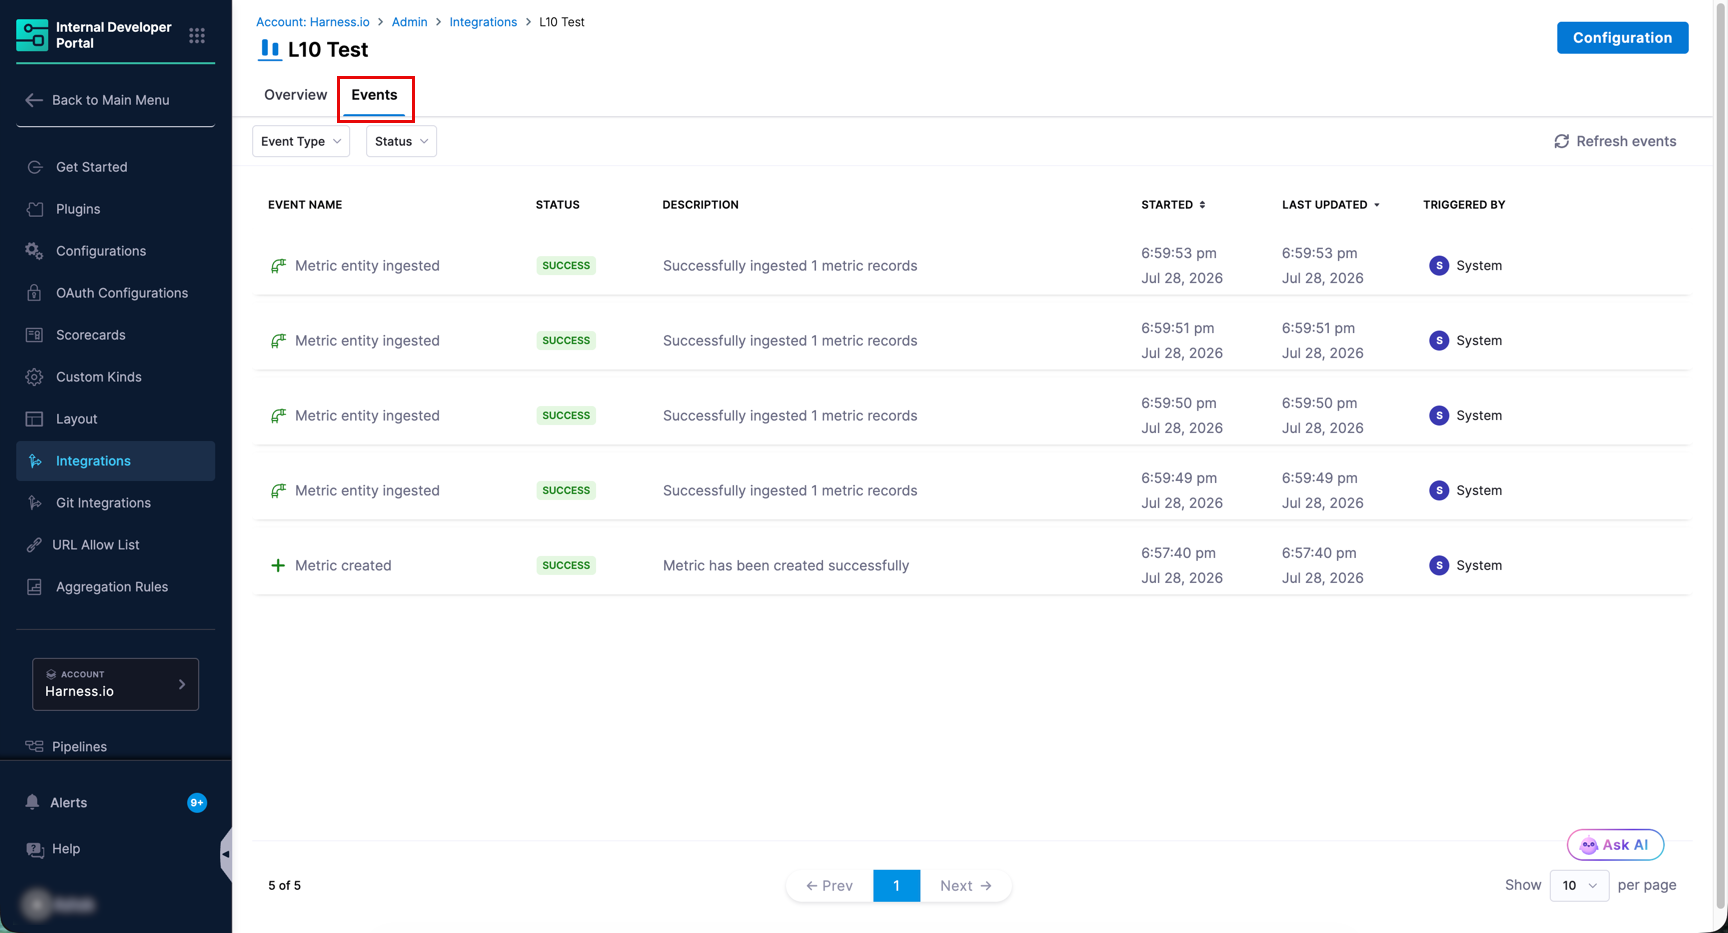
Every Metric has an **Events** tab that records creation and ingestion activity, identical in structure to the Events tab on Custom Integrations.
| Event Name | Meaning |
| -------------------------- | ----------------------------------------------------------------------- |
| **Metric created** | The metric was created successfully. |
| **Metric entity ingested** | Data points were ingested successfully. The description shows how many. |
| **Metric entity rejected** | An incoming payload was not ingested. The description gives the reason. |
***
### Display metrics on entity pages
To show metric data on a catalog entity page, add a tab to your entity layout using the `CustomMetricsTab` component:
```yaml
- name: Custom Metrics
path: /custom-metrics
title: Custom Metrics
contents:
- component: CustomMetricsTab
specs:
props:
type: custom
```
Follow the same steps as for Custom Integration tabs: go to **Configure** → **Layout** → **Catalog Entities**, edit the layout for the relevant entity kind and type, add the tab entry, and select **Save**. Go to [Configure the layout](/internal-developer-portal/use-idp/software-catalog/create-entity/catalog-discovery/custom-integrations/view-data-in-catalog.md#configure-the-layout) to follow the full walkthrough.
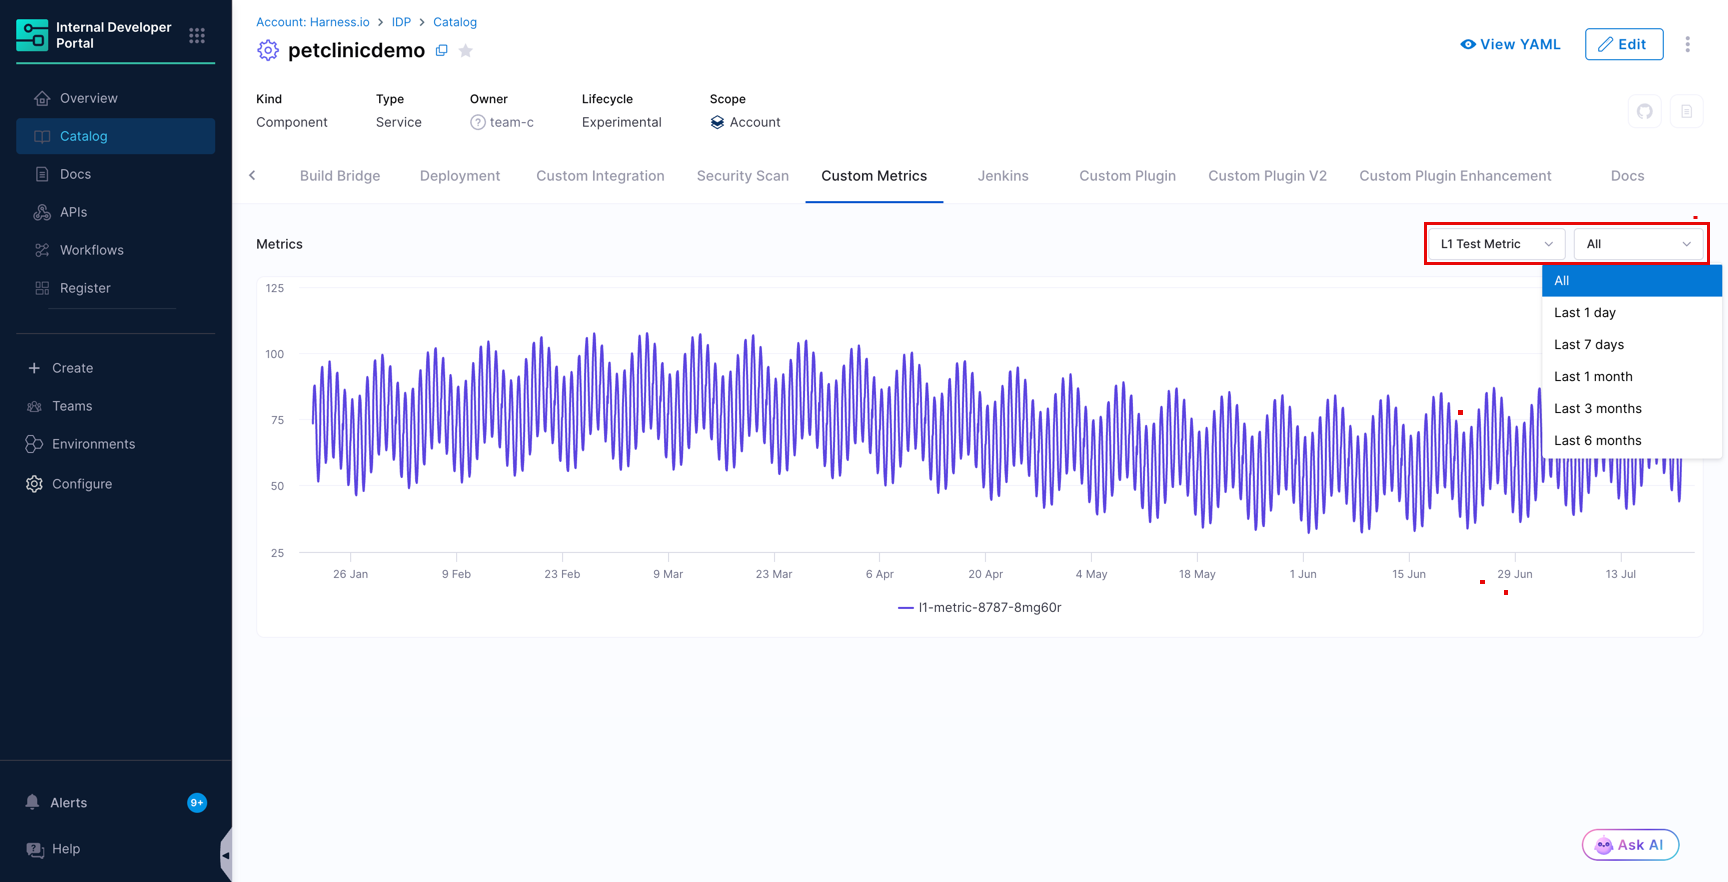
The tab displays a chart of the metric data points over time for that entity. Users can select a time range and hover over data points to see the value and timestamp.
***
### Manage a Metric
To manage an existing metric, go to **Configure** → **Integrations** → **Metrics**, find its card, and select **View**. Then select **Configuration** at the top right.
You can update the **Metric Name**, **Metrics Description**, and the **Catalog YAML Path** of the Correlation Mapping.
The Id and the **Ingested Data Path** of the Correlation Mapping are fixed after creation.
***
### FAQs How is a Metric different from a Custom Integration?
A Custom Integration ingests discrete records (builds, deployments, incidents) and displays them in a table. A Metric ingests numeric data points over time and displays them as a chart. Use a Custom Integration for events, a Metric for time-series.
Can I update or delete metric data points?
No. Metric data points are append-only. Each push inserts new points. There is no update or delete endpoint for metric data.
Can I send metrics without linking them to an entity?
Yes. The `entity_ref` field is optional and can be null. Metrics not tied to a specific entity are ingested but will not appear on any entity page.
What is the Ingested Data Path dropdown limited to?
For metrics, the Correlation Mapping source can be set to `entity_ref` or any tag key you send in the payload. Unlike Custom Integrations, there are no schema-defined fields beyond `entity_ref`, `tags`, and `metrics`.
My metric data is ingested but nothing shows on the entity page.
Check the same things as for Custom Integrations: the layout must include a `CustomMetricsTab` tab for that entity kind and type, and the data points must be correlated to the entity through either Correlation Mapping or `entity_ref` in the payload. Go to [Display metrics on entity pages](#display-metrics-on-entity-pages) to add the tab.
{% @harness-feedback/feedback %}