> For the complete documentation index, see [llms.txt](https://developer.harness.io/llms.txt). Markdown versions of documentation pages are available by appending `.md` to page URLs; this page is available as [Markdown](https://developer.harness.io/internal-developer-portal/use-idp/software-catalog/create-entity/catalog-discovery/custom-integrations/view-data-in-catalog.md).
# View data in the catalog
Add a Custom Integration tab to your entity layout so ingested build, deployment, incident, quality, security, and custom data appears on catalog entity pages.
Ingesting data and displaying it are two separate steps. Once records are arriving and correlating to entities, you add a tab to your entity layout to surface them. This is a one-time configuration per entity kind and type.
{% hint style="info" %}
If your [Events tab](/internal-developer-portal/use-idp/software-catalog/create-entity/catalog-discovery/custom-integrations/ingest-data.md#monitor-ingestion-with-the-events-tab) shows successful ingestion but entity pages show nothing, the layout configuration is almost always the missing piece.
{% endhint %}
### Before you begin
Make sure you have the following in place:
* Confirm data is being ingested successfully. Go to [Monitor ingestion](/internal-developer-portal/use-idp/software-catalog/create-entity/catalog-discovery/custom-integrations/ingest-data.md#monitor-ingestion-with-the-events-tab).
* Know the entity **kind** and **type** you want to show the data on, for example kind `component` and type `service`.
* You need permissions to edit layouts.
***
### Configure the layout
Each data kind gets its own tab. To show builds and deployments on the same entity page, add two tabs.
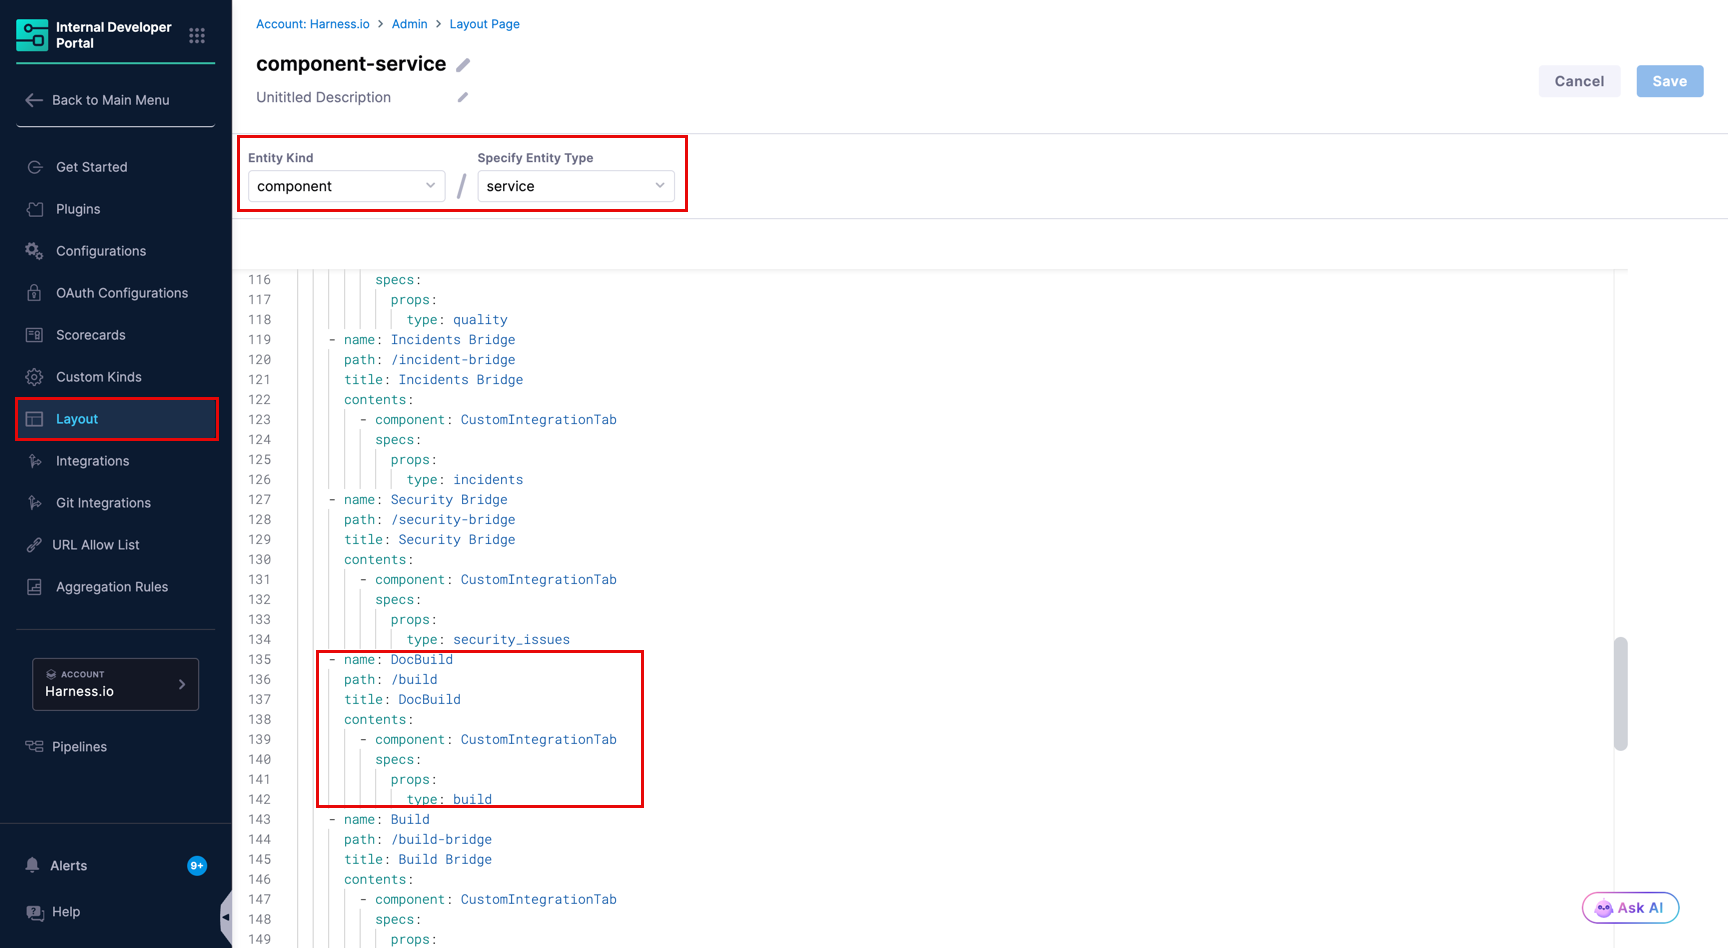
1. In Harness IDP, go to **Configure** → **Layout** → **Catalog Entities**.
2. Edit the existing layout for your entity, or create a new one.
3. Select the **Entity Kind** and **Entity Type** that match the entities your records correlate to.
4. In the YAML editor, add a new top-level tab entry using the `CustomIntegrationTab` component, and set the data kind in `specs.props.type`.
```yaml
- name: Build
path: /build
title: Build
contents:
- component: CustomIntegrationTab
specs:
props:
type: build
```
Set `type` to the data schema of the integration whose records you want in this tab: `build`, `deployment`, `incidents`, `quality`, `security_issues`, `security_scan`, or `custom`. Set `name`, `path`, and `title` to whatever you want the tab called.
5. Select **Save**.
The tab now appears on every entity of that kind and type which has correlated data.
To show more than one data kind, add one tab per kind. For example, to show deployments, incidents, and quality alongside the build tab above:
```yaml
- name: Deployment
path: /deployment
title: Deployment
contents:
- component: CustomIntegrationTab
specs:
props:
type: deployment
- name: Incidents
path: /incidents-bridge
title: Incidents
contents:
- component: CustomIntegrationTab
specs:
props:
type: incidents
- name: Quality
path: /quality
title: Quality
contents:
- component: CustomIntegrationTab
specs:
props:
type: quality
- name: Security Issues
path: /security-issues
title: Security Issues
contents:
- component: CustomIntegrationTab
specs:
props:
type: security_issues
- name: Security Scans
path: /security-scans
title: Security Scans
contents:
- component: CustomIntegrationTab
specs:
props:
type: security_scan
- name: Custom
path: /custom-data
title: Custom Data
contents:
- component: CustomIntegrationTab
specs:
props:
type: custom
```
{% hint style="info" %}
Each tab is bound to a data kind, not to a specific integration. If three Jenkins pipelines each push builds through their own integration, all of them appear in the same Build tab, and users filter between them.
{% endhint %}
***
### What users see on the tab
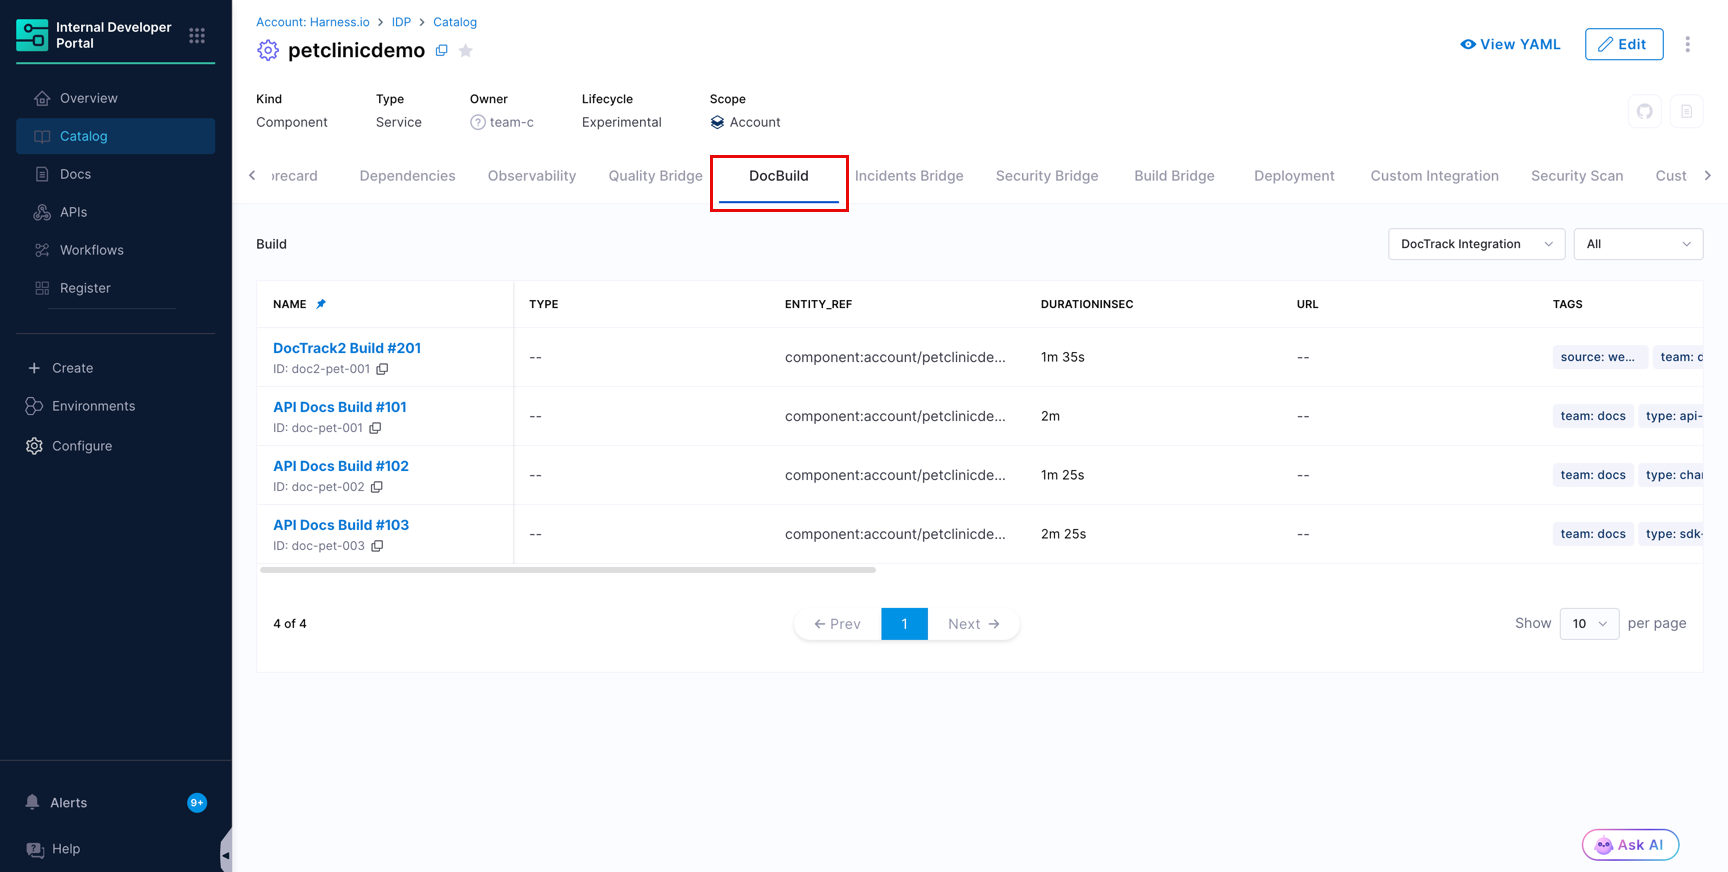
The tab lists the records correlated to that entity, most recent first.
#### Columns
The columns come from the **Column** selections you made in the [Schema Fields Table](/internal-developer-portal/use-idp/software-catalog/create-entity/catalog-discovery/custom-integrations/create-custom-integration.md#schema-fields-table) when configuring the integration. To change what is displayed, edit the integration and adjust those selections.
If a record includes a `url` value, its name becomes a link back to the record in the source tool, so users can jump from a build row to the build in Jenkins.
#### Filters
Two filters appear above the table, and each is shown only when it is useful:
| Filter | When it appears |
| --------------- | -------------------------------------------------------------------------------- |
| **Integration** | When more than one integration has contributed data of this kind to this entity. |
| **Type** | When the ingested records carry a `type` value. |
Both default to showing everything. The **Type** filter is why sending `type` is worth the effort: it lets users separate rollbacks from standard deployments in a single tab.
#### Record details
Select any row to open a details panel showing the full record, including fields that are not displayed as columns, along with its identifier, data kind, source integration, type, and created and last updated timestamps.
{% hint style="info" %}
The details panel is the fastest way to debug a correlation or mapping problem. If a record looks wrong there, the issue is in the payload or the webhook mapping, not in the layout.
{% endhint %}
***
### Scope and visibility
An entity can display data from integrations at its own scope and at any parent scope. An entity in a project sees data from integrations created in that project and from account-level integrations, but not from integrations created in a different project.
Go to [Scope](/internal-developer-portal/use-idp/software-catalog/create-entity/catalog-discovery/custom-integrations/overview.md#scope) for details.
***
### Next steps
Go to [FAQs](/internal-developer-portal/use-idp/software-catalog/create-entity/catalog-discovery/custom-integrations/faqs.md) for common questions and troubleshooting.
{% @harness-feedback/feedback %}