Traceable Integration
How to configure the Traceable integration in Harness IDP to surface API security data alongside your API catalog entities.
The Traceable integration brings API security data from Traceable into your Harness IDP catalog. Once configured, your API entity pages show risk scores, open issues, and sensitive data types for each endpoint.
How it works
Traceable watches live traffic to your APIs and collects security data per endpoint: risk scores, open issues, and what types of sensitive data flow through each one. Traceable endpoints are pulled every 24 hours and synced against your API entities in IDP. Matched endpoints appear in the Endpoints tab on the API entity page in IDP. Endpoints Traceable found that have no matching API entity in IDP appear in the Unmatched tab inside your Traceable integration page in IDP.
Before you begin
The
IDP_API_ENDPOINT_EXTRACTIONfeature flag must be enabled for your account. Contact Harness Support to enable it. Without this flag, Traceable does not appear as an option when configuring a new Harness integration.Your Traceable tenant must be configured to push data to Harness Unified Data Platform (UDP). Contact your Traceable account team for setup details.
Your API entities must have
kind: APIandtype: openapi. Endpoint matching works against the extracted endpoints from each entity's OpenAPI spec. See API endpoint extraction and enrichment.You need Admin access in Harness IDP to configure integrations.
Configure the integration
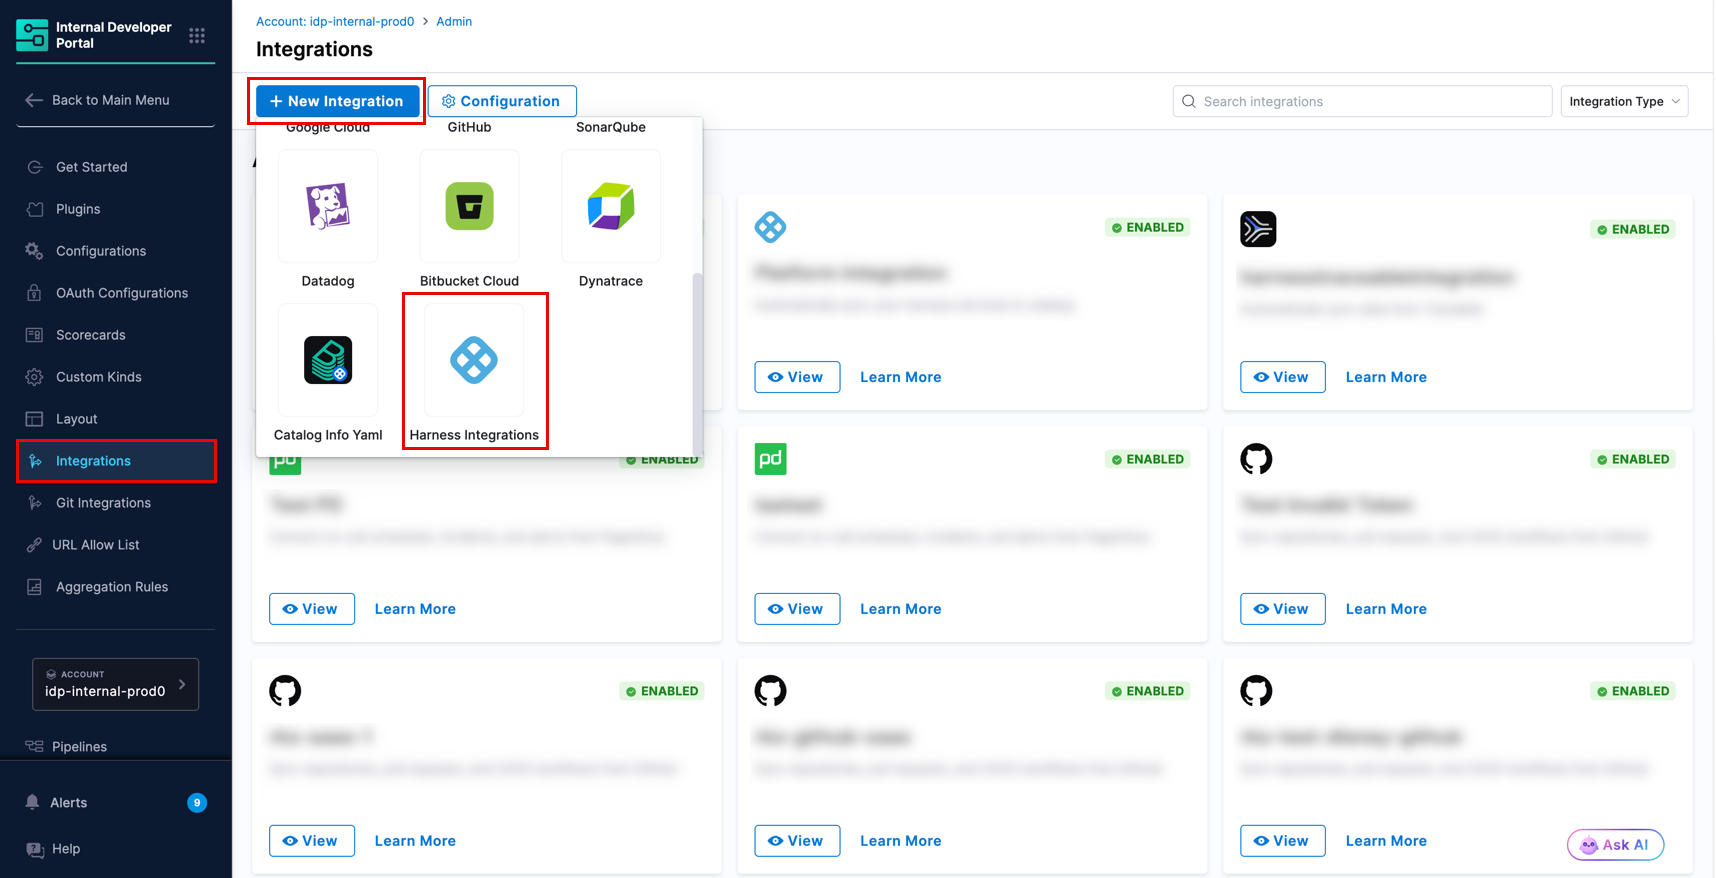
In IDP, go to Configure → Integrations.
Select + New Integration.
In the integration picker, select Harness Integrations.

LIMIT: ONLY ONE INTEGRATION PER TYPE
Currently, you can create only one Traceable integration in your account. If one already exists, you can manage or suspend it but cannot create another.
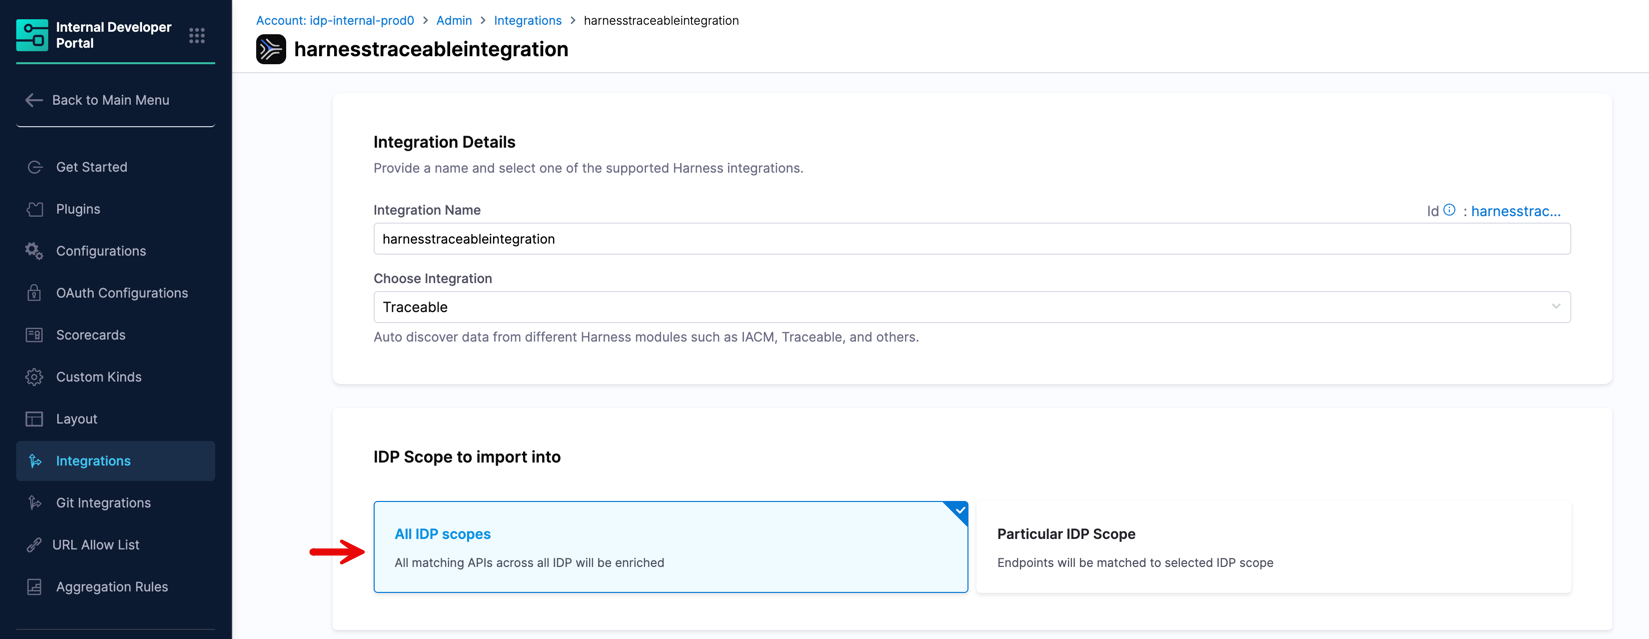
On the integration details page, enter a name in the Integration Name field.
Under Choose Integration, select Traceable.
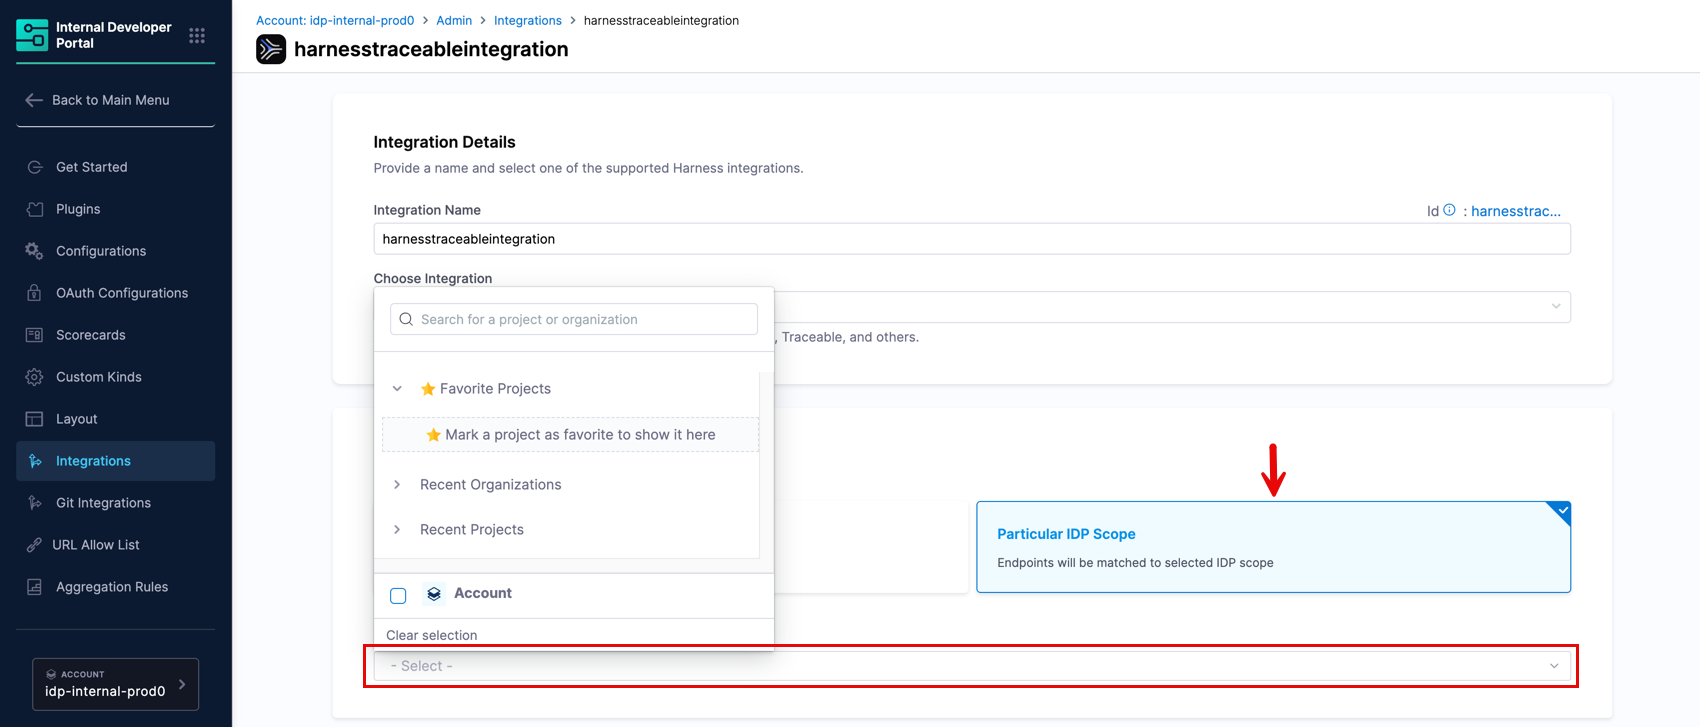
Under IDP Scope to import into, choose one of the following:
All IDP scopes: Traceable data enriches all matching API entities across your entire IDP catalog.

Particular IDP Scope: Select specific projects or organizations. Only API entities within those scopes are enriched.

Click Confirm & Enable.
Once saved, the integration appears in the Configure → Integrations list.
Update the catalog layout
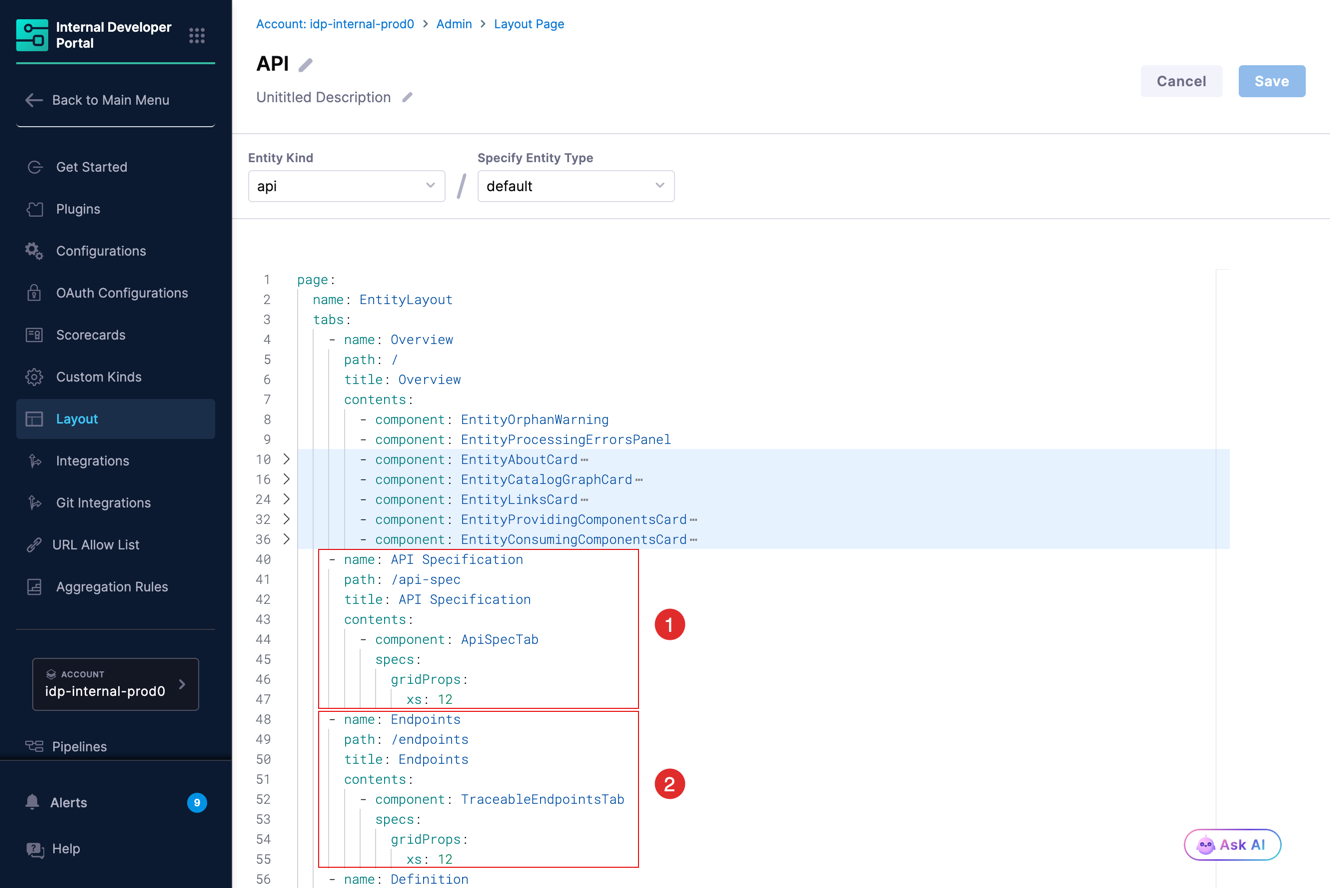
To display the Endpoints and API Specification tabs on your API entity pages, add both components to the layout for the api kind.
Go to Configure → Layout, select the API entity kind layout, and add the following tab entries to the layout YAML:

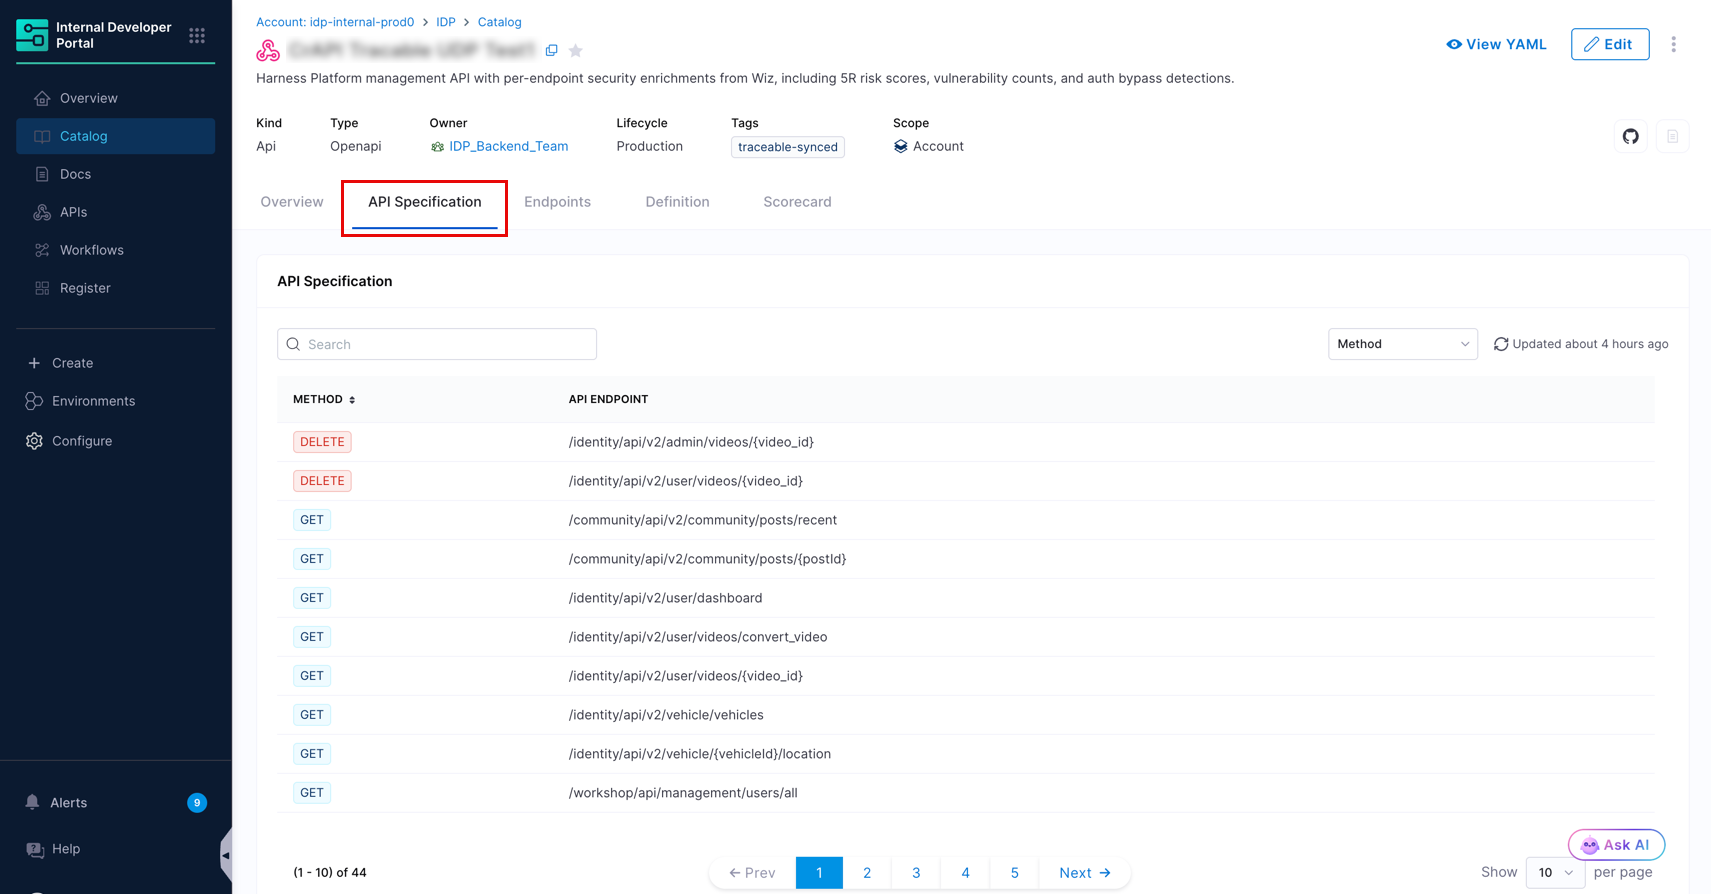
View the API specification
The API Specification tab shows the IDP-extracted endpoint list from the entity's OpenAPI spec. This data comes from the endpoint extraction feature. It shows each endpoint's HTTP method and path, and displays a timestamp for when the list was last updated.

Matched and unmatched endpoints
When the matching job runs, it compares every endpoint Traceable has observed against the endpoints in your API entities' OpenAPI specs. For an endpoint to match, all of the following must be true:
The HTTP method matches exactly (for example, GET matches GET, not POST).
The path has the same number of segments.
Fixed segments in the path match exactly (for example,
/users/must match/users/).Parameterized segments in the OpenAPI spec (for example,
{userId}) match any single value Traceable observed in live traffic.
GET /users/{id}
GET /users/123
Match
GET /users/{id}/orders/{orderId}
GET /users/123/orders/456
Match
GET /users/{id}
GET /accounts/123
No match: users and accounts are different fixed segments
POST /users/{id}
GET /users/123
No match: HTTP method mismatch
GET /users/{id}
GET /users/123/profile
No match: different number of path segments
View matched endpoints
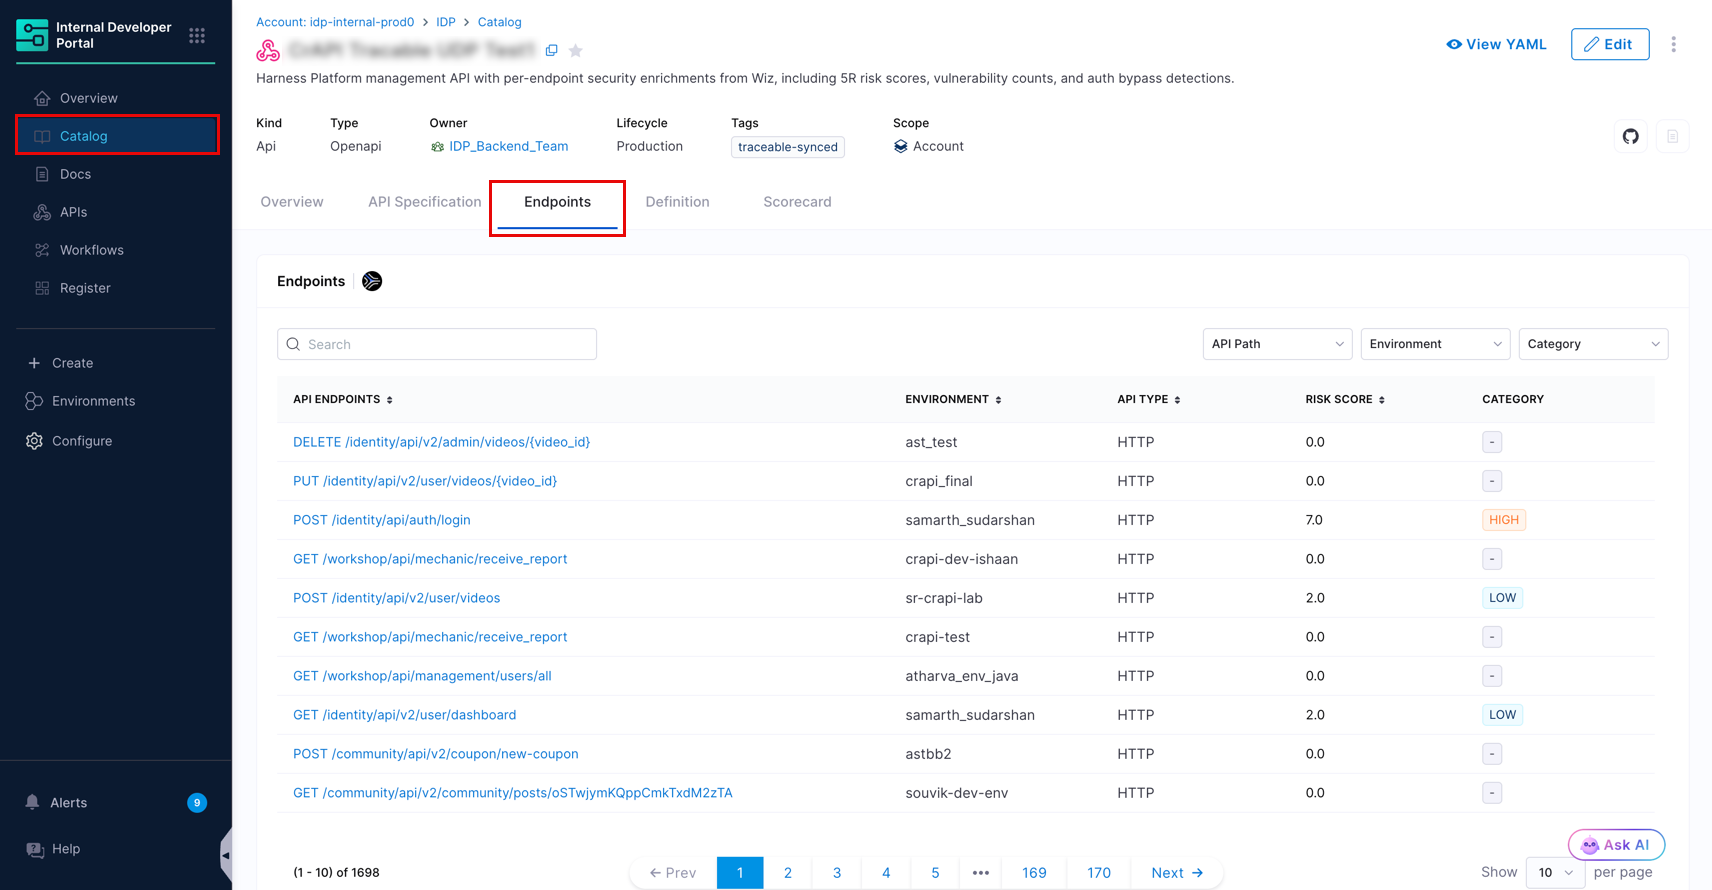
After the matching job runs, go to any API entity page and select the Endpoints tab. The tab lists all Traceable endpoints matched to the entity's OpenAPI spec.

When matched data is present, the table shows the following columns:
API Endpoints
The endpoint path as discovered by Traceable
Environment
The environment in which Traceable observed traffic
API Type
The API protocol type (for example, HTTP)
Risk Score
Traceable's computed risk score for this endpoint
Category
The risk category (Low, Medium, High, Critical)
You can filter by API Path, Environment, and Category, and search by endpoint path.
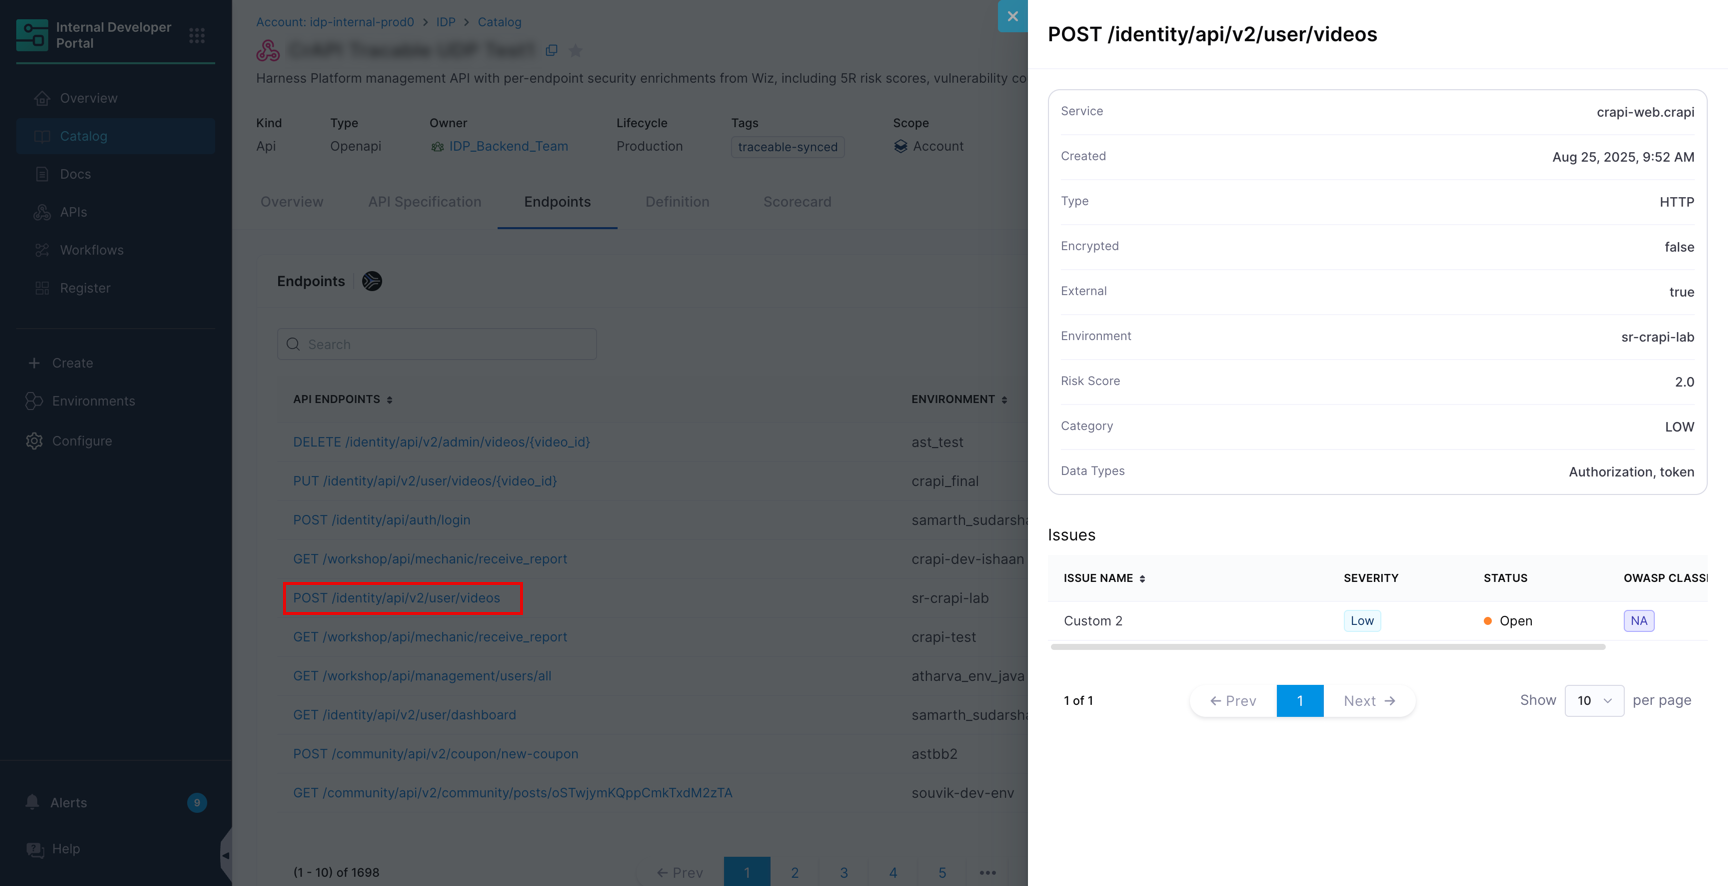
Select any endpoint to open a detail drawer showing:
Service
The service name as identified by Traceable
Created
Timestamp when Traceable first detected this endpoint
Type
Protocol type (for example, HTTP)
Encrypted
Whether the endpoint uses encryption
External
Whether the endpoint is externally accessible
Environment
Observed environment
Risk Score
Numeric risk score
Category
Risk category
Data Types
Categories of sensitive data flowing through this endpoint (for example, Phone, Credit Card PIN)
Open Issues
Table of open security issues: Issue Name, Severity, Status, and OWASP Classification

View unmatched endpoints
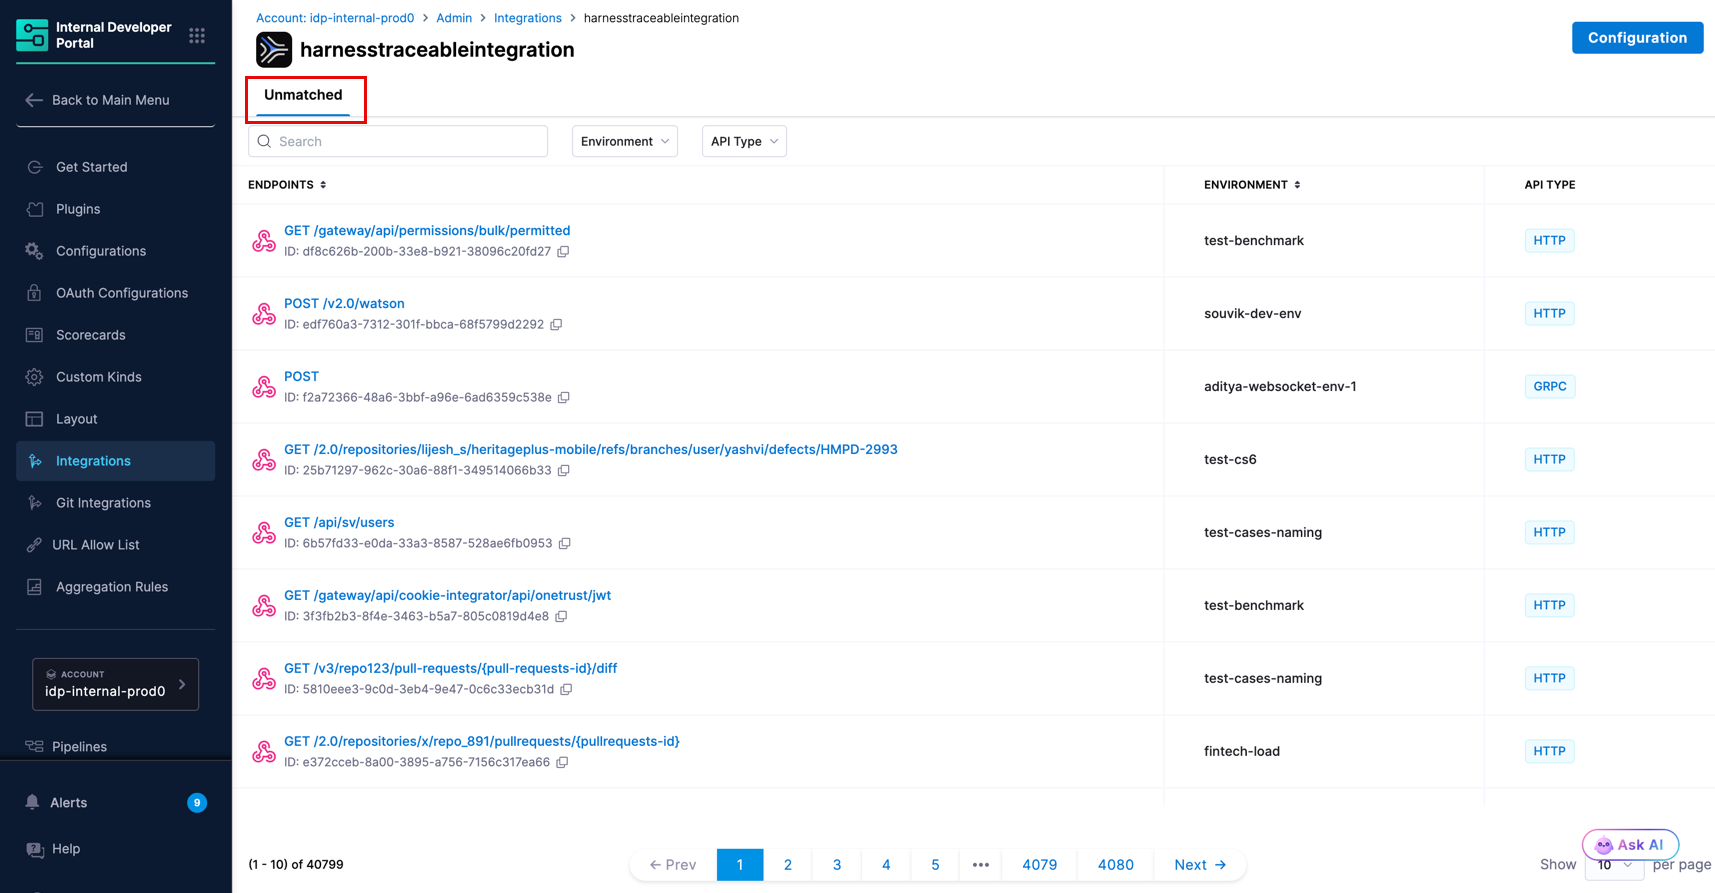
Traceable endpoints that did not match any IDP API entity's OpenAPI spec are visible in the admin view.
Go to Configure → Integrations and select your Traceable integration by name. The Unmatched tab lists all such endpoints.

The table shows ENDPOINTS, ENVIRONMENT, and API TYPE columns. You can filter by Environment and API Type, and search by endpoint path.
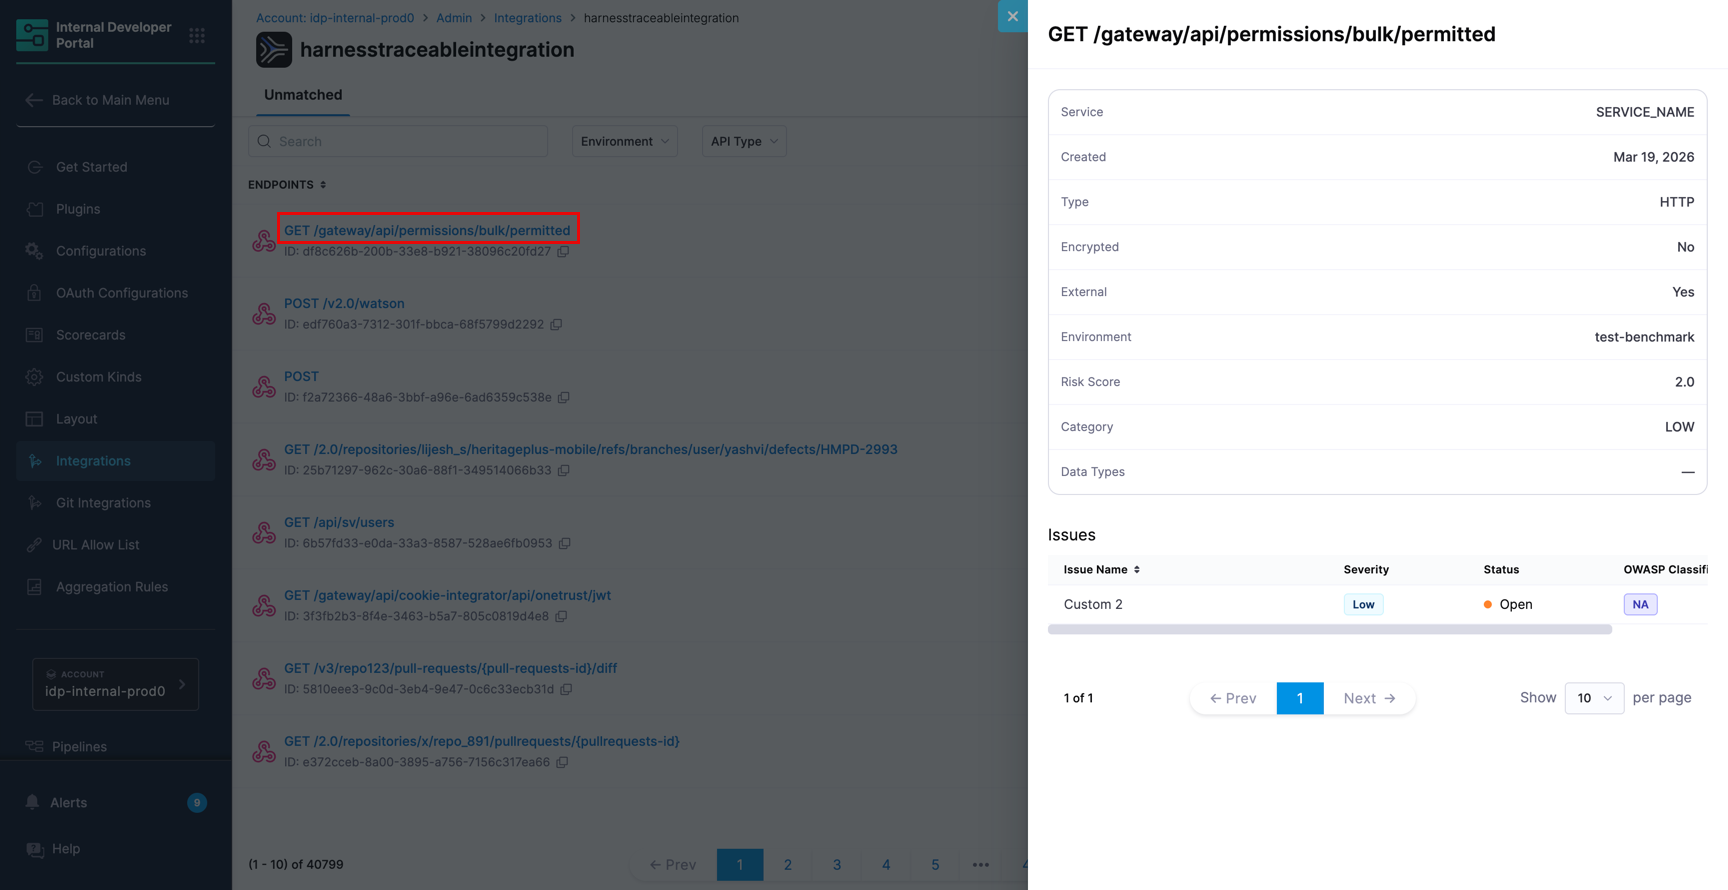
Select any unmatched endpoint to see its details, including Service, Type, Encrypted, External, Environment, Risk Score, Category, Data Types, and any associated Issues.

Endpoints appear in the unmatched list when:
The corresponding API entity has not been registered in IDP yet.
Traceable's path detection resulted in over-merging (multiple distinct paths collapsed into one endpoint) or under-merging (one path split into multiple entries because path parameters were treated as literal segments rather than variables).
Use Traceable data in scorecards
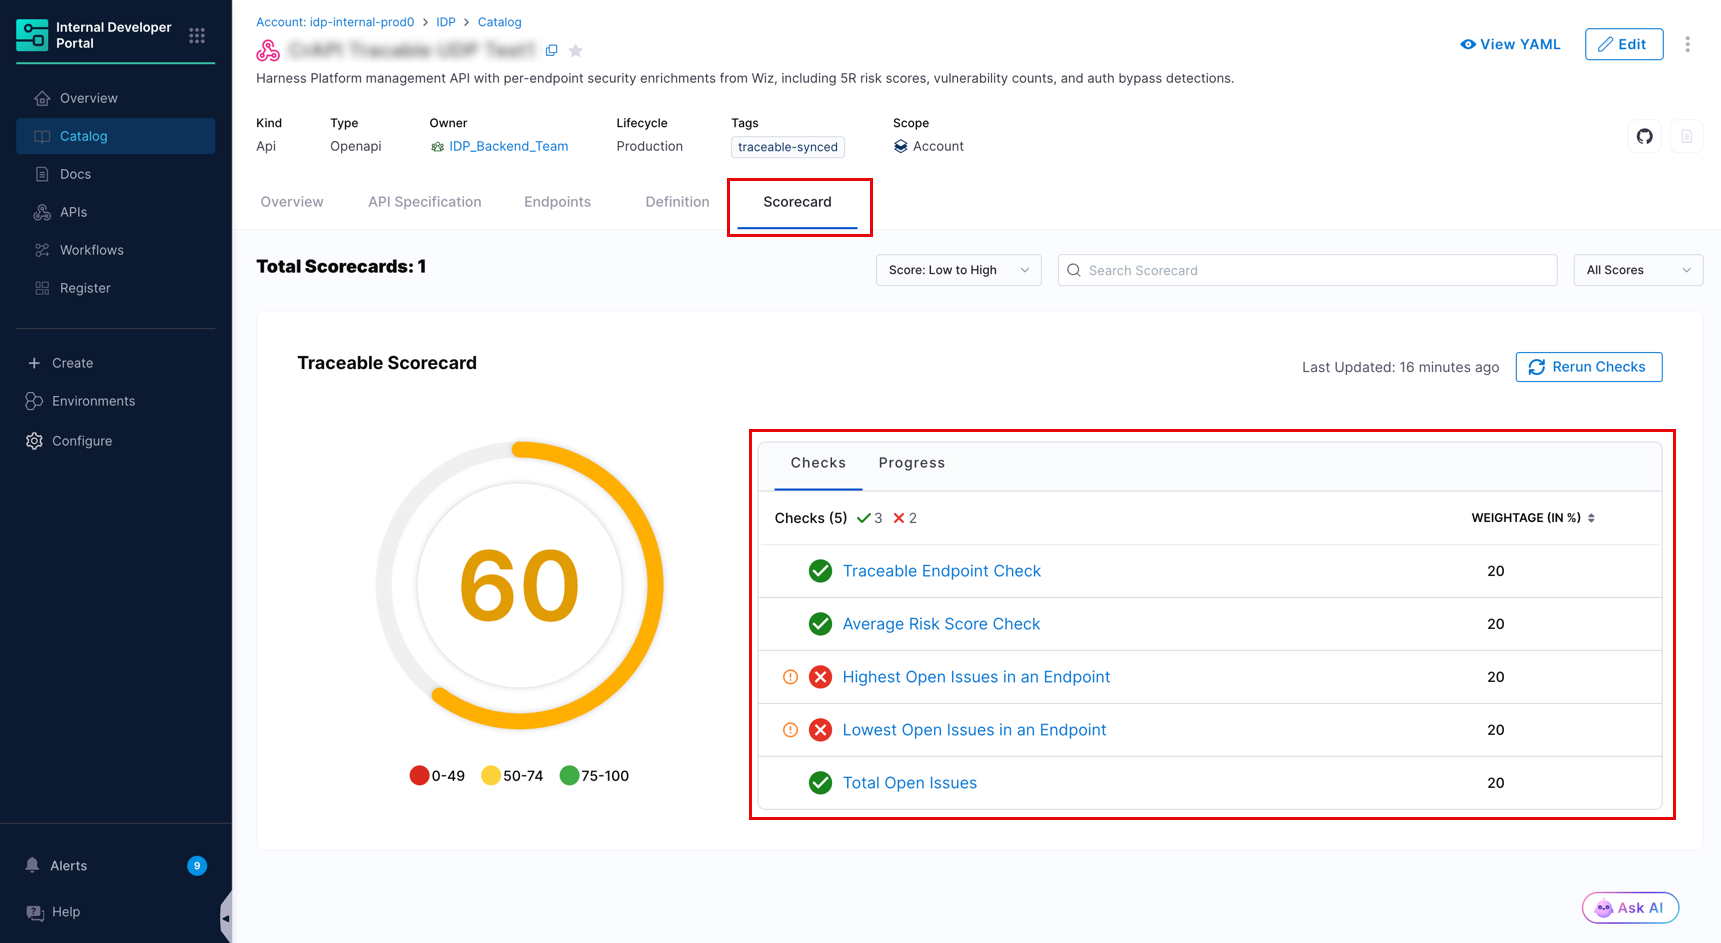
After the integration is active and endpoints are matched, Traceable-specific data points become available in Scorecards for configuring checks on API entities. For configuration steps, see Configure Traceable data points.
The following data points are currently available:
Average Risk Score
Mean risk score across all matched endpoints for the entity
Total Open Issues
Sum of all open issues across all matched endpoints
Highest Open Issues on an Endpoint
Highest open-issue count among all matched endpoints
Lowest Open Issues on an Endpoint
Lowest open-issue count among all matched endpoints

Suspend the integration
To temporarily stop Traceable data from displaying in IDP, go to Configure → Integrations, select your Traceable integration by name, select Configuration, and in the Danger Zone section select Suspend. Traceable data will no longer be displayed on entity pages or in the catalog while the integration is suspended. You can reactivate it at any time by returning to this page.
Frequently asked questions
Last updated
Was this helpful?