> For the complete documentation index, see [llms.txt](https://developer.harness.io/llms.txt). Markdown versions of documentation pages are available by appending `.md` to page URLs; this page is available as [Markdown](https://developer.harness.io/internal-developer-portal/use-idp/software-catalog/create-entity/entity-details.md).
# Entity Details Page
Learn about the Entity Details page in Harness IDP and how to use it to explore service health, metadata, relationships, and integrations.
An entity in Harness IDP is any software component, service, API, resource, or team that has been registered in the [Catalog](/internal-developer-portal/use-idp/software-catalog/manage-catalog.md). Each entity is described by a YAML definition that captures its metadata, ownership, lifecycle, and relationships. Clicking an entity opens a comprehensive view of that entity.
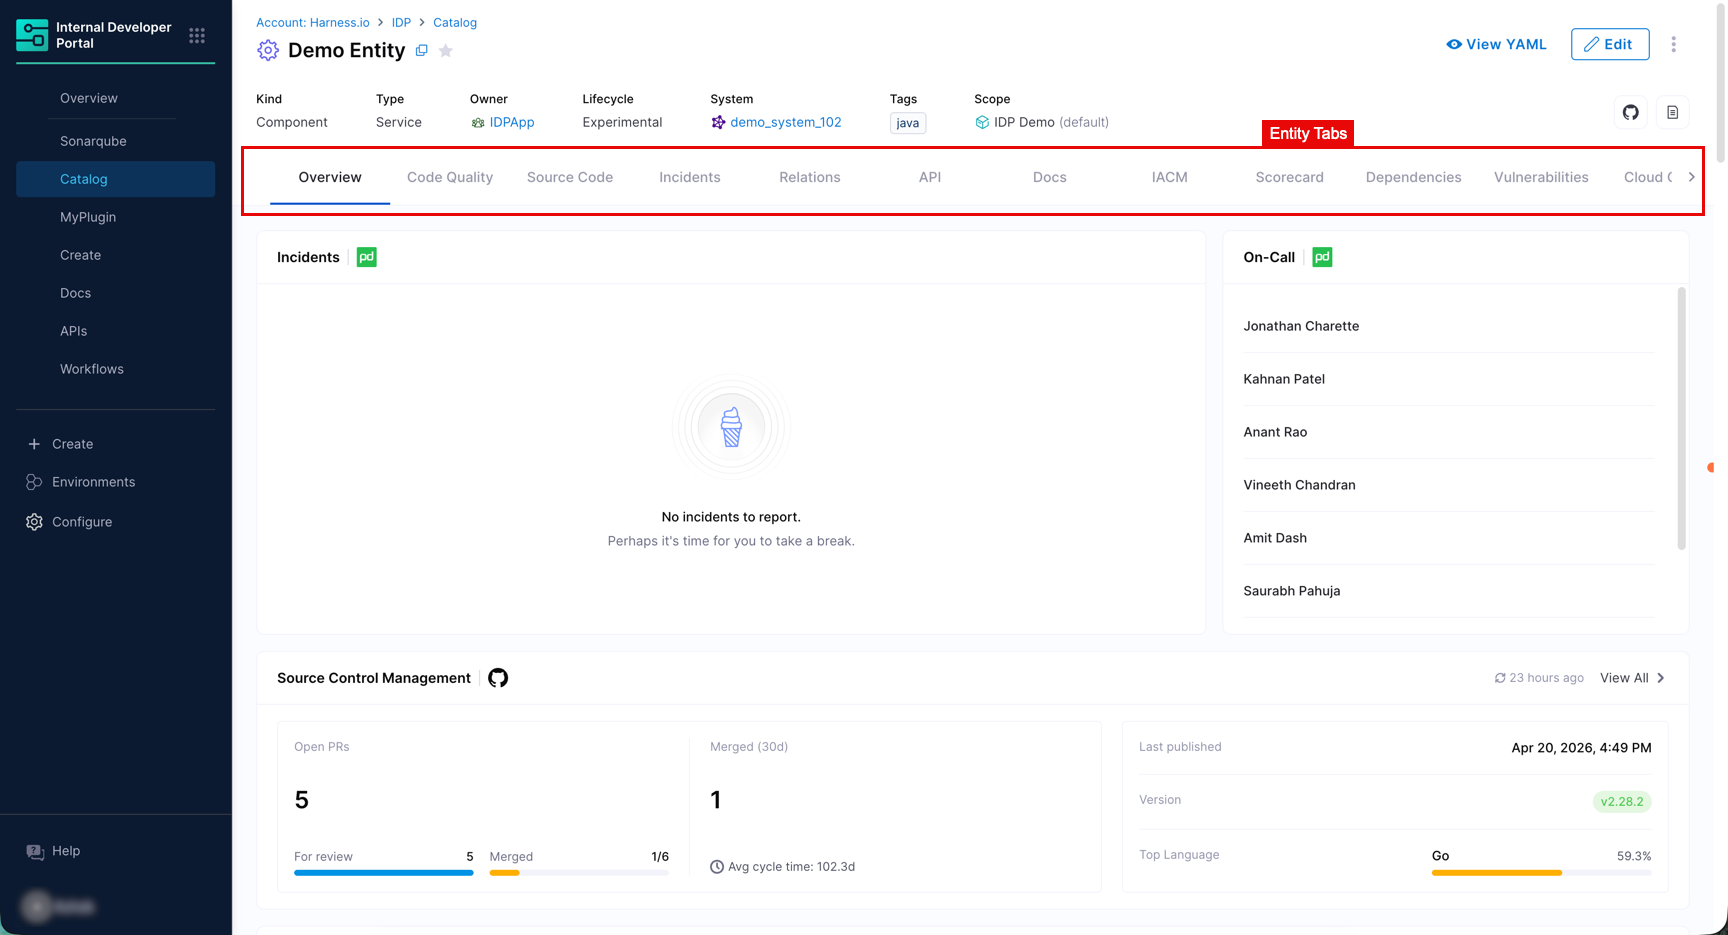
Every entity details page has a [header](#entity-header) along with several [tabs](#tabs-available-in-entity-details) beneath it, each displaying a focused set of information from a specific domain or integration such as SonarQube, GitHub, PagerDuty, Harness CD, and many more.
***
### Entity header
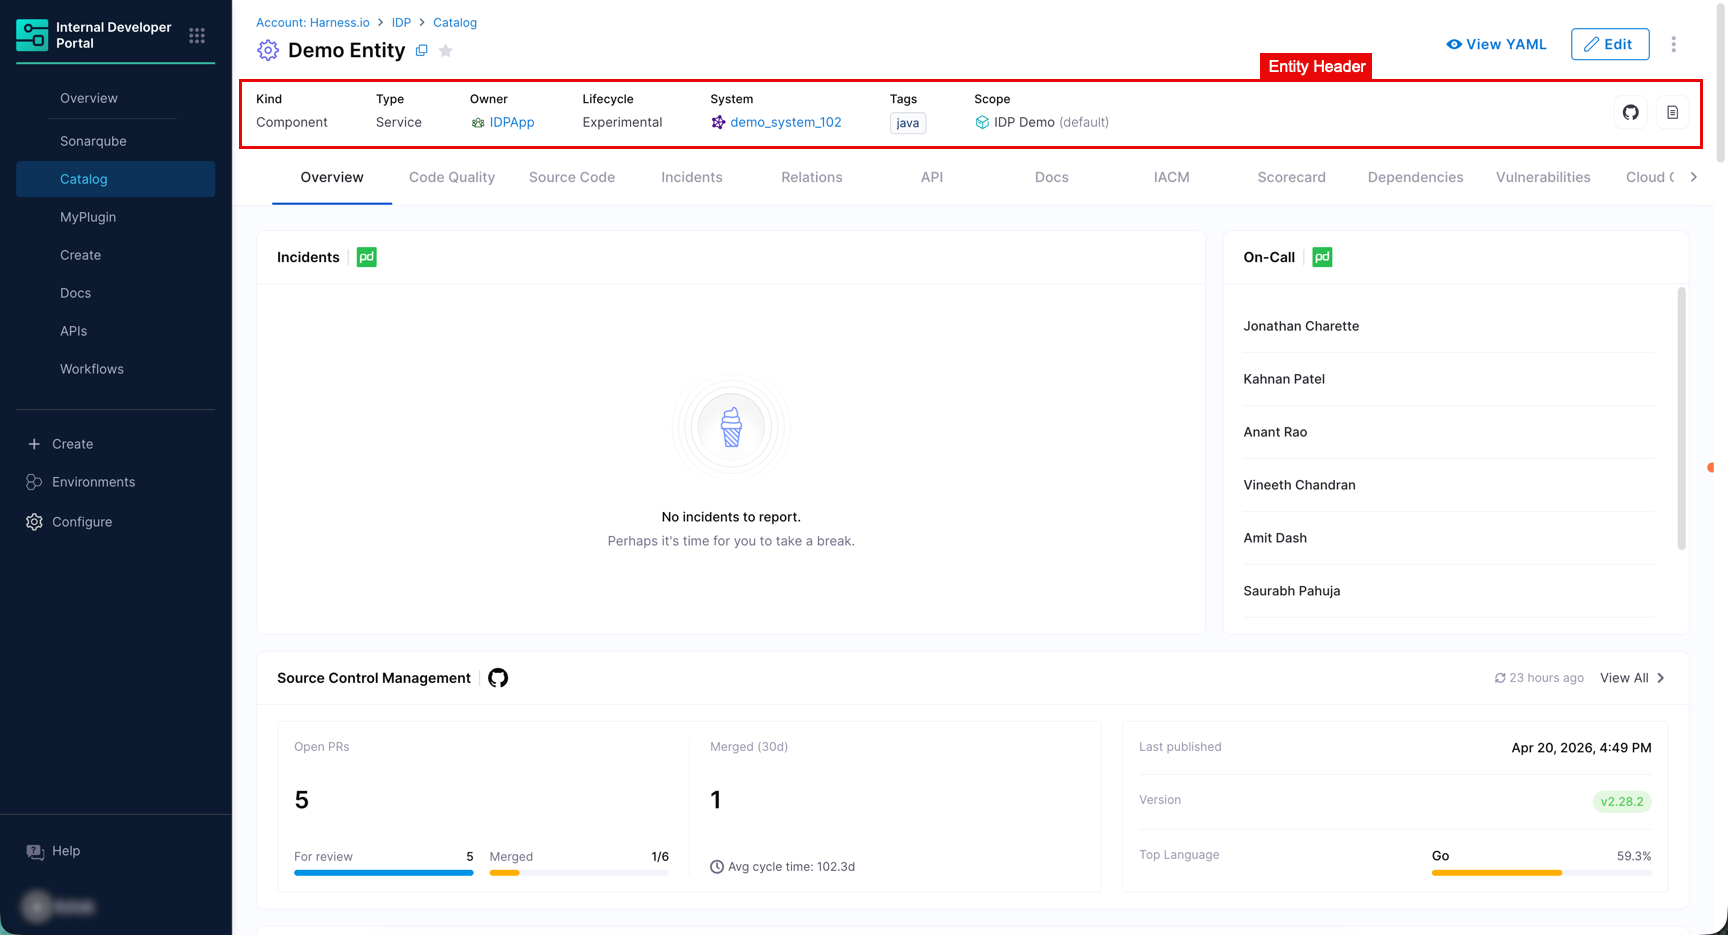
The entity header appears at the top of every entity page. In IDP, core identity and classification fields are in the header so they are always visible regardless of which [tab](#tabs-available-in-entity-details) you are on.
| Field | Description |
| --------------------- | ------------------------------------------------------------------------------------- |
| **Kind** | The entity kind, for example `Component`, `API`, `Resource`. |
| **Type** | The entity type within its kind, for example `service`, `library`, `website`. |
| **Owner** | The user or group responsible for this entity. |
| **Lifecycle** | The maturity stage, for example `production`, `experimental`, `deprecated`. |
| **System** | The system this entity belongs to. |
| **Scope** | The Harness account or org scope. |
| **Branch** | The Git branch associated with this entity, if applicable. |
| **Git Source** (icon) | Opens the entity's Git repository directly. Shown as a GitHub (or relevant SCM) icon. |
| **TechDocs** (icon) | Opens the entity's TechDocs site, if enabled. Shown as a document icon. |
The header also provides the following actions in the top-right corner:
| Action | Description |
| ------------------ | ---------------------------------------------------------------------------------------------------------------------------------------------------------------------------------------------------------------------------------- |
| **View YAML** | Opens the [Entity Inspector](https://developer.harness.io/internal-developer-portal/use-idp/software-catalog/create-entity/pages/Wnh2PrpJGdrUuNZxSdo7#idp2.0--entity-inspector) to review raw YAML, JSON, and ingested properties. |
| **Edit** | Opens the entity edit view in either the Visual or YAML editor. |
| **Three-dot menu** | Additional options including **Delete** (for deleting the entity) and **Copy URL**. |
***
### Tabs available in entity details
{% hint style="info" %}
**VISIBILITY OF TABS DEPENDS ON YOUR LAYOUT**
The tabs visible on an entity page depend on the [layout configured](#configure-tabs-and-layout) for that entity's kind and type, as well as which integrations are configured for your account.
{% endhint %}
#### Overview tab
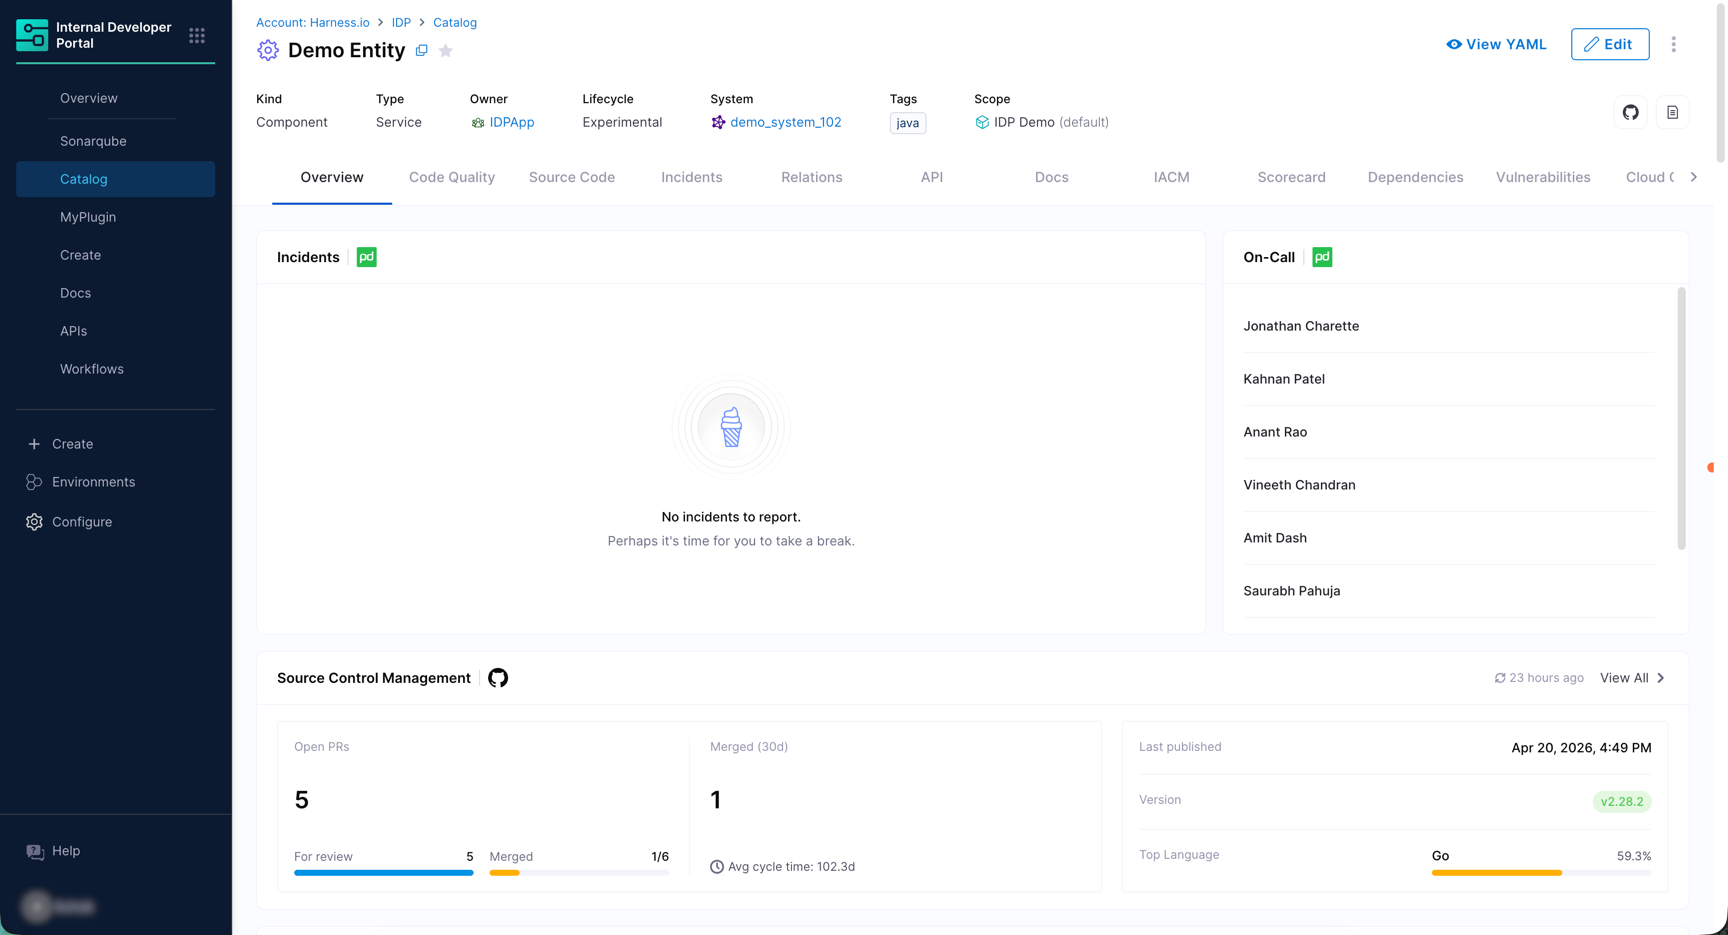
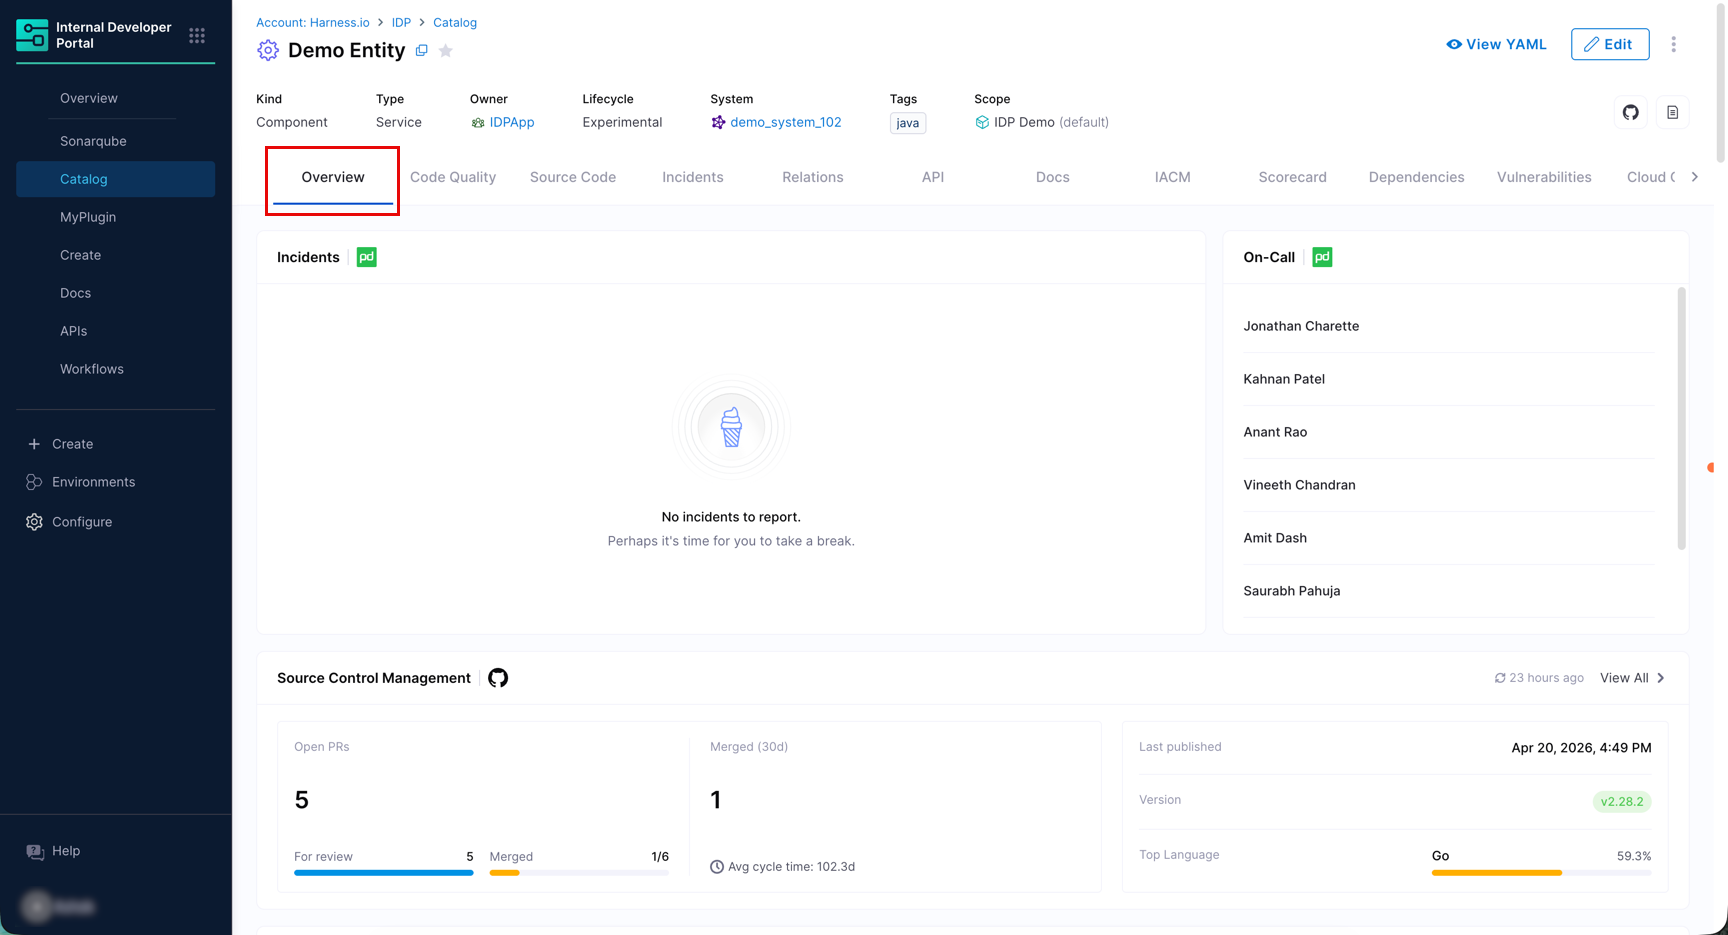
The **Overview** tab is the default landing view for every entity. It is designed as a health dashboard that aggregates the most important signals onto a single page. You can:
* Review ownership, lifecycle, relationships, and scorecard results
* See who is on-call right now via PagerDuty and monitor active incidents
* Review code quality metrics from SonarQube and check the quality gate status
* Track open pull requests and merge activity from GitHub
* Measure DORA performance benchmarks
The `IntegrationsContent` card includes the following signals:
| Signal | Description |
| ----------------------------- | ------------------------------------------------------------------------------------------------------------------------------------------------------------------------------------------------------------------------------------------------------------------------------------------------------------------------------------------------------------------------------------------------------------------------------------------- |
| **Incidents** | Shows active incidents linked to this entity from connected [PagerDuty](/internal-developer-portal/use-idp/software-catalog/create-entity/catalog-discovery/integrations/pagerduty.md) integration. Resolved incidents are not shown in this summary, so navigate to the dedicated [Incidents tab](#incidents-tab) for a full list. |
| **On-Call** | The current on-call schedule from the [PagerDuty](/internal-developer-portal/use-idp/software-catalog/create-entity/catalog-discovery/integrations/pagerduty.md) integration, showing who is responsible for responding to incidents right now. |
| **Source Control Management** | A summary of SCM activity from the connected [GitHub](/internal-developer-portal/use-idp/software-catalog/create-entity/catalog-discovery/integrations/github.md) integration, including open PR count, merged PRs, and average cycle time. PR data covers the last 30 days. The Top Language field shows a single primary language only, not a multi-language breakdown. |
| **Code Quality** | A summary of code quality metrics from the connected [SonarQube](/internal-developer-portal/use-idp/software-catalog/create-entity/catalog-discovery/integrations/sonarqube.md) integration, including Reliability Rating, Security Rating, SQALE (Maintainability) Rating, Coverage percentage, and Technical Debt. A quality gate badge shows passed or failed status. |
| **Scorecard** | A summary of the entity's scorecard results, including overall score. Go to [Scorecards](/internal-developer-portal/use-idp/scorecards/scorecard.md) to view details. |
| **DORA** | The four DORA metrics that measure software delivery performance: Deploy Frequency, Lead Time for Changes, Change Failure Rate, and Failed Deploy Recovery. Ratings are shown as Good, Fair, or Poor based on DORA benchmark thresholds. Rendered from ingested YAML properties available through [Harness CD](/internal-developer-portal/use-idp/software-catalog/create-entity/catalog-discovery/integrations/harness-cd.md) integration. |
Instead of requiring you to add and configure individual cards for every integration signal, the `IntegrationsContent` card bundles all integration-sourced data into a single card:
```yaml
page:
name: EntityLayout
tabs:
- name: Overview
path: /
title: Overview
contents:
- component: IntegrationsContent
specs:
gridProps:
md: 12 # Use md: 6 for half width
(...add your remaining components)
```
If you are unable to view Integrations data in your **Overview** page, you may add it as shown in the video below:
{% embed url="" %}
If an integration is not yet set up, the relevant section may show a **Not configured** message with a link to configure it. Sections with active integrations continue to display data normally.
Each section also shows the timestamp when its data was last refreshed, so you always know how current the information is.
{% hint style="info" %}
**INTEGRATION CONTENT CARD LAYOUT IS FIXED**
Currently, the arrangement of data within the `IntegrationsContent` card cannot be reordered or customized. You can control only the card size (for example, full width or half width) via the [Layout editor](#configure-tabs-and-layout).
{% endhint %}
***
#### Code quality tab
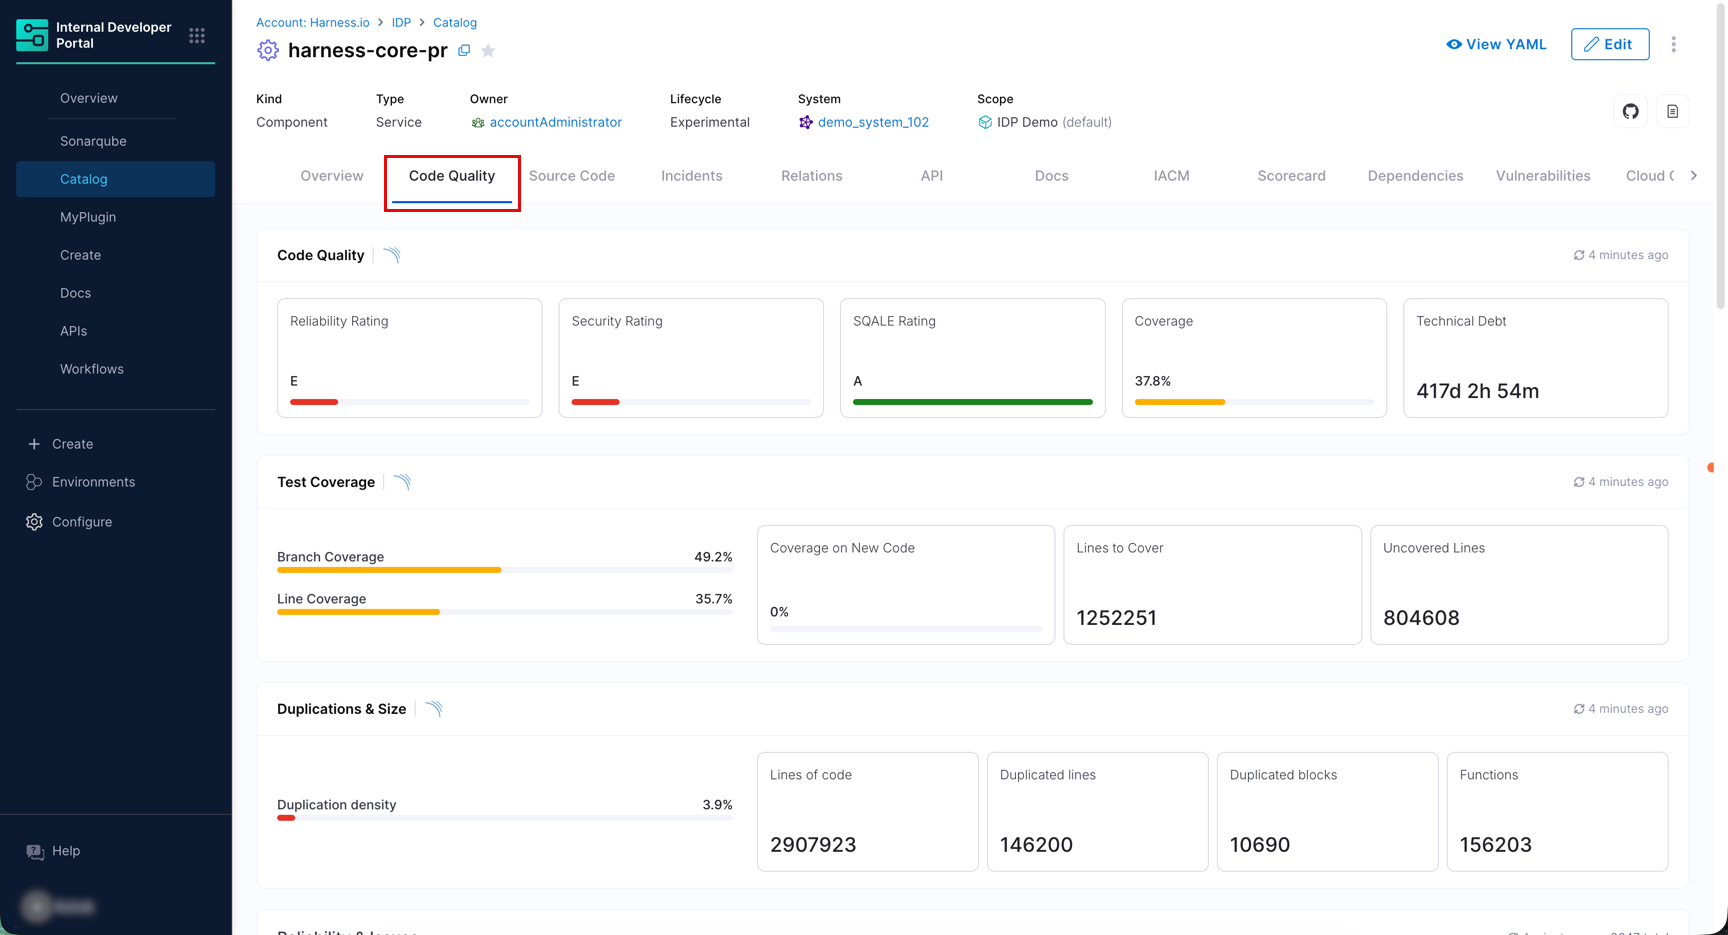
The **Code Quality** tab provides a full, paginated view of code quality data from the connected [SonarQube](/internal-developer-portal/use-idp/software-catalog/create-entity/catalog-discovery/integrations/sonarqube.md) integration. It shows everything in the Overview summary, plus:
* Full issues list (bugs, code smells, vulnerabilities) with pagination
* Security hotspots
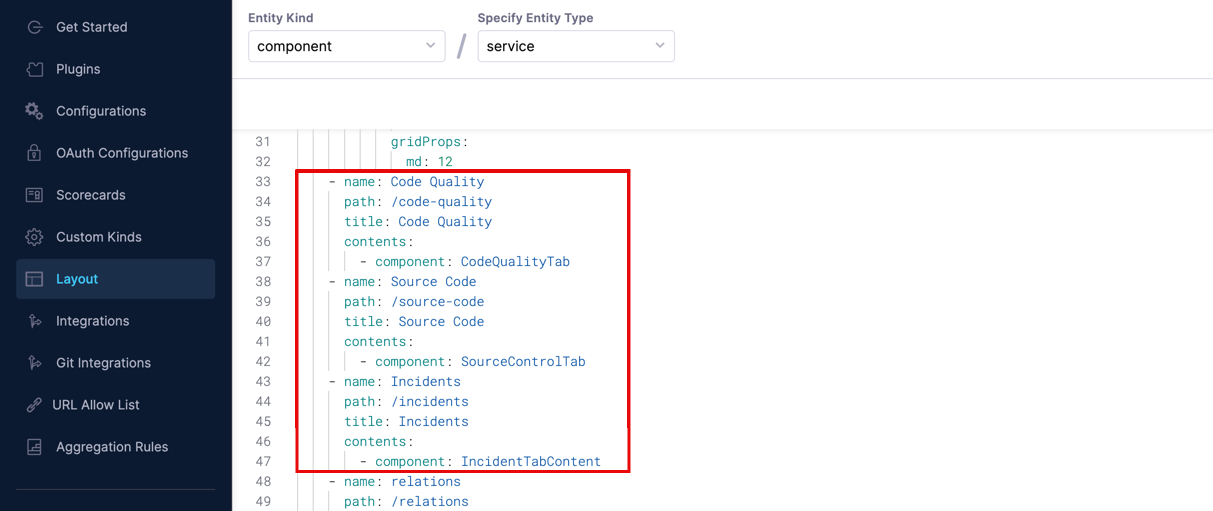
**VISIBILITY OF TABS**The [Code Quality tab](#code-quality-tab), [Source Code tab](#source-code-tab), [Incidents tab](#incidents-tab) may not be present in the layout by default. You can explicitly add them via the [Layout editor](#configure-tabs-and-layout) for the relevant entity kind and type. Here are the respective component names:
* `CodeQualityTab`
* `SourceControlTab`
* `IncidentTabContent`
#### Source code tab
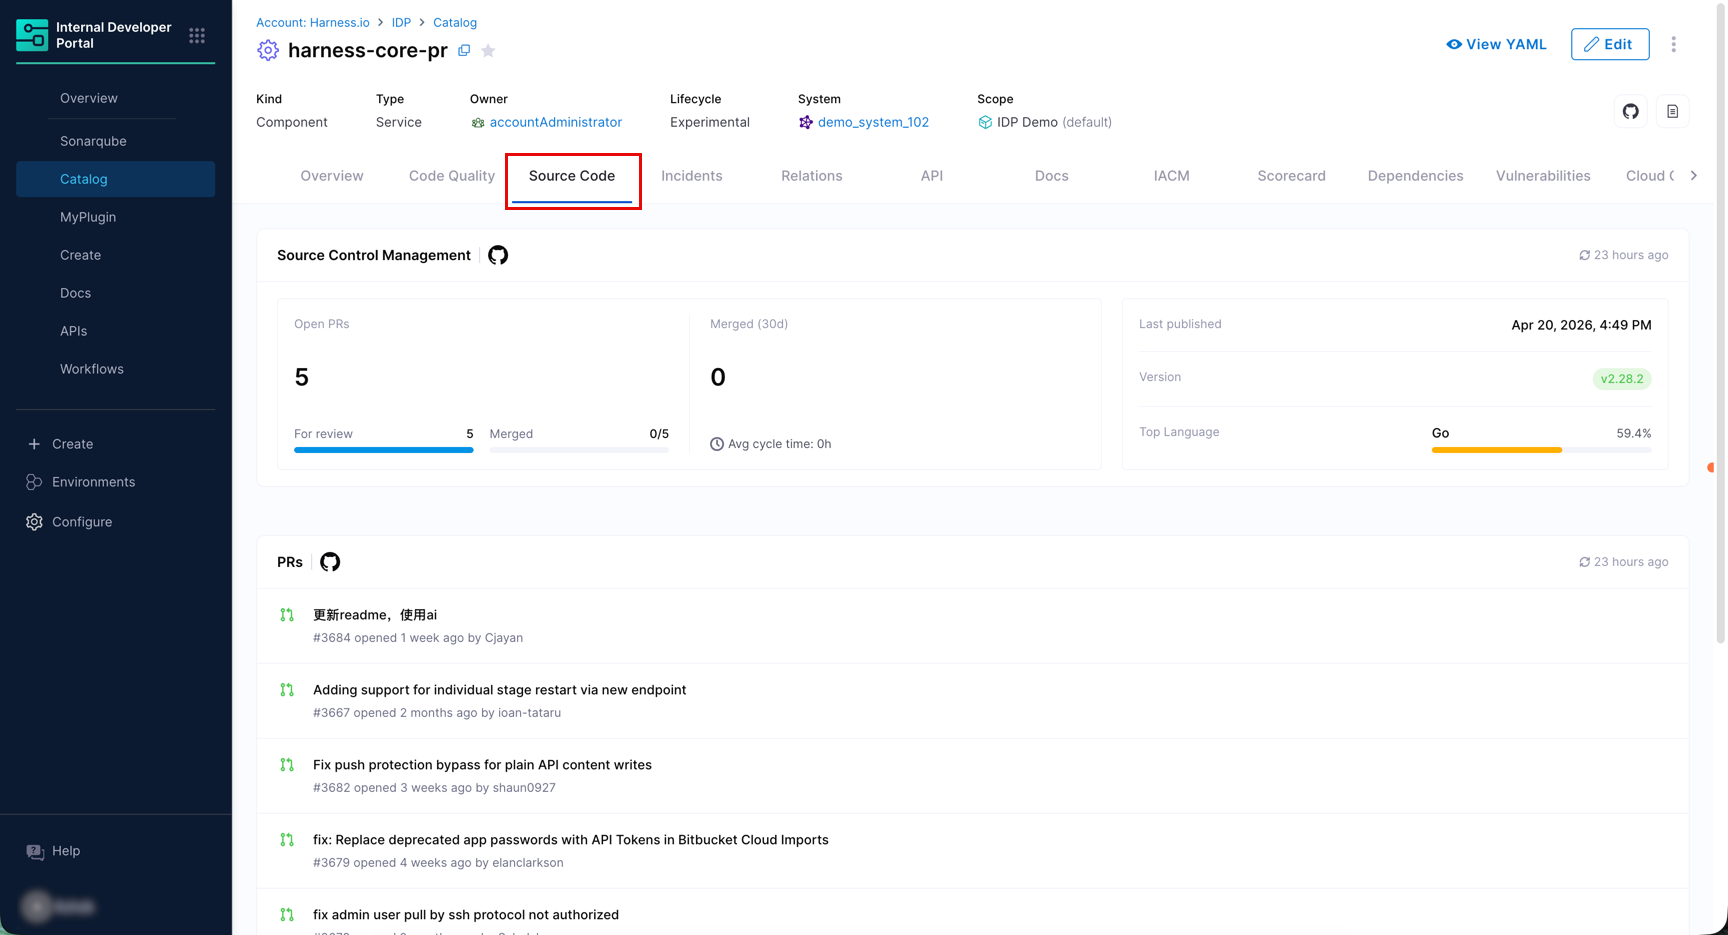
The **Source Code** tab provides a full view of source control activity from connected SCM integrations such as [GitHub](/internal-developer-portal/use-idp/software-catalog/create-entity/catalog-discovery/integrations/github.md), [Bitbucket Cloud](/internal-developer-portal/use-idp/software-catalog/create-entity/catalog-discovery/integrations/bitbucket-cloud.md), or both. It shows the same pull request summary as the Integration Content card, plus a detailed, paginated list of individual pull requests.
Key details:
* PR data covers the last 30 days.
* **Top Language** shows a single primary language only.
{% hint style="info" %}
**PULL REQUEST LIST REQUIRES SECONDARY KIND TO BE ENABLED**
The pull request list on this tab is only populated if **Pull Requests** is selected as a secondary kind in your [GitHub](/internal-developer-portal/use-idp/software-catalog/create-entity/catalog-discovery/integrations/github.md) or [Bitbucket Cloud](/internal-developer-portal/use-idp/software-catalog/create-entity/catalog-discovery/integrations/bitbucket-cloud.md) integration. If Pull Requests was not enabled during integration setup, this tab will not show any PR data.
{% endhint %}
#### Incidents tab
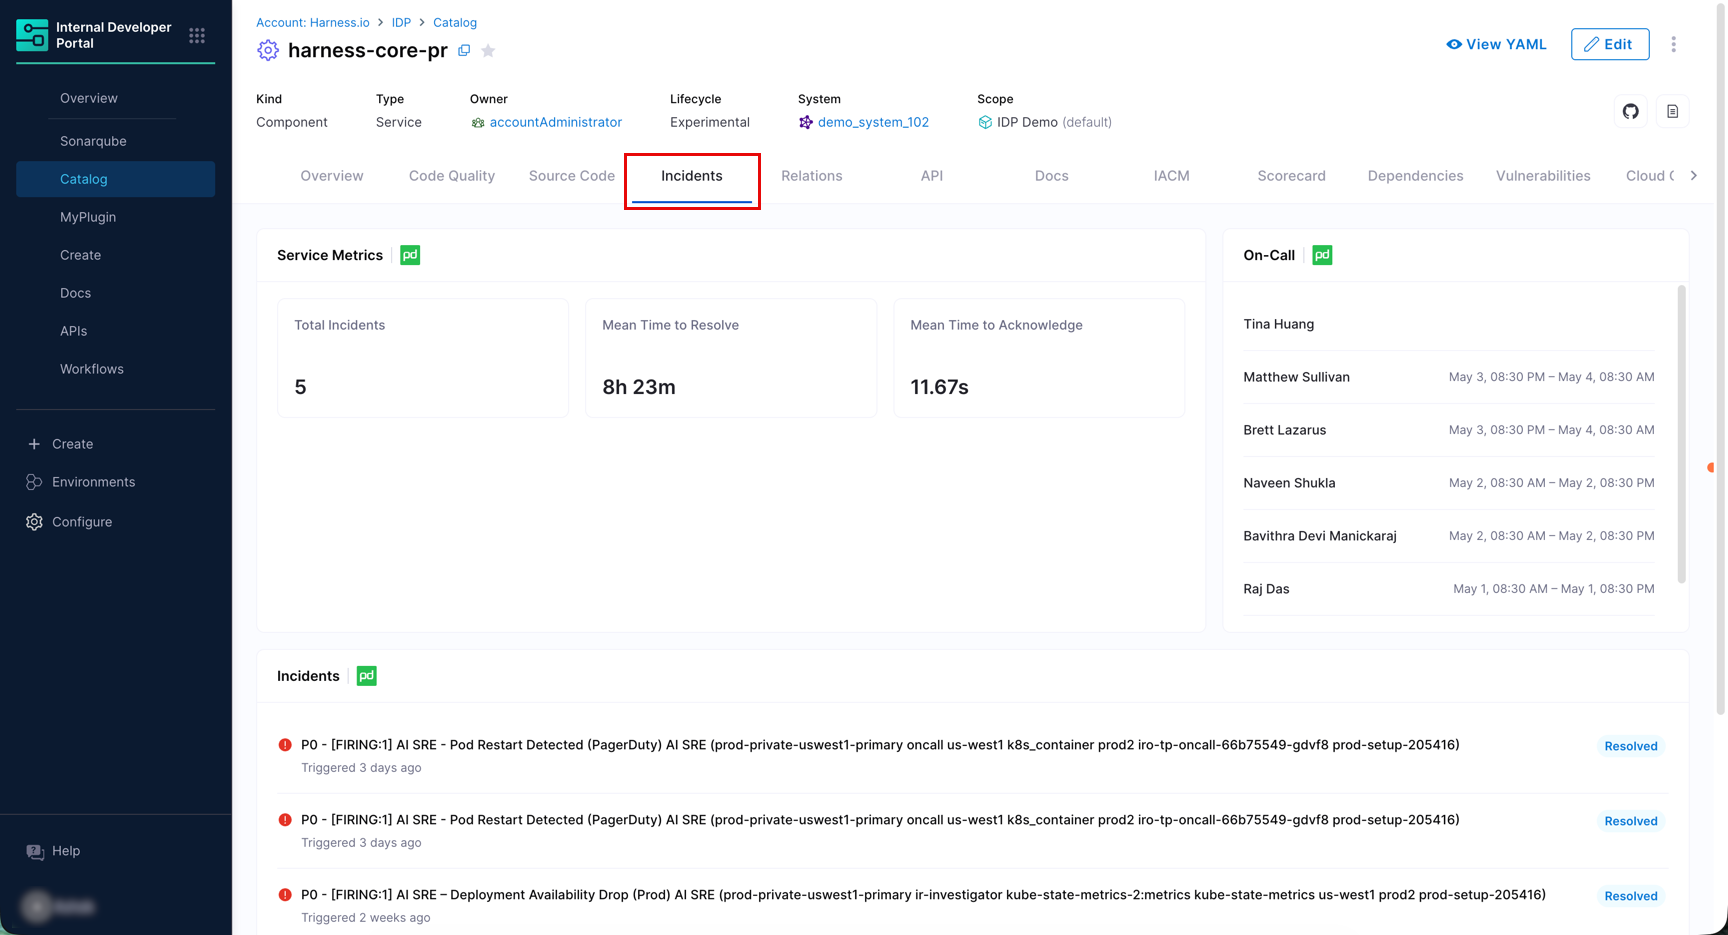
The **Incidents** tab provides a full view of incident data for this entity from [PagerDuty](/internal-developer-portal/use-idp/software-catalog/create-entity/catalog-discovery/integrations/pagerduty.md). An incident is an alert or event that indicates something may be wrong with the service, for example, a spike in error rate or a failed health check. This tab is distinct from the Integration Content card on the [Overview tab](#overview-tab), which shows only active incidents. The Incidents tab includes:
* A list of both active and resolved incidents.
* On-call persons with their schedule, showing when each user is on-call for this entity. For permanently on-call individuals, no schedule is shown.
* Service metrics from PagerDuty, including total incident count and mean time to resolve (MTTR).
***
#### Other tabs
Here are a few examples of the tabs available for a specific kind and type. If required, you may explicitly add them or remove them via the [Layout editor](#configure-tabs-and-layout) for your relevant entity kind and type.
| Tab | Description |
| ----------------- | ---------------------------------------------------------------------------------------------------------------------------------------------------------------------------------------------------------------------------------------------------------------------------------------------------------------------------------------------------------------- |
| **Relations** | Full interactive relationship graph showing all `dependsOn`, `partOf`, `ownedBy`, and `hasPart` links to other catalog entities. |
| **API** | API definitions the entity provides or consumes, as defined by `providesApis` and `consumesApis` in the entity YAML. Renders OpenAPI, AsyncAPI, GraphQL, and gRPC specs inline. |
| **Docs** | TechDocs site for this entity, generated from Markdown files stored in Git. Go to [Enable Docs](/internal-developer-portal/use-idp/software-catalog/integrate-tools/techdocs/enable-docs.md). |
| **IACM** | Harness IACM workspace data including state, resource counts, and recent runs. |
| **Scorecard** | Full scorecard report across all configured scorecards, including overall score, tier, and per-check pass/fail breakdown. The **Tier** sub-tab lists every tier in the scorecard's [tier group](/internal-developer-portal/use-idp/scorecards/create-scorecards/tier-groups.md). Go to [Scorecards](/internal-developer-portal/use-idp/scorecards/scorecard.md). |
| **Dependencies** | Package-level dependency graph. Distinct from the catalog-level Relations tab. |
| **Cloud Costs** | Cloud cost data from Harness CCM including spend trends and anomaly alerts. |
| **Custom Plugin** | Custom frontend plugin tabs that can display any data relevant to your organization. Go to [Custom Plugins](/internal-developer-portal/use-idp/plugins/custom-plugins/overview.md). |
| **HarnessCICD** | Pipeline run history from Harness CI and Harness CD, including run status, trigger type, and environment. Requires the Harness pipeline annotation on the entity. |
***
### Configure tabs and layout
The tabs and cards shown on an entity details page are controlled by the [Layout configuration](/internal-developer-portal/admin-and-customization/layout-and-appearance/catalog.md) for that entity's kind and type. You can add, remove, reorder, and resize cards and tabs using the Layout editor.
To access the Layout editor:
1. In Harness, open **Internal Developer Portal**.
2. From the left sidebar, click **Configure**.
3. Click **Layout**.
4. Select the layout for the entity kind and type you want to modify, or create a new layout.
When you create a new layout type, it comes pre-filled with a default set of cards and tabs as a starting point.
***
### Frequently asked questions Why is my integration data not showing on the Overview tab?
The Integration Content card only shows data for integrations that are configured for your account and linked to the entity. If a section shows **Not configured**, navigate to **Configure** → **Integrations** and set up the relevant integration. Once configured, the data will appear after the next sync.
If the integration is configured but data is still missing, check the **last synced** timestamp on the card. If it has not synced recently, go to the integration page and trigger a manual sync.
I added a tab in the Layout editor but it is not showing up on the entity page. Why?
Two things to check:
1. **Layout scope**: Make sure you added the tab to the correct layout for the entity's **Kind** and **Type**. A tab added to `Component/service` will not appear on a `Component/library` entity.
2. **Integration not configured**: If the tab relies on an integration (for example, the Incidents tab needs PagerDuty), the tab may render empty or not appear if that integration is not configured. Set up the integration first, then revisit the layout.
Can I reorder the data inside the Integration Content card?
Not currently. The arrangement of signals within the Integration Content card (Incidents, On-Call, Source Control, Code Quality, Scorecard, DORA) is fixed and managed by Harness. You can only control the overall card size (full width or half width) in the Layout editor. The ability to reorder signals inside the card is planned for a future release.
The Overview tab shows only active incidents. Where do I see the rest?
The Integration Content card on the **Overview** tab intentionally shows you active incidents only to keep the dashboard focused on actionable and insightful items. To see the full incident history including resolved incidents, open the [Incidents tab](#incidents-tab).
My entity is connected to two SonarQube instances but only one shows up. Why?
The Integration Content card currently shows data from one integration per signal type per entity. If your entity is linked to more than one SonarQube instance, only one integration's data is displayed. A future release will add a dropdown to switch between multiple integrations of the same type on the same entity.
The Code Quality / Source Code / Incidents tab is not visible on my entity. How do I add it?
These three tabs are **not included in the default layout**. You need to add them manually:
1. Go to **Configure** → **Layout**.
2. Select the layout for your entity's kind and type.
3. Add the relevant tab (Code Quality, Source Code, or Incidents) to the layout ([as shown here](#code-quality-tab))
4. Save the layout. The tab will now appear for all entities of that kind and type.
The Source Control section shows only one language and calls it Top Language. Is it accurate?
The **Top Language** field shows the single most-used language in the repo by file share percentage. It reflects the primary language at the time of the last GitHub sync, not the language you might consider as "main". If the value looks unexpected, it may be because generated files, config files, or vendored dependencies are skewing the count on the GitHub side.
Why does the Entity Inspector show data I did not add to the entity YAML?
The [Entity Inspector](https://developer.harness.io/internal-developer-portal/use-idp/software-catalog/create-entity/pages/Wnh2PrpJGdrUuNZxSdo7#idp2.0--entity-inspector) shows two types of data: the entity YAML you authored, and **ingested properties** pulled in automatically from connected integrations. For example, if your entity is linked to GitHub via the GitHub integration, repository metadata like team associations and repository URL are automatically stored under `integration_properties.GitHub`. This data is read-only and managed by the integration sync.
{% @harness-feedback/feedback %}