> For the complete documentation index, see [llms.txt](https://developer.harness.io/llms.txt). Markdown versions of documentation pages are available by appending `.md` to page URLs; this page is available as [Markdown](https://developer.harness.io/resilience-testing/3.0/shared-capabilities/custom-dashboards.md).

# Dashboards

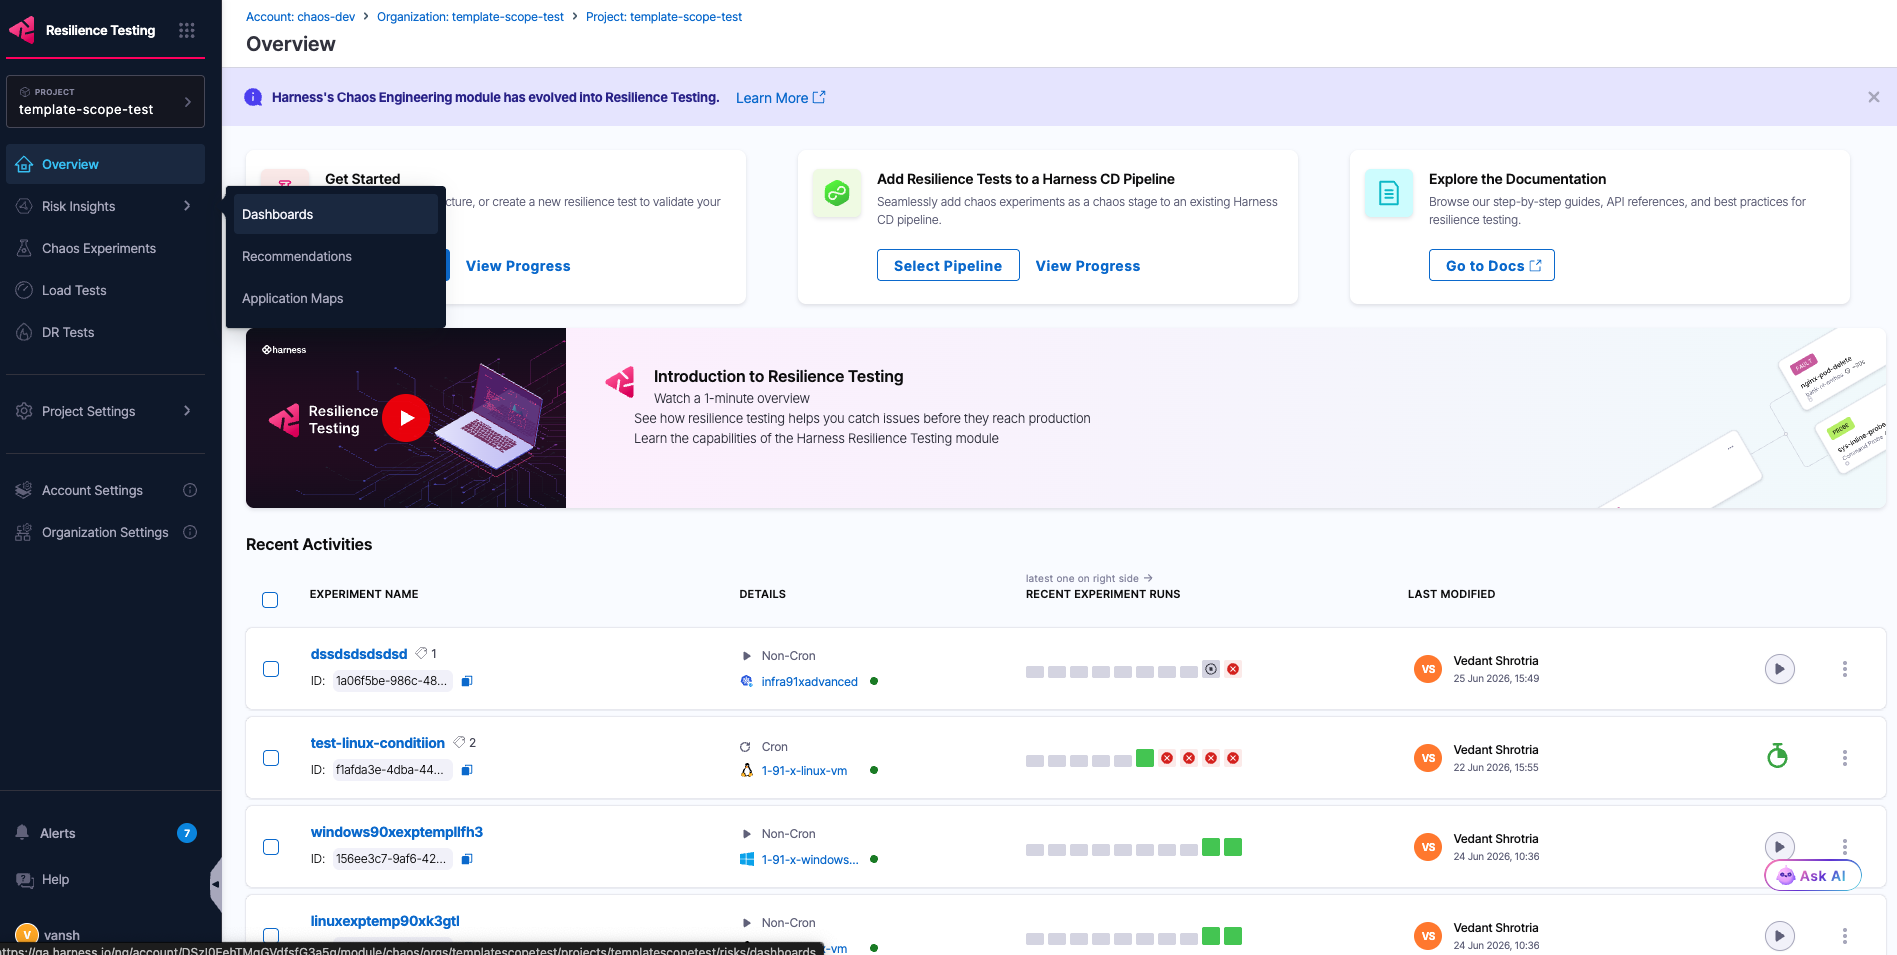
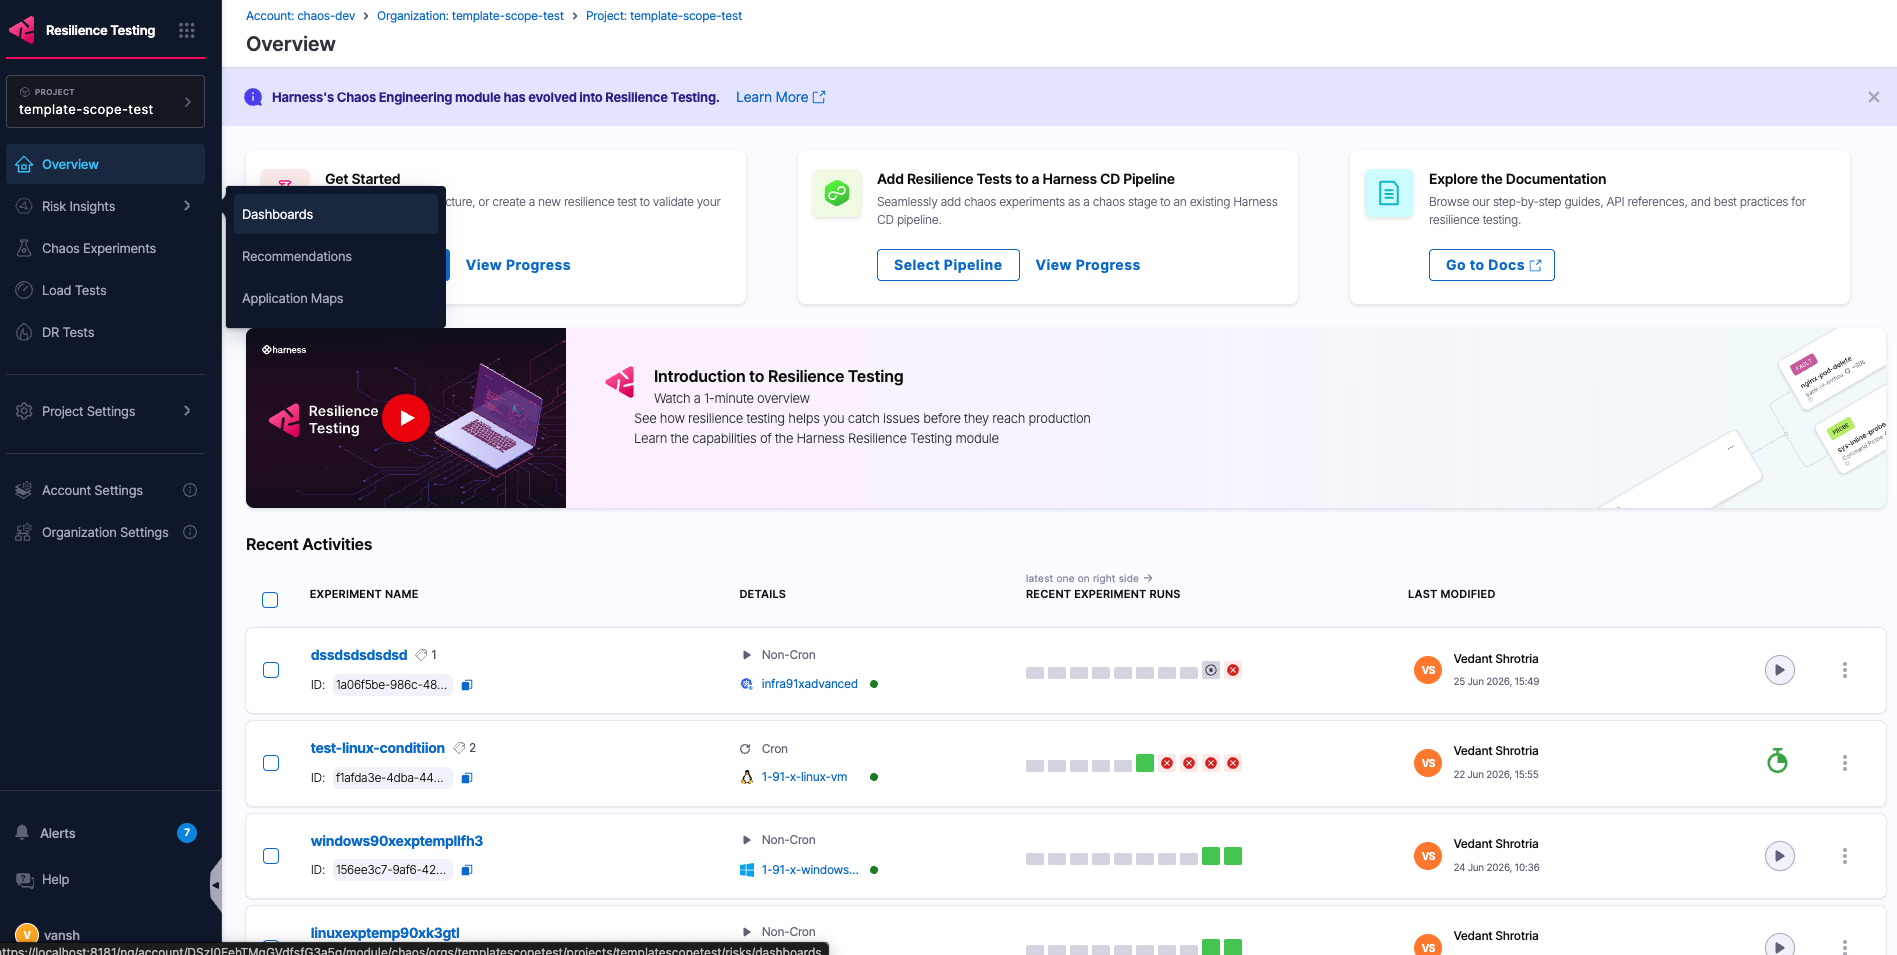
The Resilience Testing (RT) module provides dashboards that visualize key metrics from your chaos testing operations. You access them under the **Dashboards** section of the **Insights** left navigation.

The module ships with out-of-the-box (OOTB) dashboards for a high-level view of chaos testing across an account, and you can also build your own custom dashboards from Harness Unified Data Platform (UDP) queries.

<figure><img src="/files/diq9Wwx2SD8wzoh3sgqN" alt="The Dashboards item under the Insights section of the Resilience Testing left navigation"><figcaption><p>Click to view full size</p></figcaption></figure>

*The Dashboards item under Insights in the Resilience Testing module.*

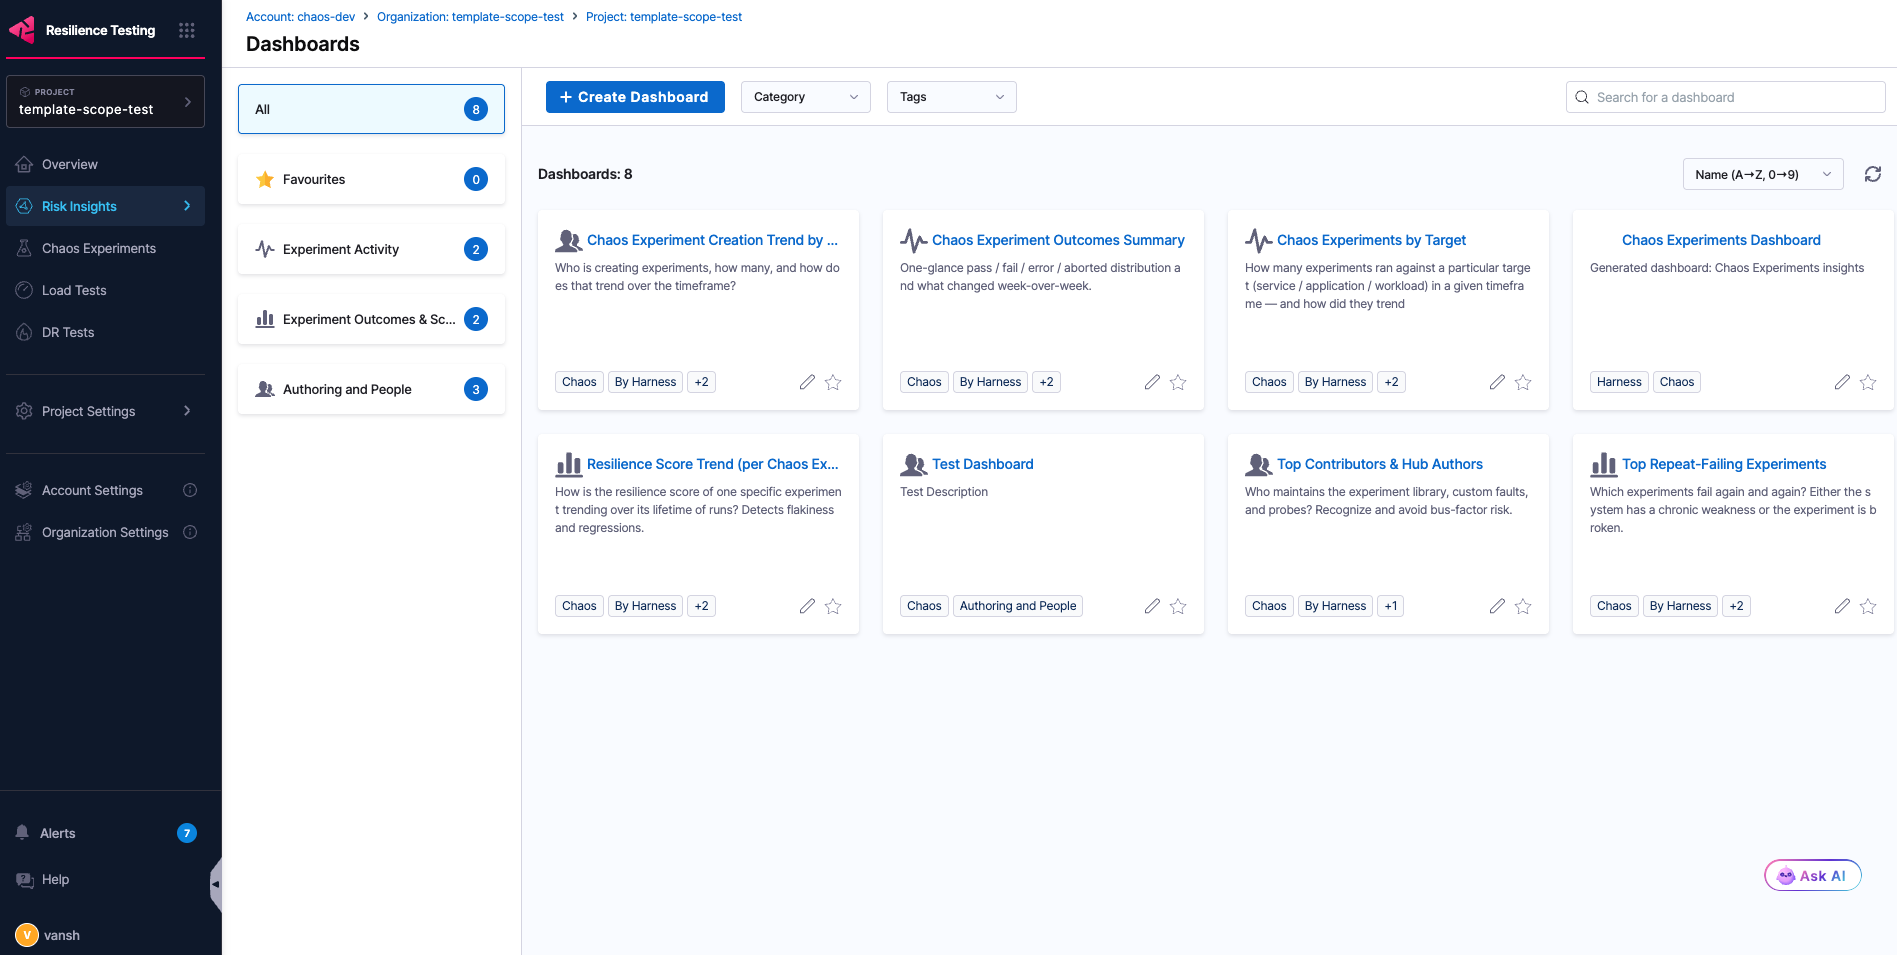
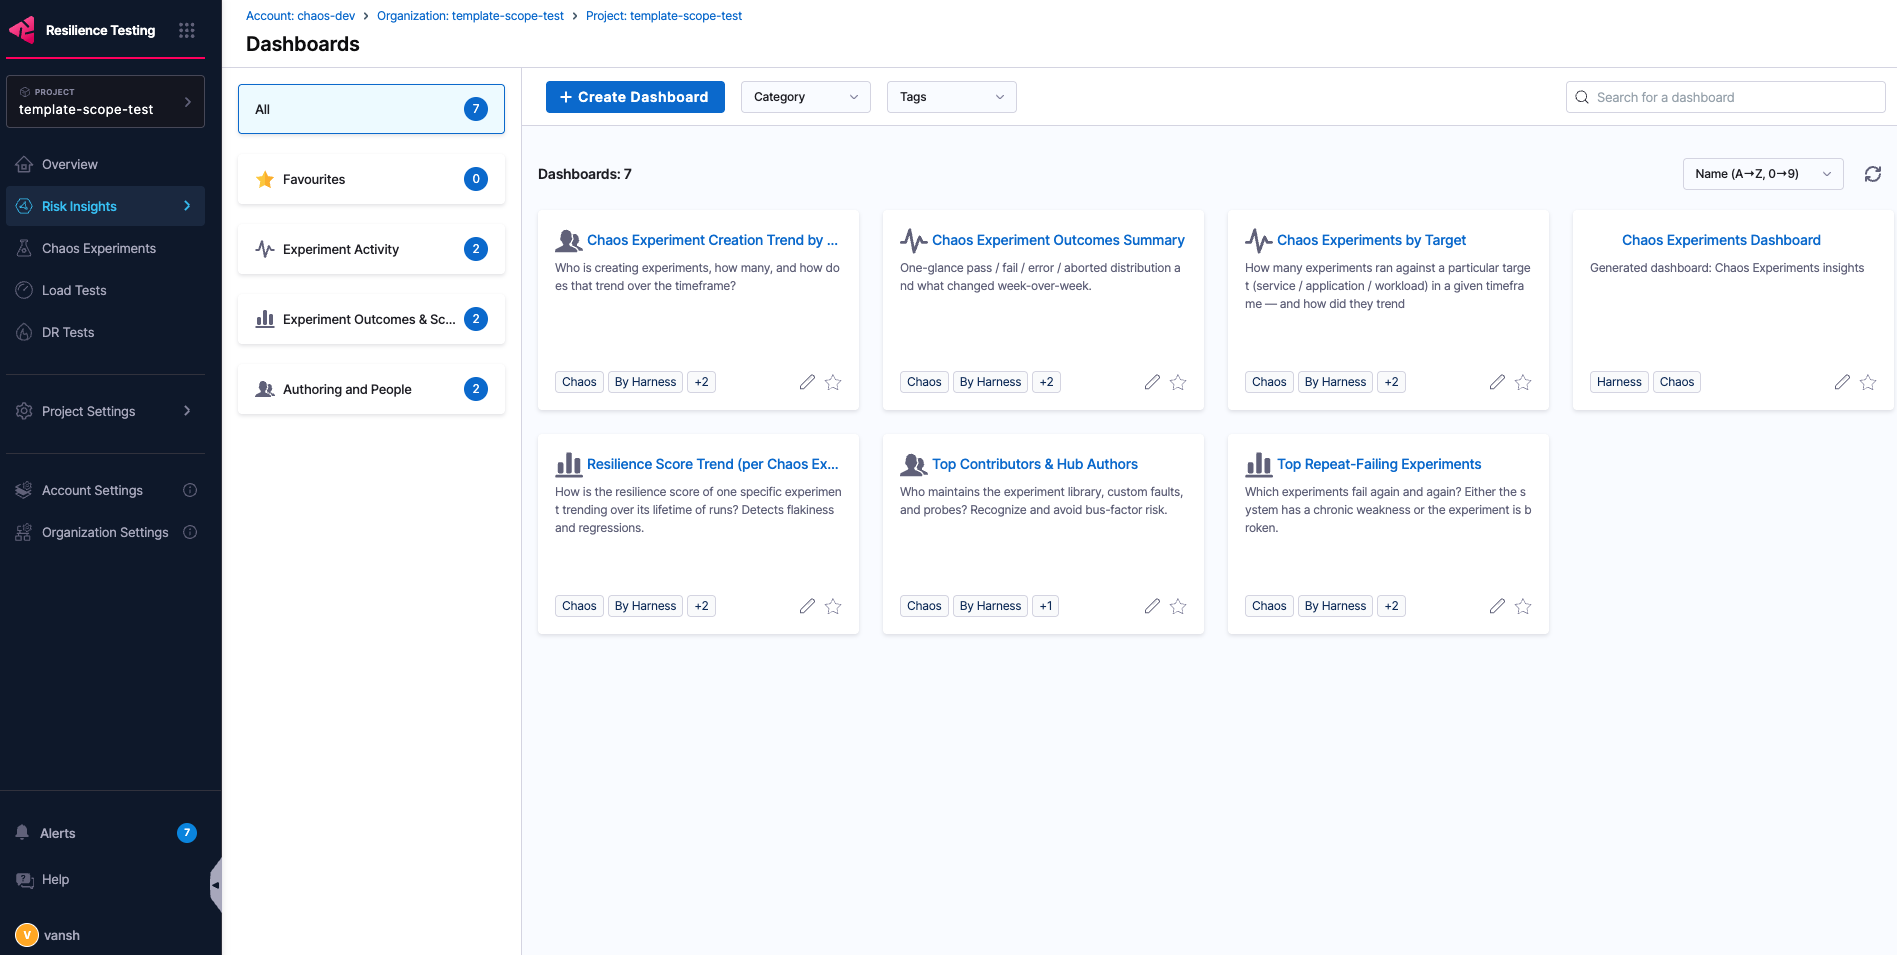
Selecting **Dashboards** opens the dashboards landing page.

<figure><img src="/files/exs165sv1SUXtAGwWTY4" alt="The Dashboards landing page in the Resilience Testing module"><figcaption><p>Click to view full size</p></figcaption></figure>

***

### Out-of-the-box dashboards <a href="#out-of-the-box-dashboards" id="out-of-the-box-dashboards"></a>

The OOTB dashboards fall under three categories:

* **Experiment Activity**
* **Experiment Outcomes & Scores**
* **Authoring & People**

The following dashboards ship out of the box:

| Dashboard                                         | Category                     | Key widgets                                                                                                                                                                                                                                                                           |
| ------------------------------------------------- | ---------------------------- | ------------------------------------------------------------------------------------------------------------------------------------------------------------------------------------------------------------------------------------------------------------------------------------- |
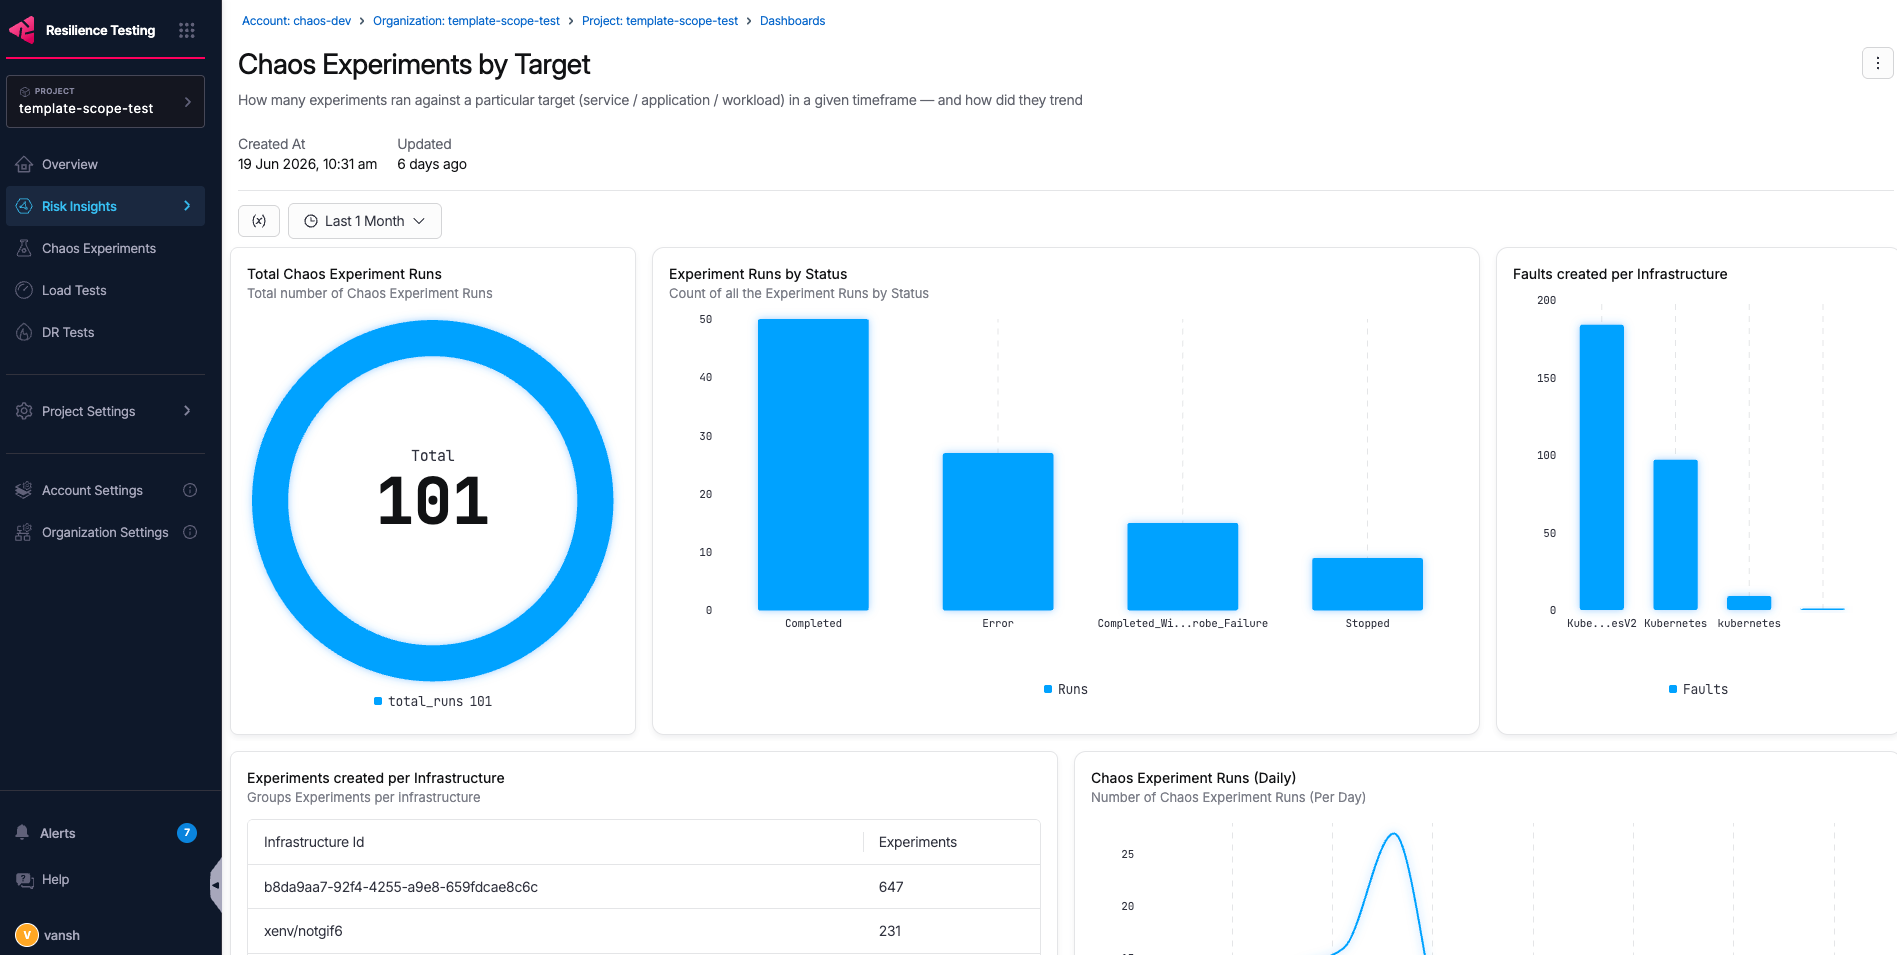
| **Chaos Experiments by Target**                   | Experiment Activity          | Total Chaos Experiment Runs, Experiment Runs by Status, Faults created per Infrastructure, Experiments created per Infrastructure, Chaos Experiment Runs (Daily/Weekly), Experiment Runs per Chaos Experiment, Average & Median Resilience score, Chaos Experiment Runs (Project/Org) |
| **Chaos Experiment Outcomes Summary**             | Experiment Activity          | Total Chaos Experiment Runs, Chaos Experiment Outcome Distribution, Weekly Chaos Experiment Run Trend, Chaos Experiment Run Outcomes (Project/Org/Infrastructure)                                                                                                                     |
| **Resilience Score Trend (per Chaos Experiment)** | Experiment Outcomes & Scores | Chaos Experiment Run trend, Latest Run (Per Experiment), Chaos Experiment Pass Rate, Experiment Resilience score variance                                                                                                                                                             |
| **Top Repeat-Failing Experiments**                | Experiment Outcomes & Scores | Repeat-failing experiments, Repeat failing experiments (User)                                                                                                                                                                                                                         |
| **Chaos Experiment Creation Trend by User**       | Authoring & People           | Chaos Experiments created by users, Experiment creation per user (weekly), Chaos experiment creation (new users), Chaos Experiment Runs Creation (User)                                                                                                                               |
| **Top Contributors & Hub Authors**                | Authoring & People           | Top Actions Contributors, Top Probe contributors, Top Hub contributors, Top Probe creation by Probe type                                                                                                                                                                              |

The following is an example OOTB dashboard:

<figure><img src="/files/dmxqL5RVoeEltfBVGIDU" alt="An example out-of-the-box dashboard showing chaos experiment metrics"><figcaption><p>Click to view full size</p></figcaption></figure>

***

### Create a custom dashboard <a href="#create-a-custom-dashboard" id="create-a-custom-dashboard"></a>

You can create your own dashboards to visualize the metrics that matter to your team. Complete the following steps.

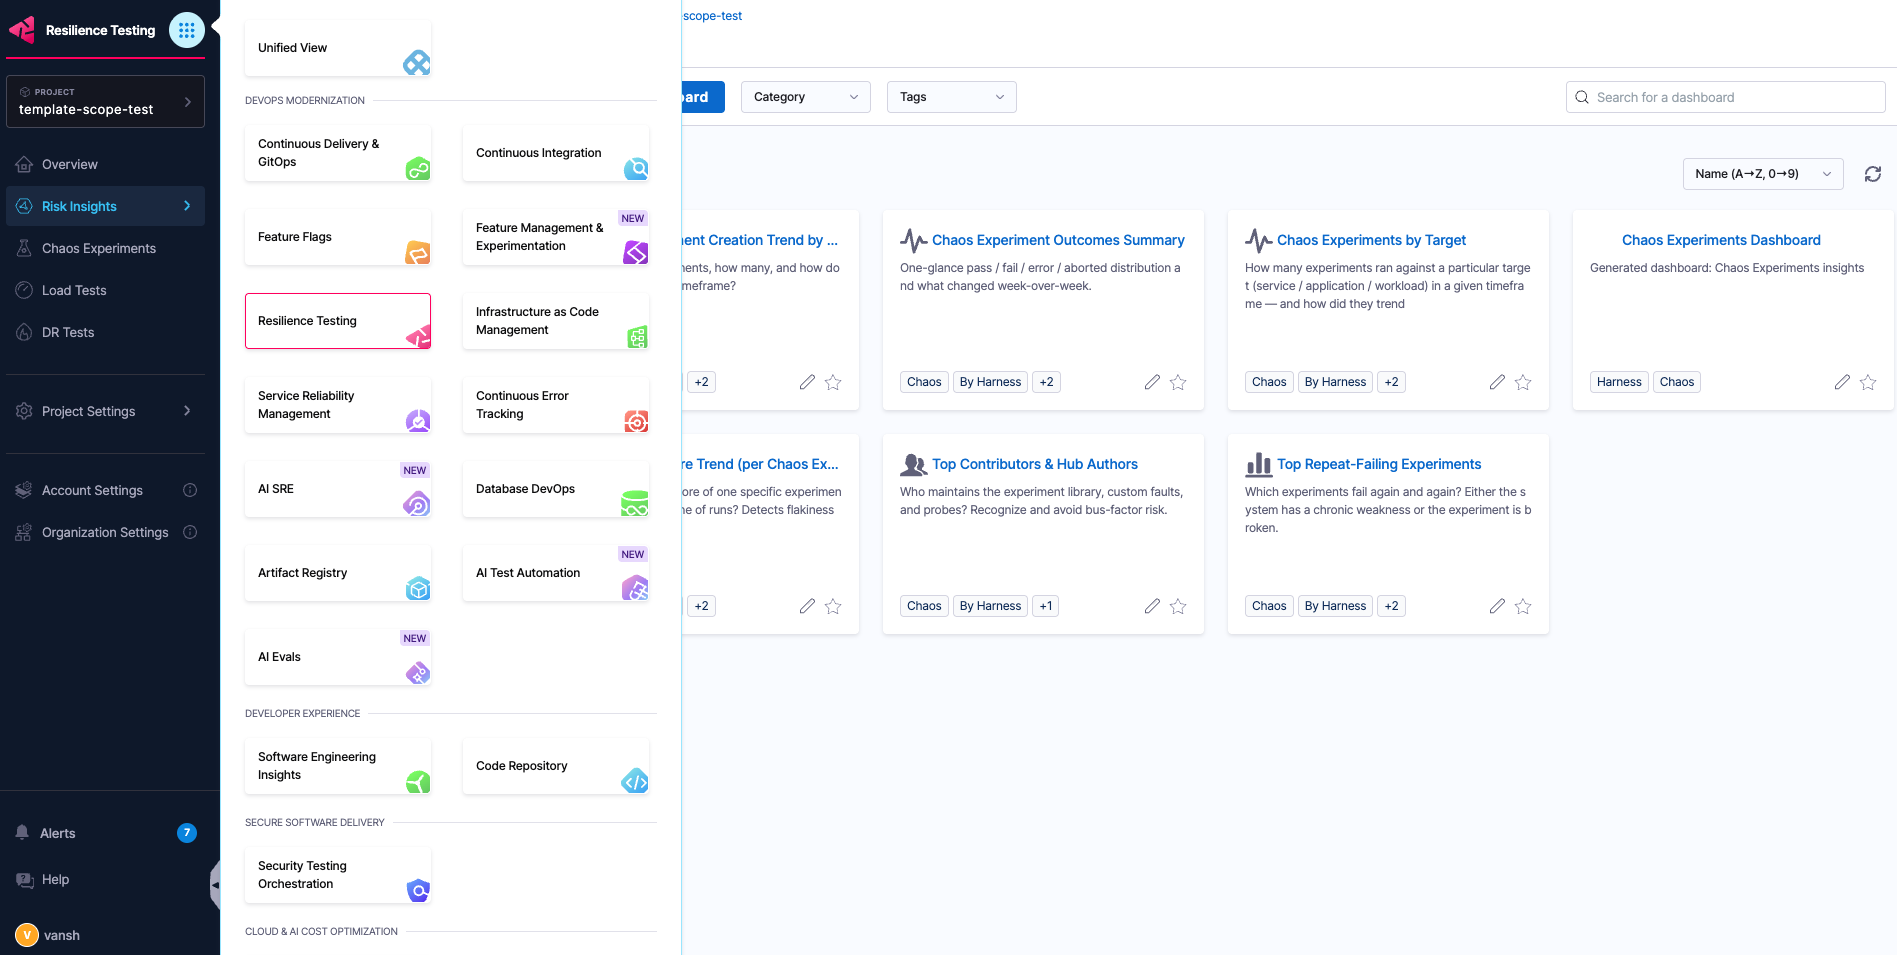
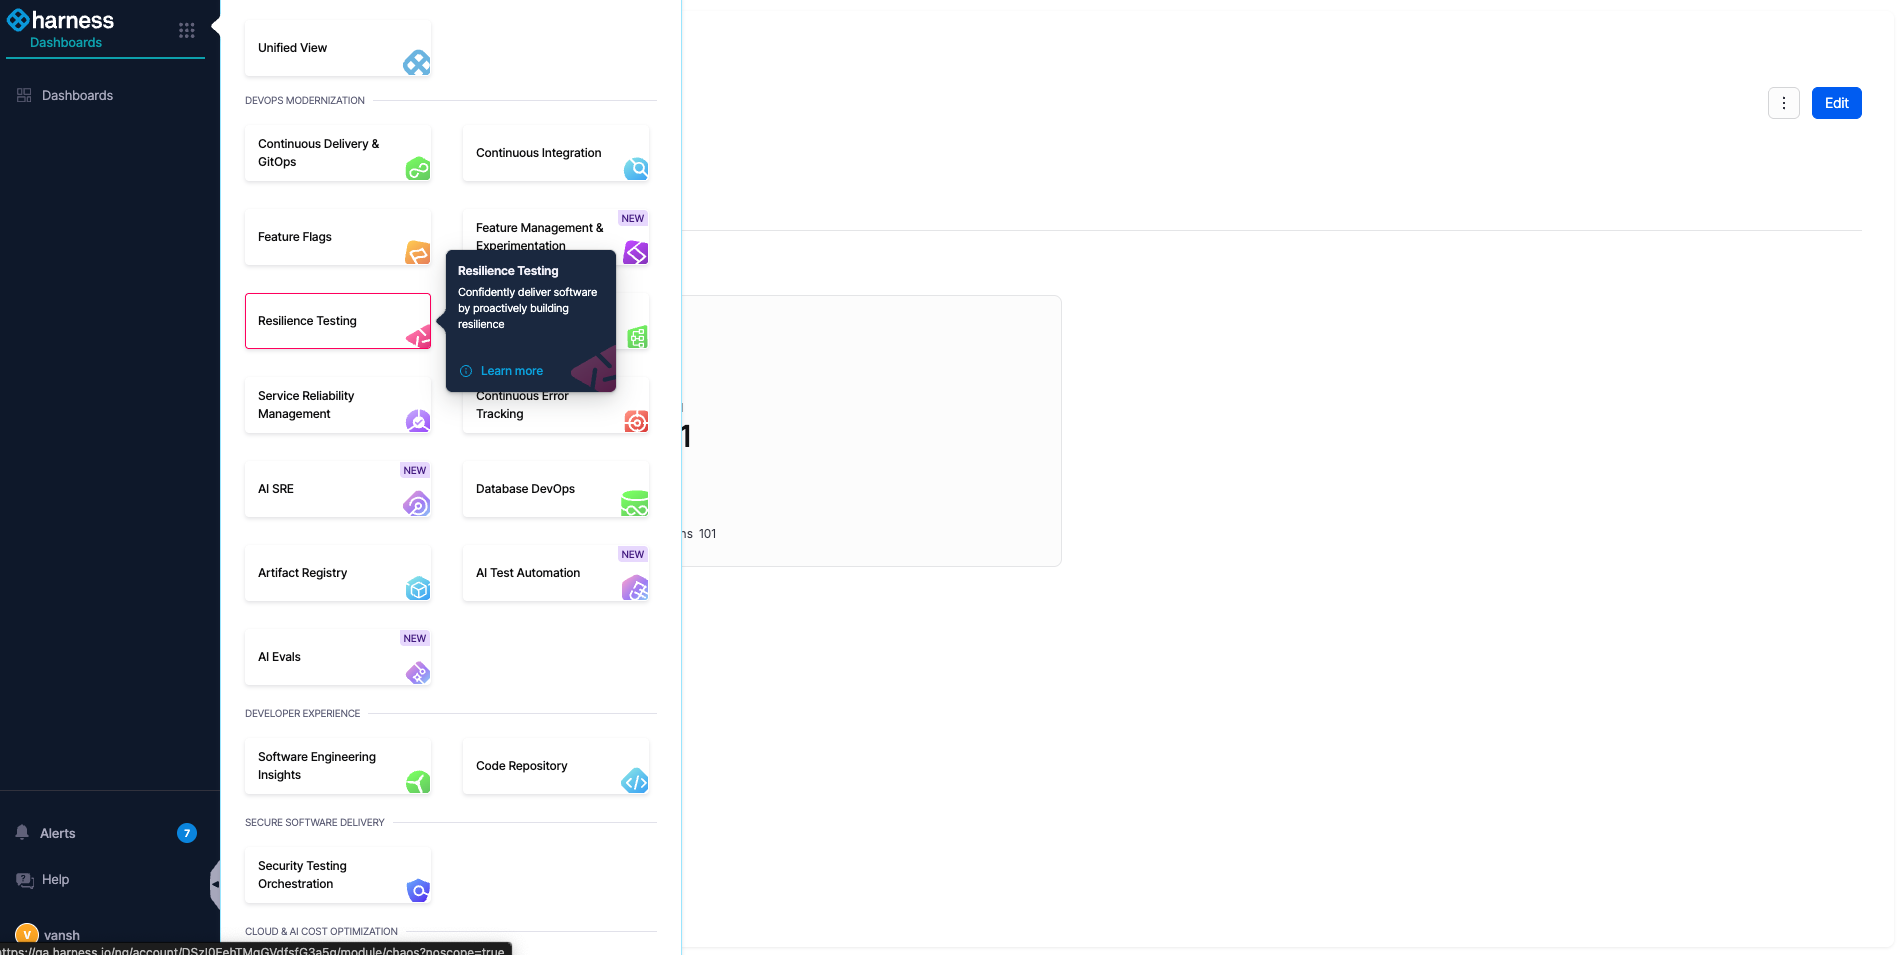
1. Select the nine-dot icon at the top of the left navigation bar.

<figure><img src="/files/rFd81qivkbjAka6FZoCM" alt="The nine-dot icon at the top of the left navigation bar"><figcaption><p>Click to view full size</p></figcaption></figure>

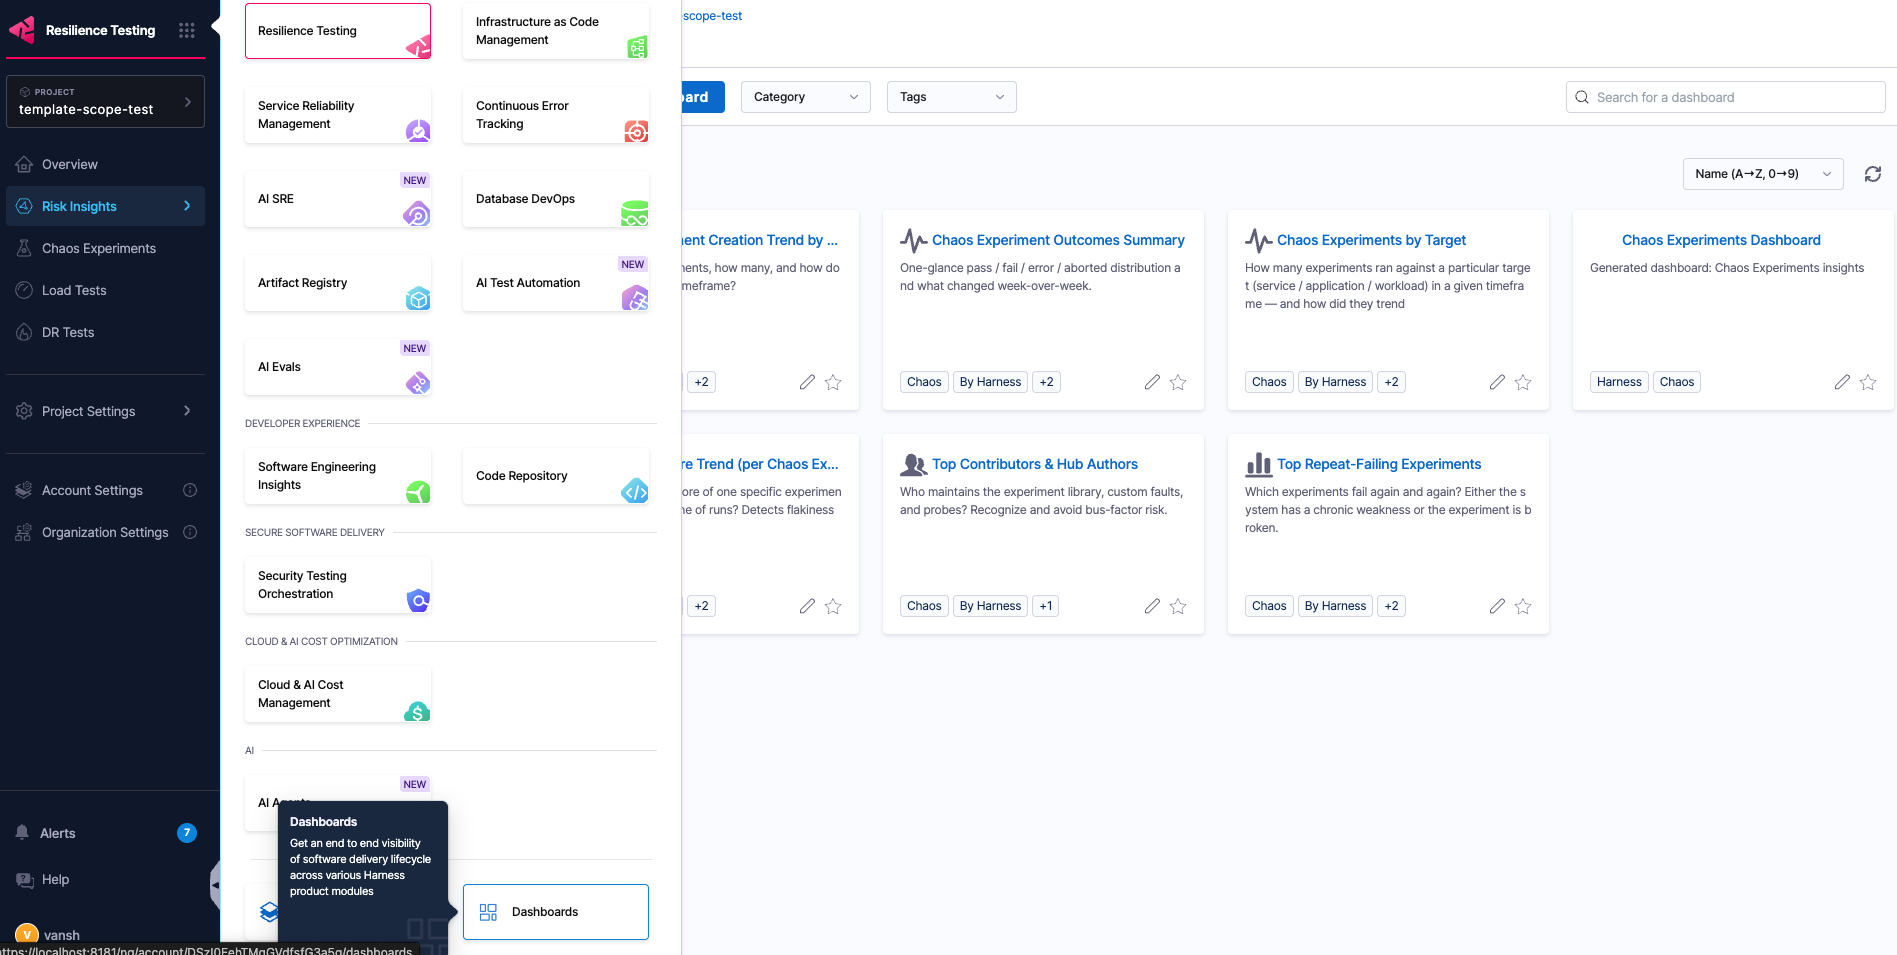
2. At the bottom of the navigation bar, select **Dashboards**.

<figure><img src="/files/j7Mn35OCiYYP2pnhXJik" alt="The Dashboards item at the bottom of the navigation bar"><figcaption><p>Click to view full size</p></figcaption></figure>

{% hint style="info" %}
**SWITCH TO THE NEW EXPERIENCE**

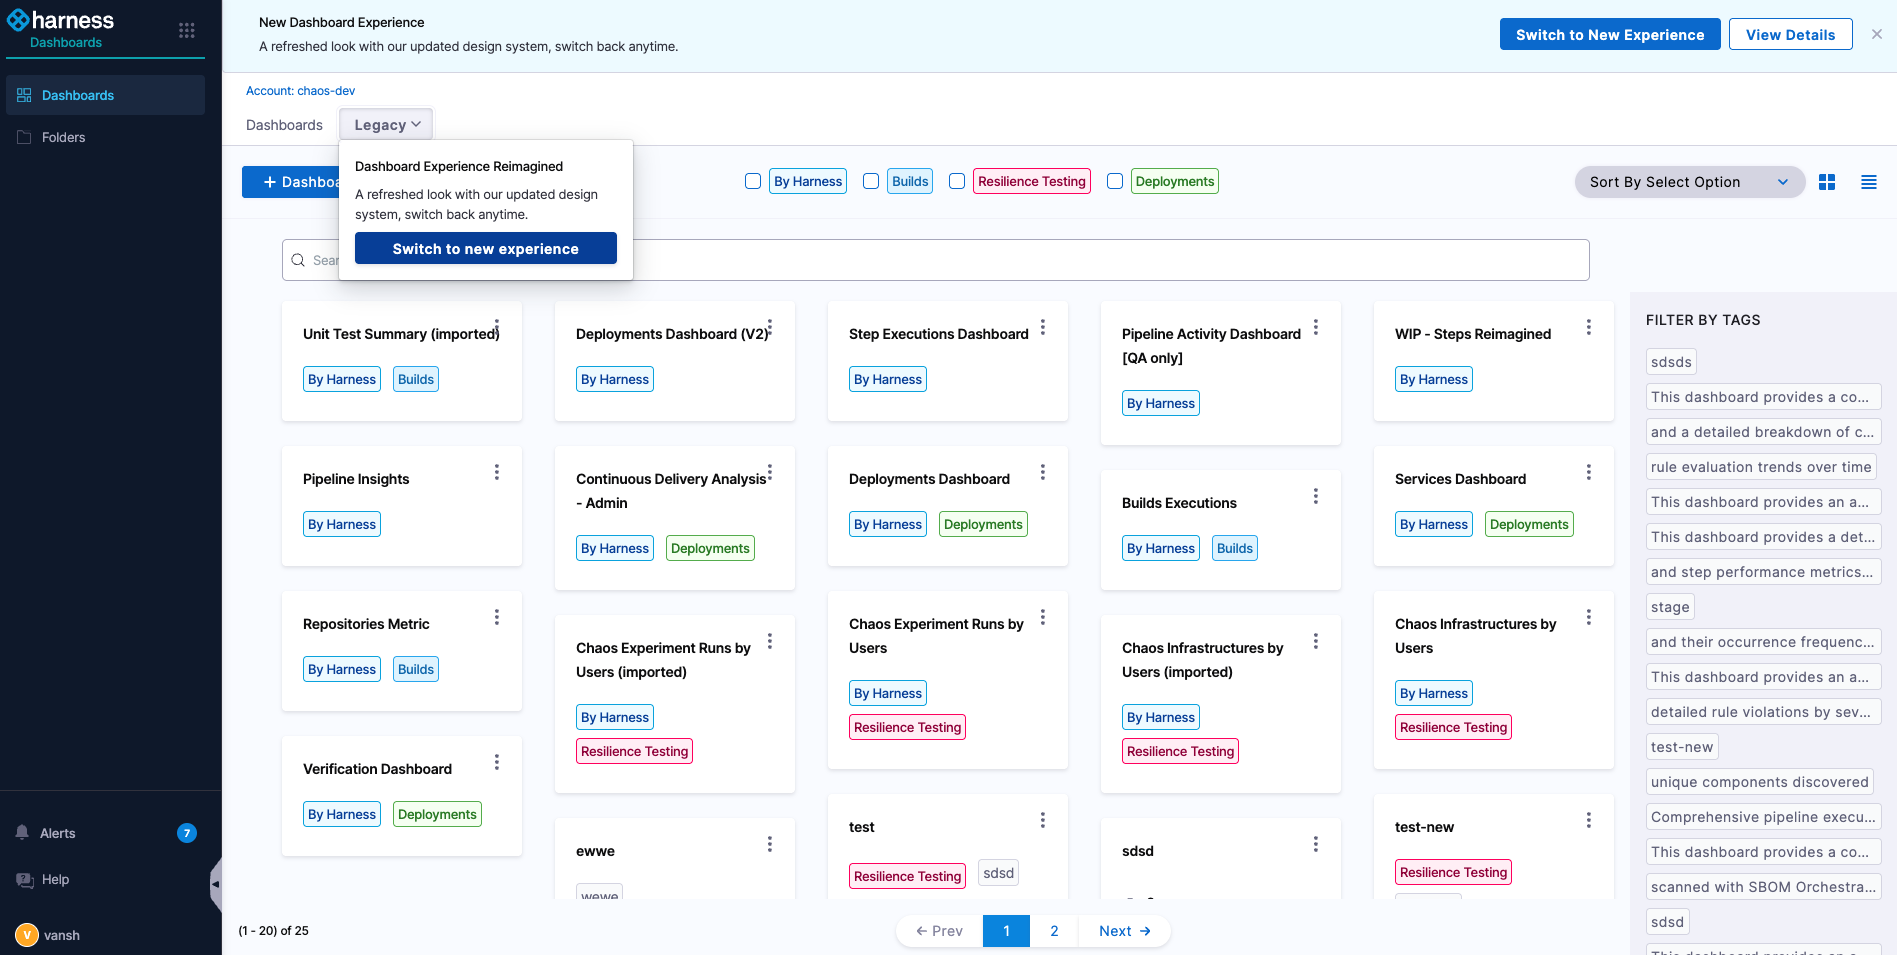
If you see a prompt to switch experiences, use the dropdown and select **Switch to new experience**.

<img src="/files/gLtMcx7CYwYS8SAjXqph" alt="Click to view full size" data-size="original">
{% endhint %}

You now see the dashboards home.

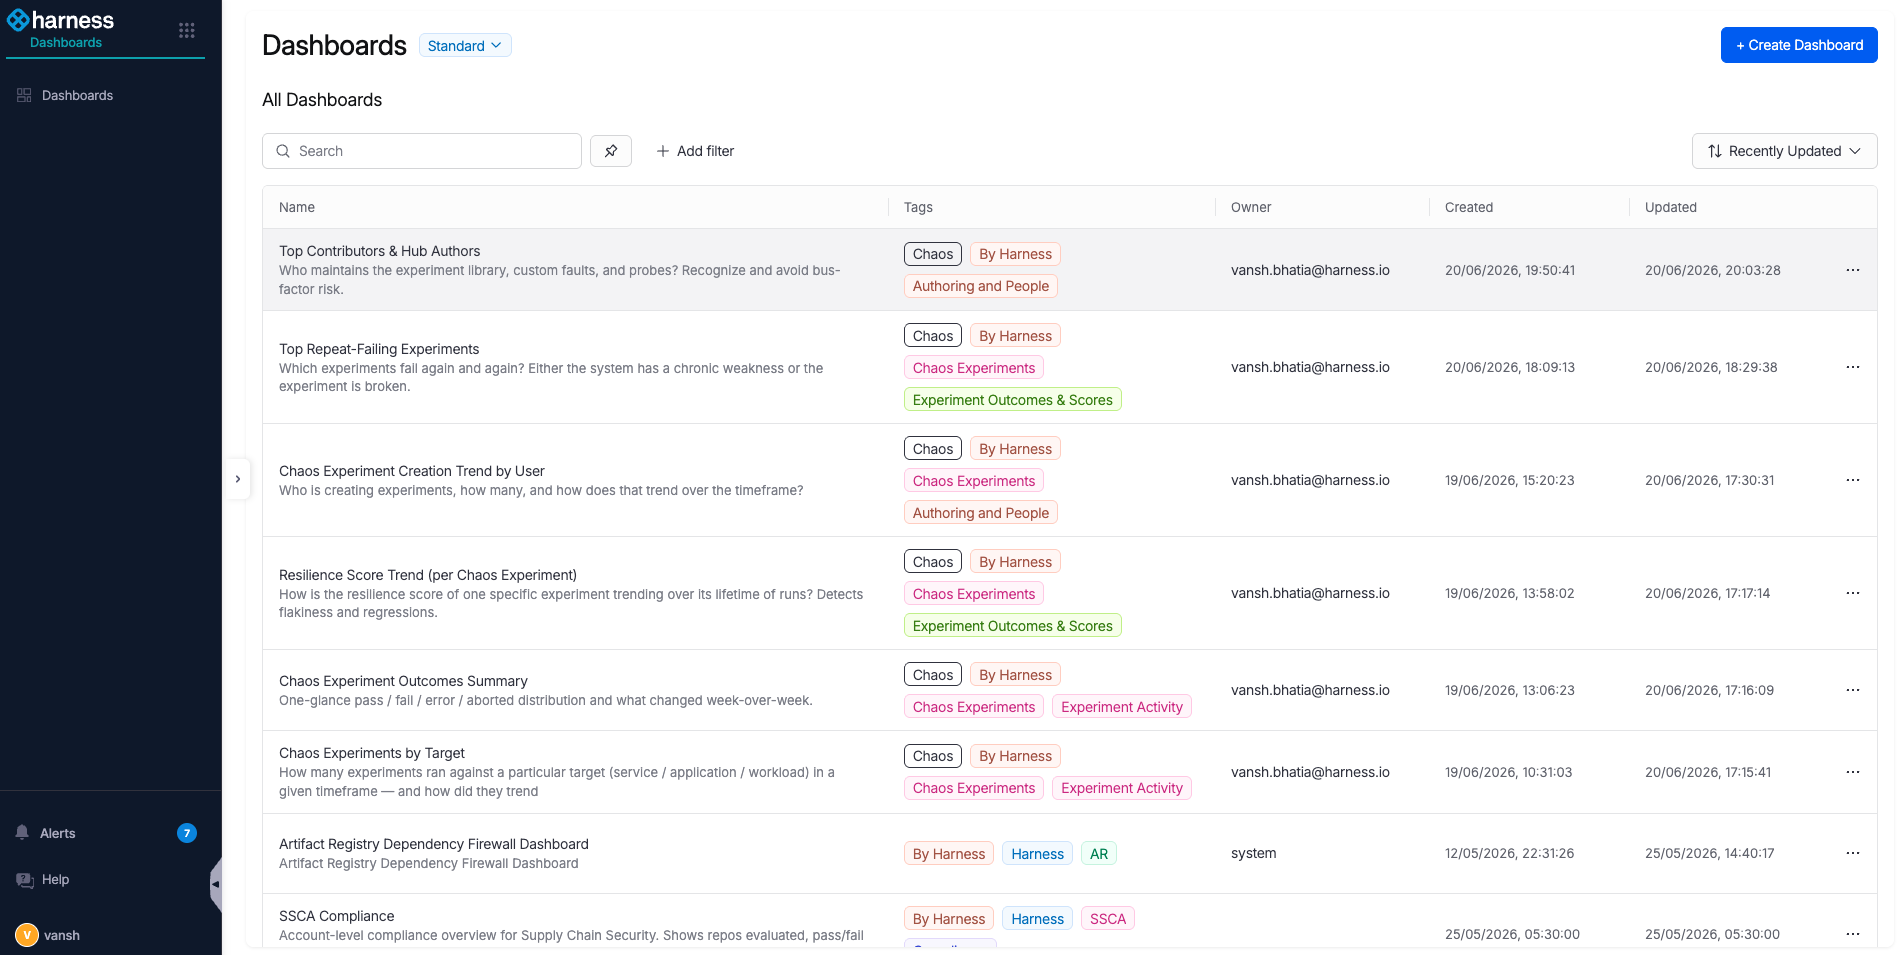
<figure><img src="/files/IyyRKT7XvyHjhNQMhGfX" alt="The dashboards home screen"><figcaption><p>Click to view full size</p></figcaption></figure>

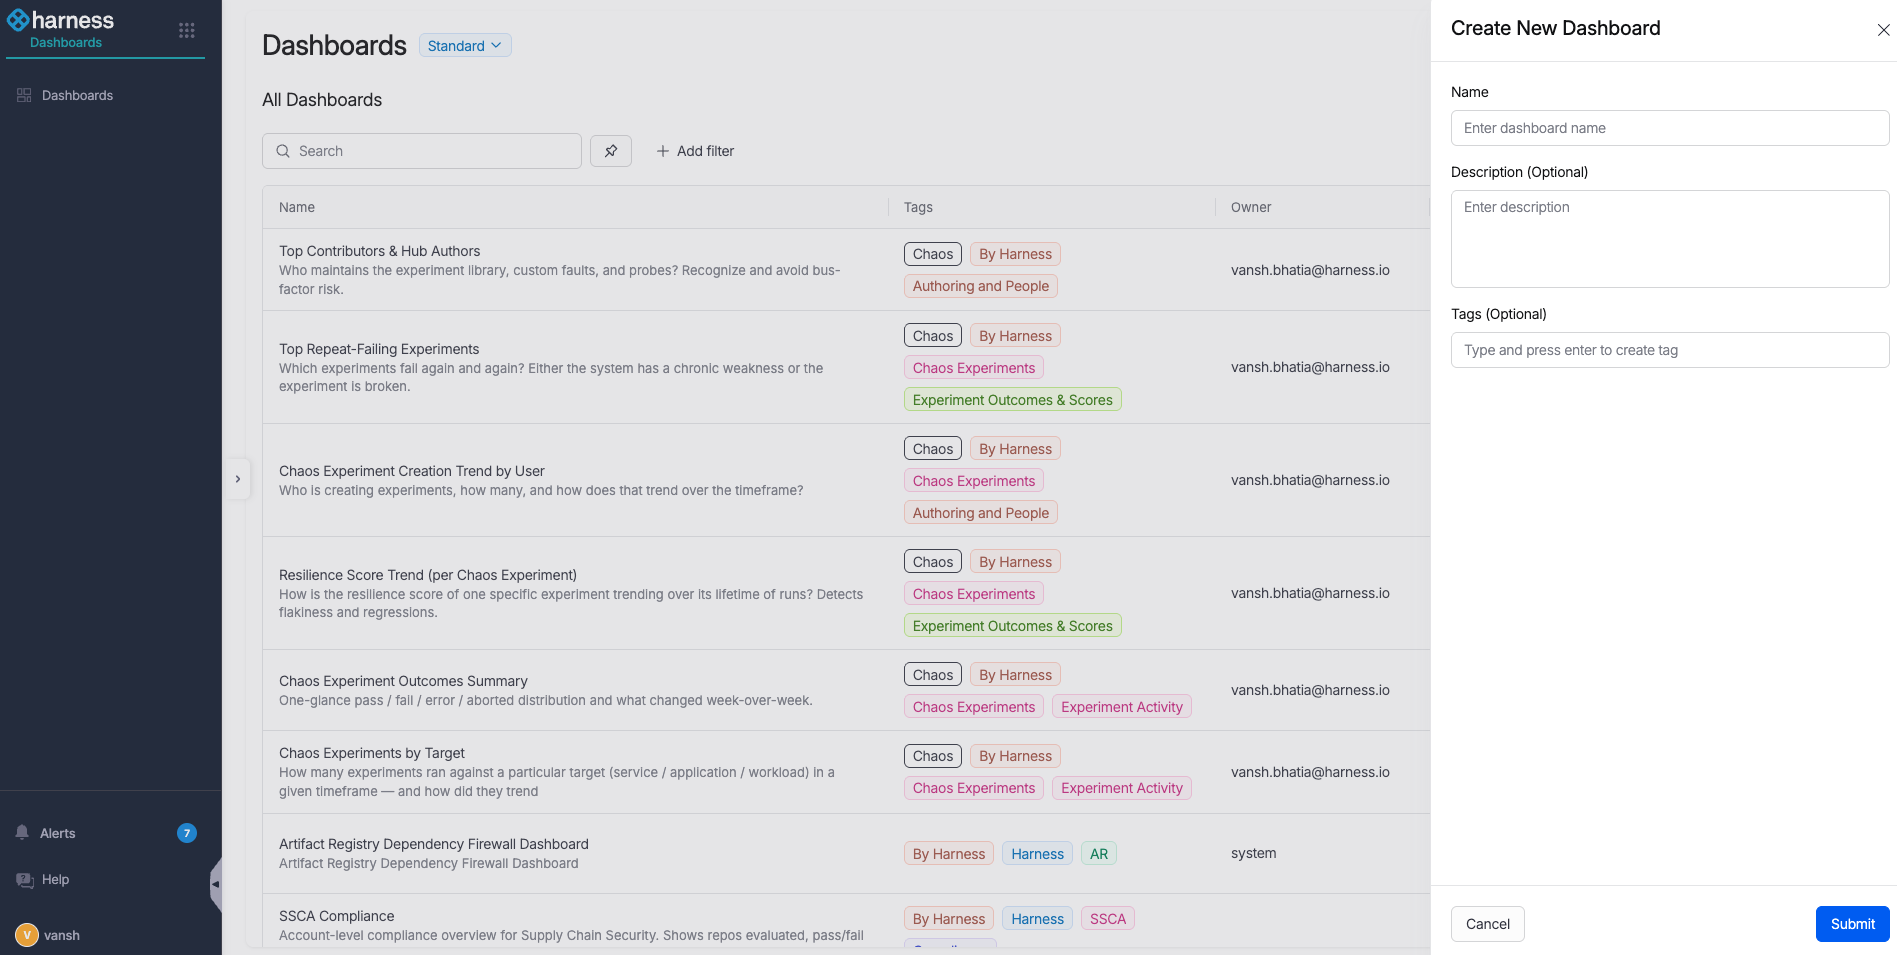
3. Select **+ Create Dashboard**. A right-side drawer opens.

<figure><img src="/files/utZRFF0DWPNaYyqo64T1" alt="The Create Dashboard drawer"><figcaption><p>Click to view full size</p></figcaption></figure>

4. Enter a name and description. Add two mandatory tags so the RT module can identify and classify the dashboard:
   * `Chaos`
   * `<Category>`, where the category is one of `Experiment Activity`, `Experiment Outcomes & Scores`, or `Authoring & People`.

<figure><img src="/files/oLSs0kXRe0N0eXmPyVxQ" alt="The dashboard tags, showing the mandatory Chaos tag and a category tag"><figcaption><p>Click to view full size</p></figcaption></figure>

{% hint style="warning" %}
**TAGS ARE REQUIRED**

The `Chaos` tag and a category tag are mandatory. Without them, the RT module cannot identify or classify the dashboard, so it does not appear in the module's Dashboards section.
{% endhint %}

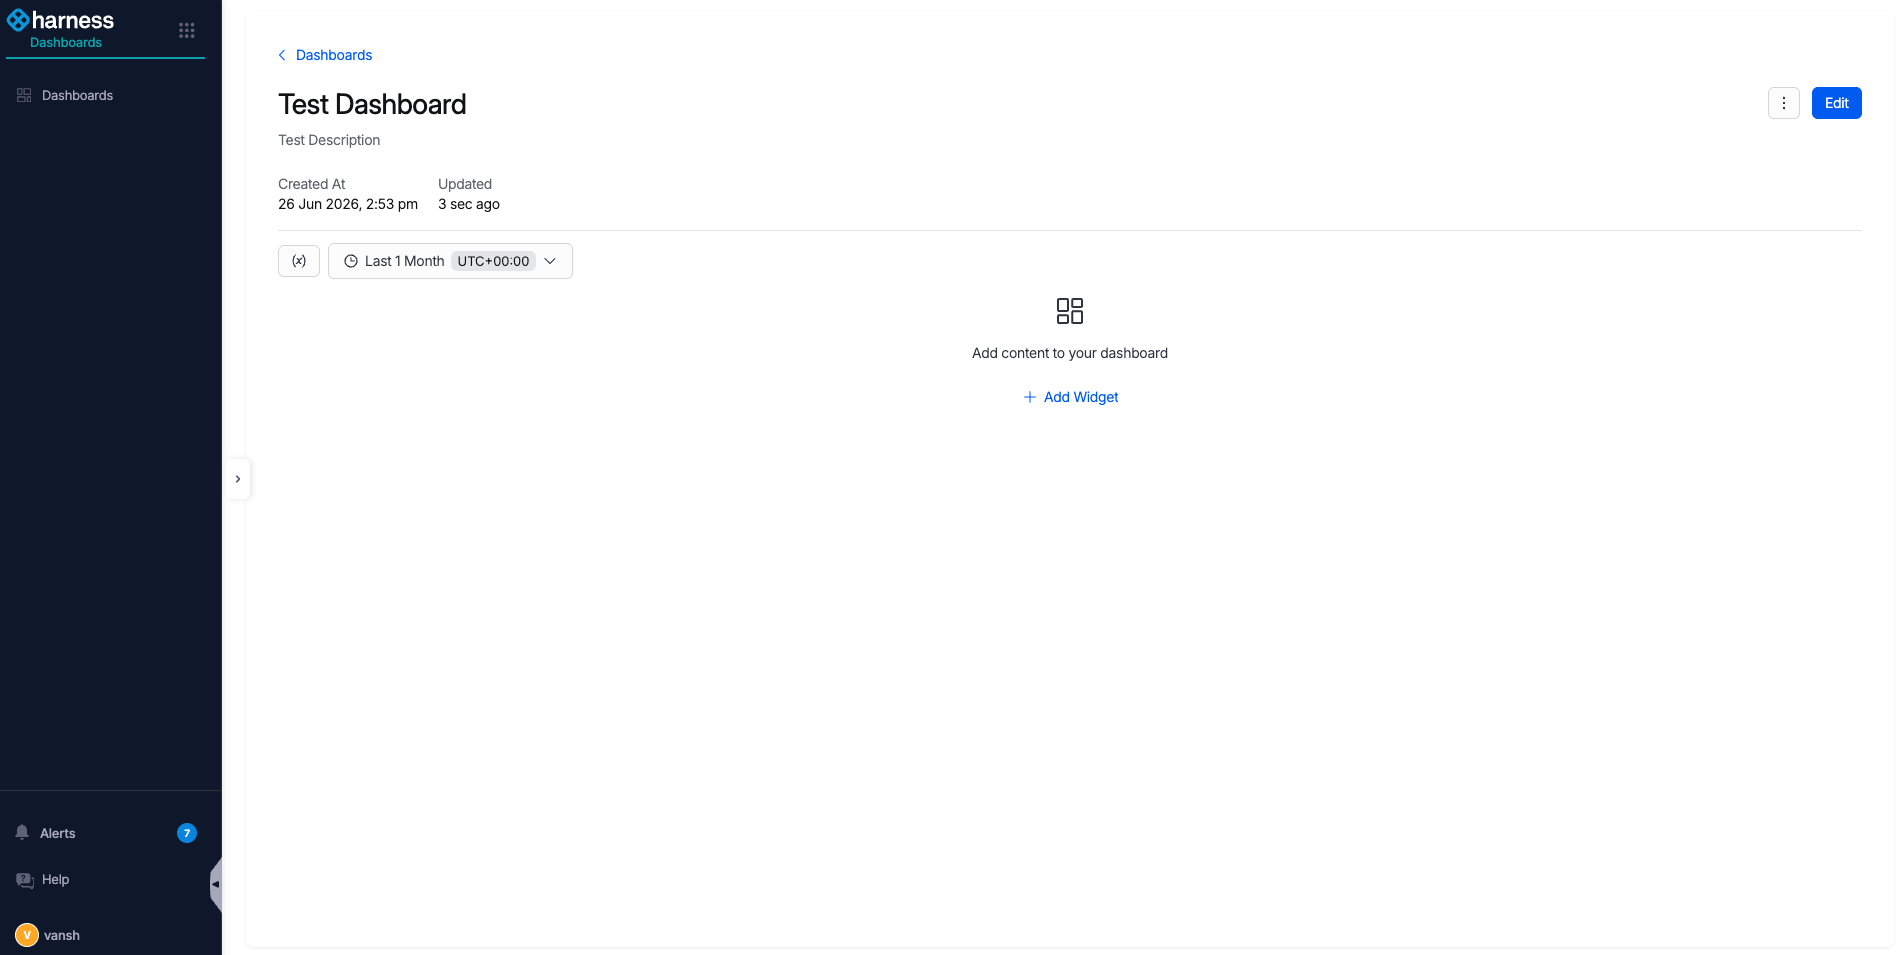
5. Select **Submit**. You land on the new, empty dashboard.

<figure><img src="/files/6ohw7KzUT4GOKz8qd2Wj" alt="The new empty dashboard after submit"><figcaption><p>Click to view full size</p></figcaption></figure>

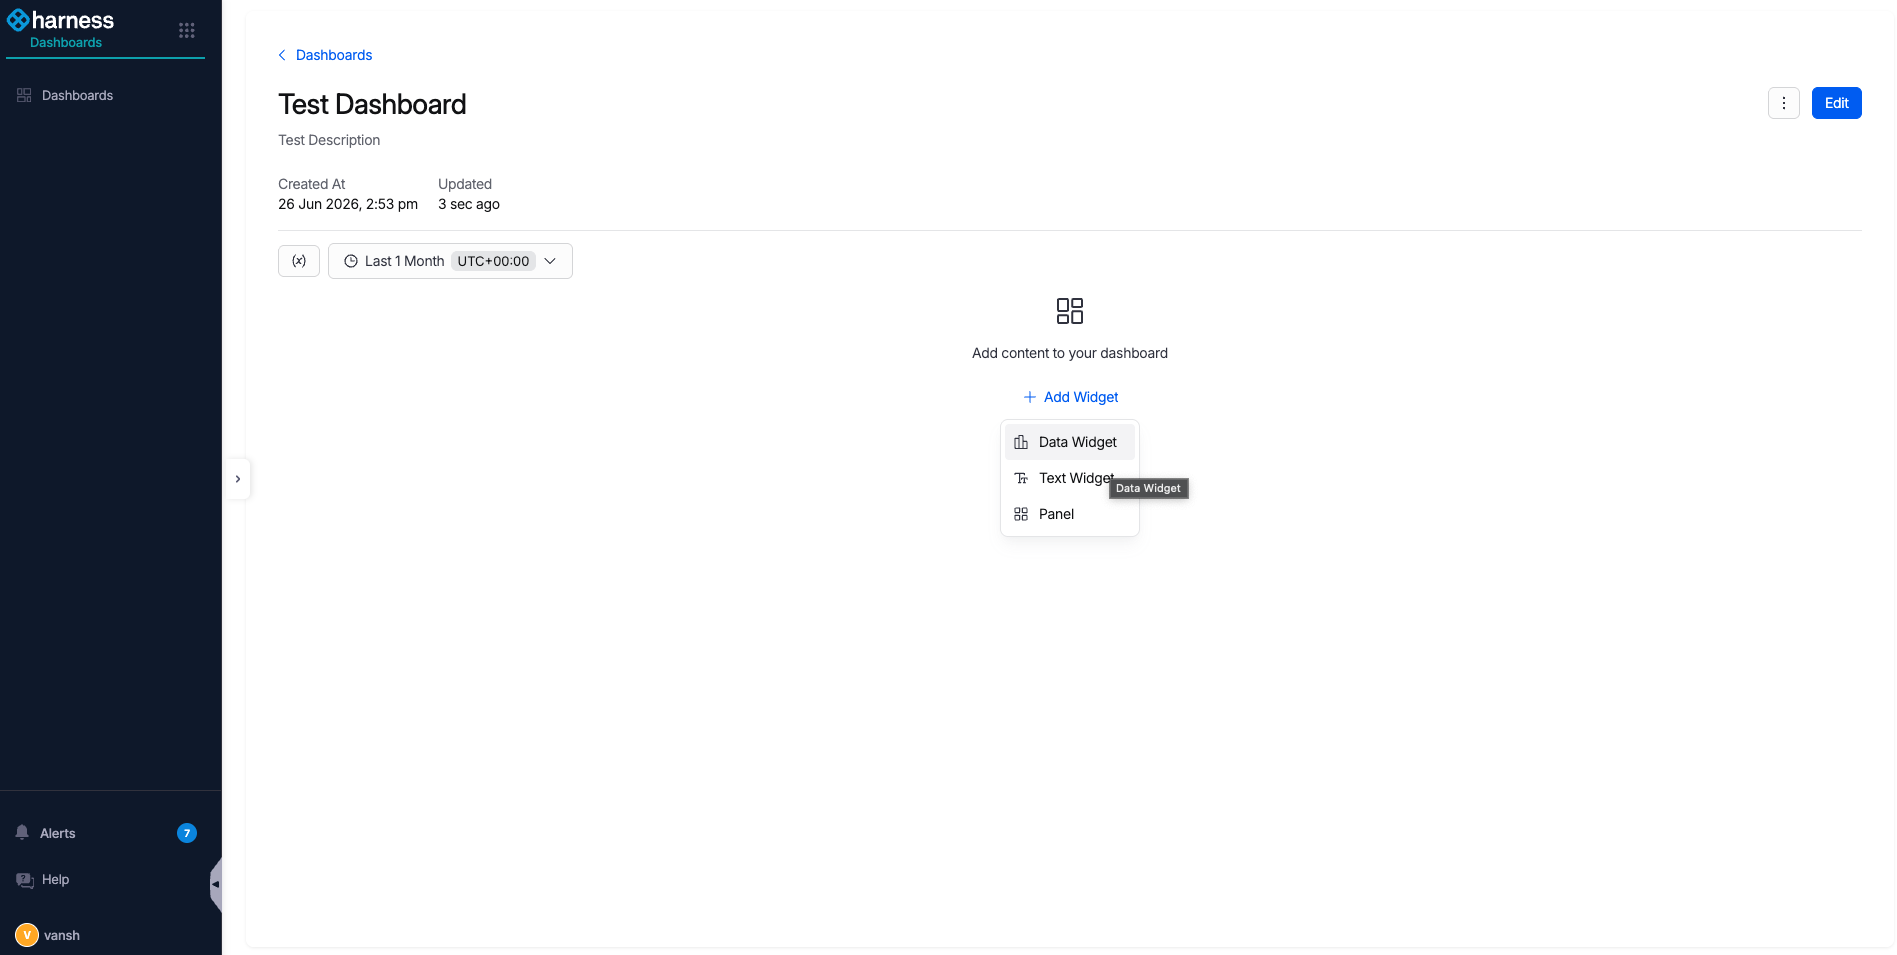
6. Select **+ Add Widget** to start adding widgets (individual tables or graphs).

<figure><img src="/files/O1OWx5KGiDq7n9XTsyBt" alt="The Add Widget button on the dashboard"><figcaption><p>Click to view full size</p></figcaption></figure>

7. Select **Data Widget**.

<figure><img src="/files/nJ5HFBkkTtPh4fbVoHDK" alt="The Data Widget option"><figcaption><p>Click to view full size</p></figcaption></figure>

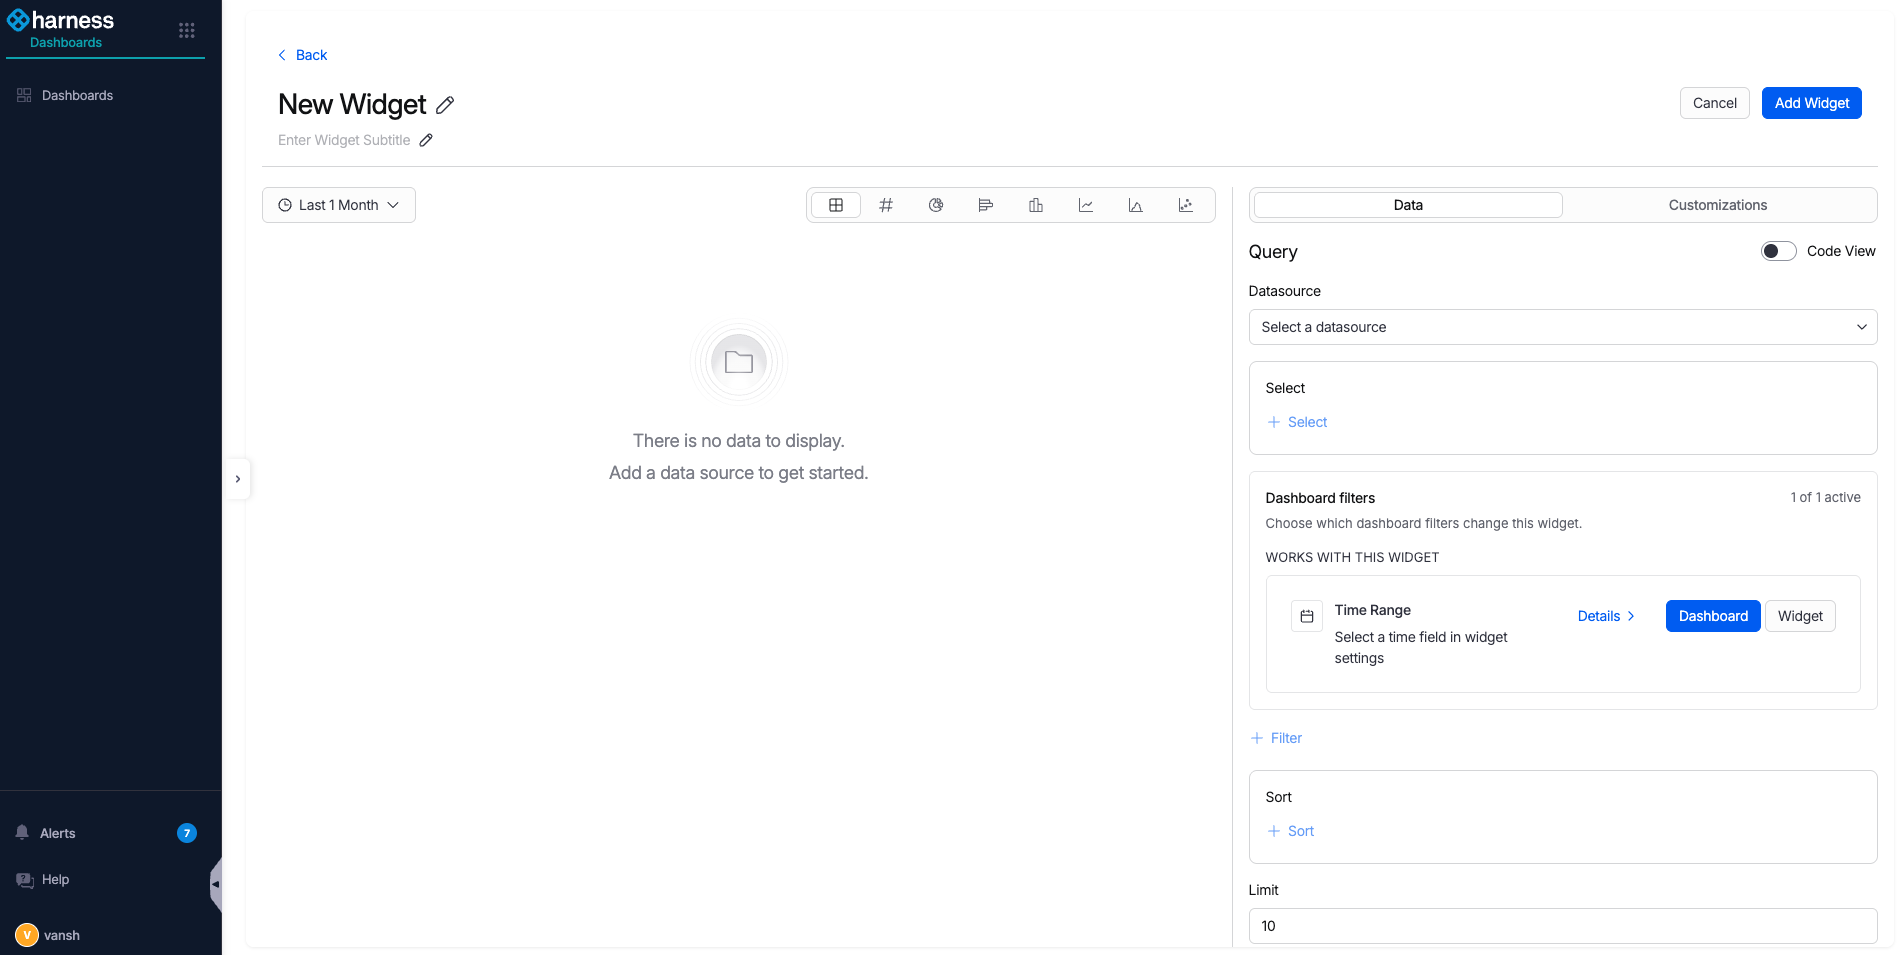
8. Toggle **Code View**.

<figure><img src="/files/HV0lfLeDXl8fwXvpGMAG" alt="The Code View toggle on the widget editor"><figcaption><p>Click to view full size</p></figcaption></figure>

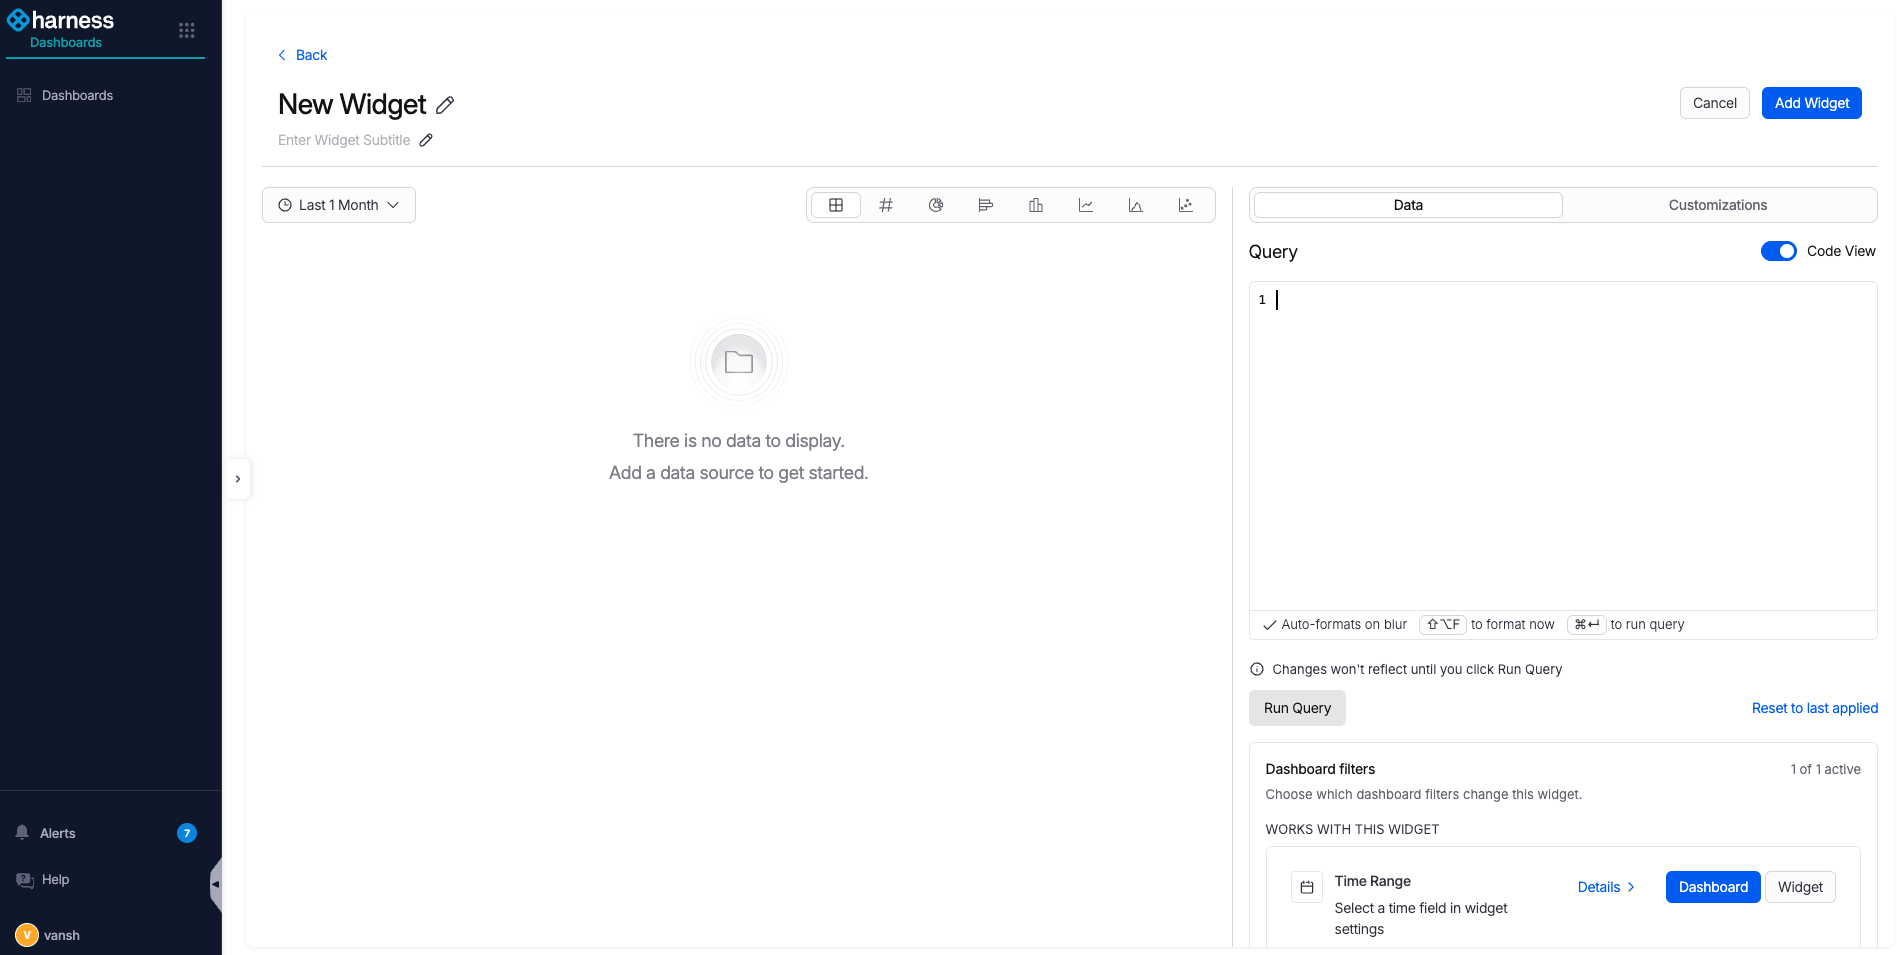
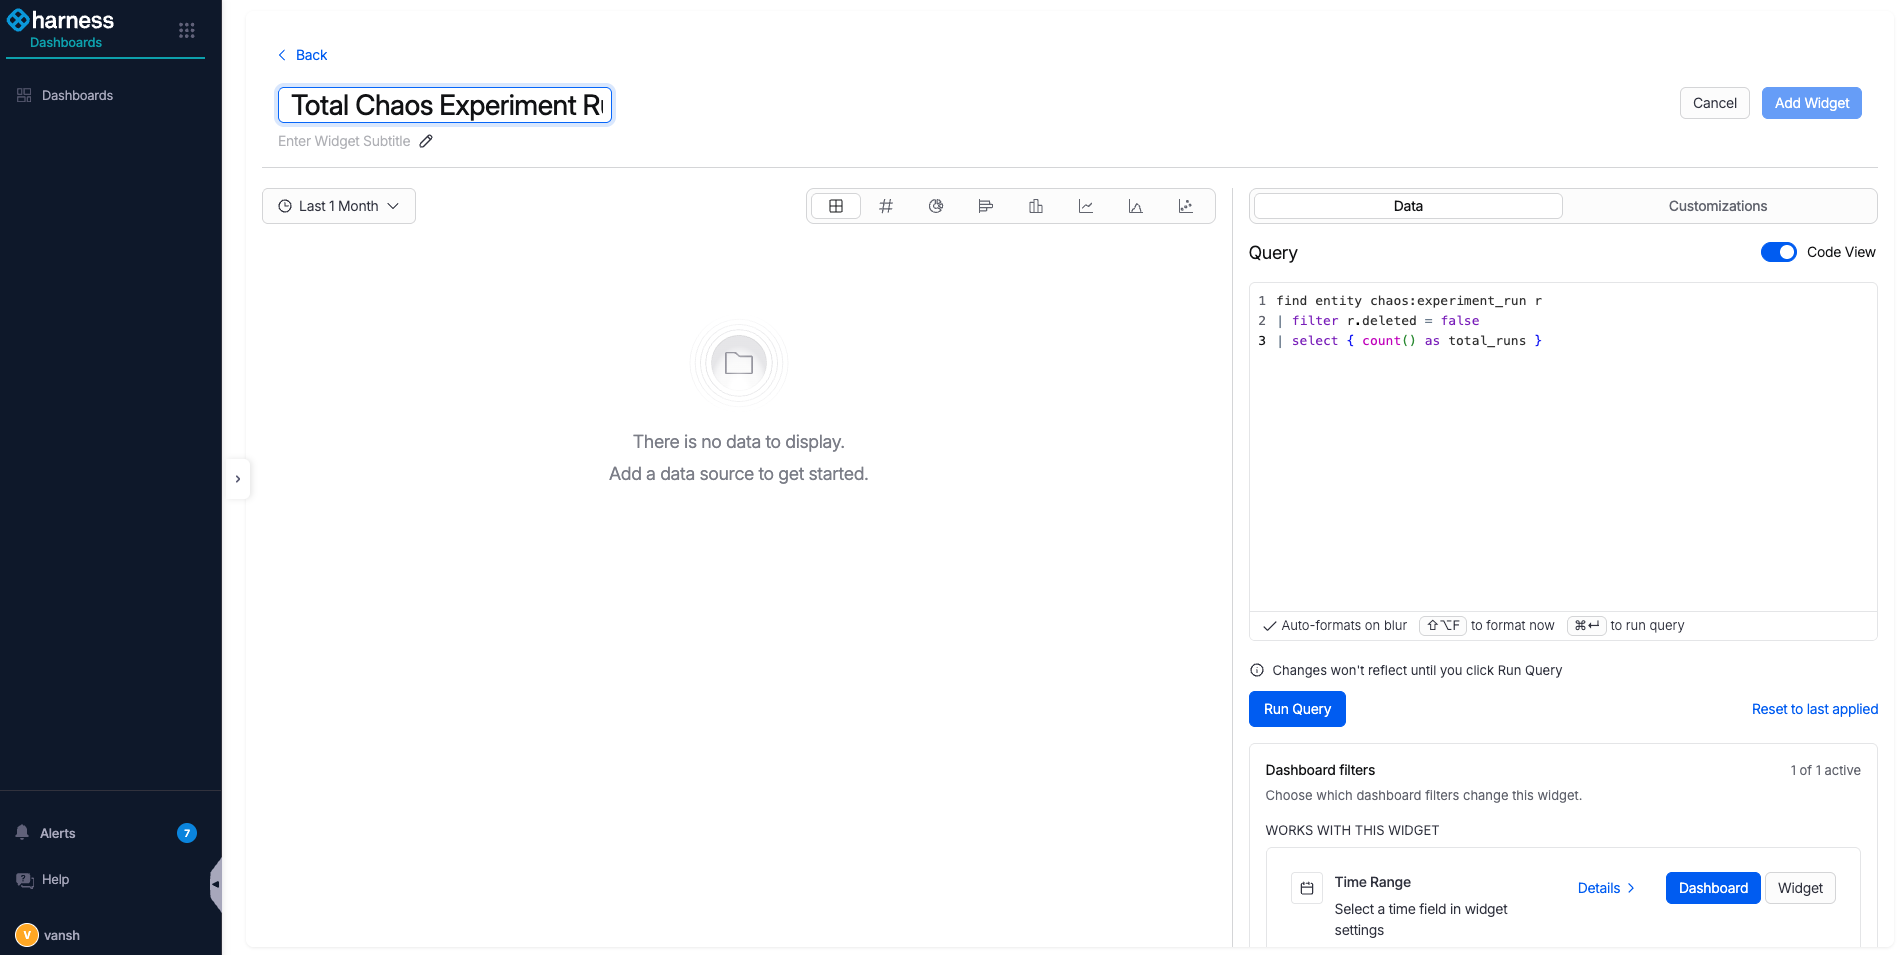
9. Enter a name and description for the widget, then write your query in the **Query** text area. Go to [Dashboard query schema](#dashboard-query-schema) to review the available event and entity types.

<figure><img src="/files/OB2n1B8Fww0k996HjjK3" alt="The widget name, description, and Query text area"><figcaption><p>Click to view full size</p></figcaption></figure>

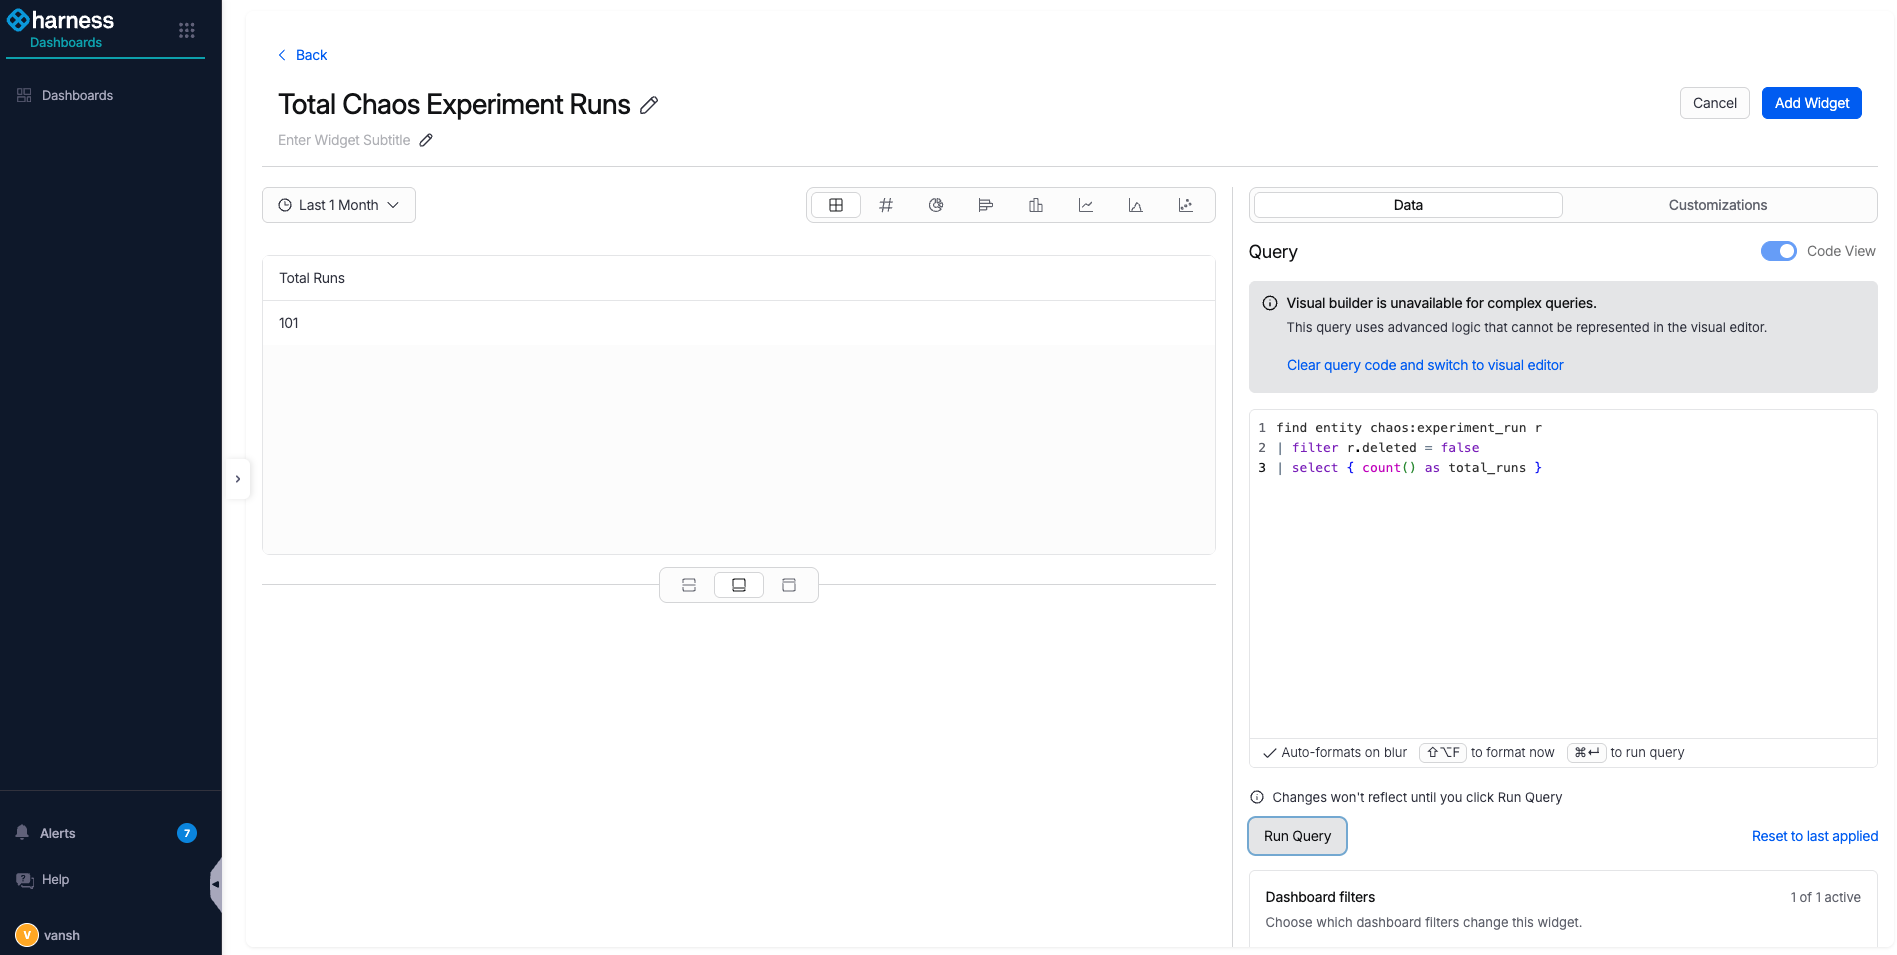
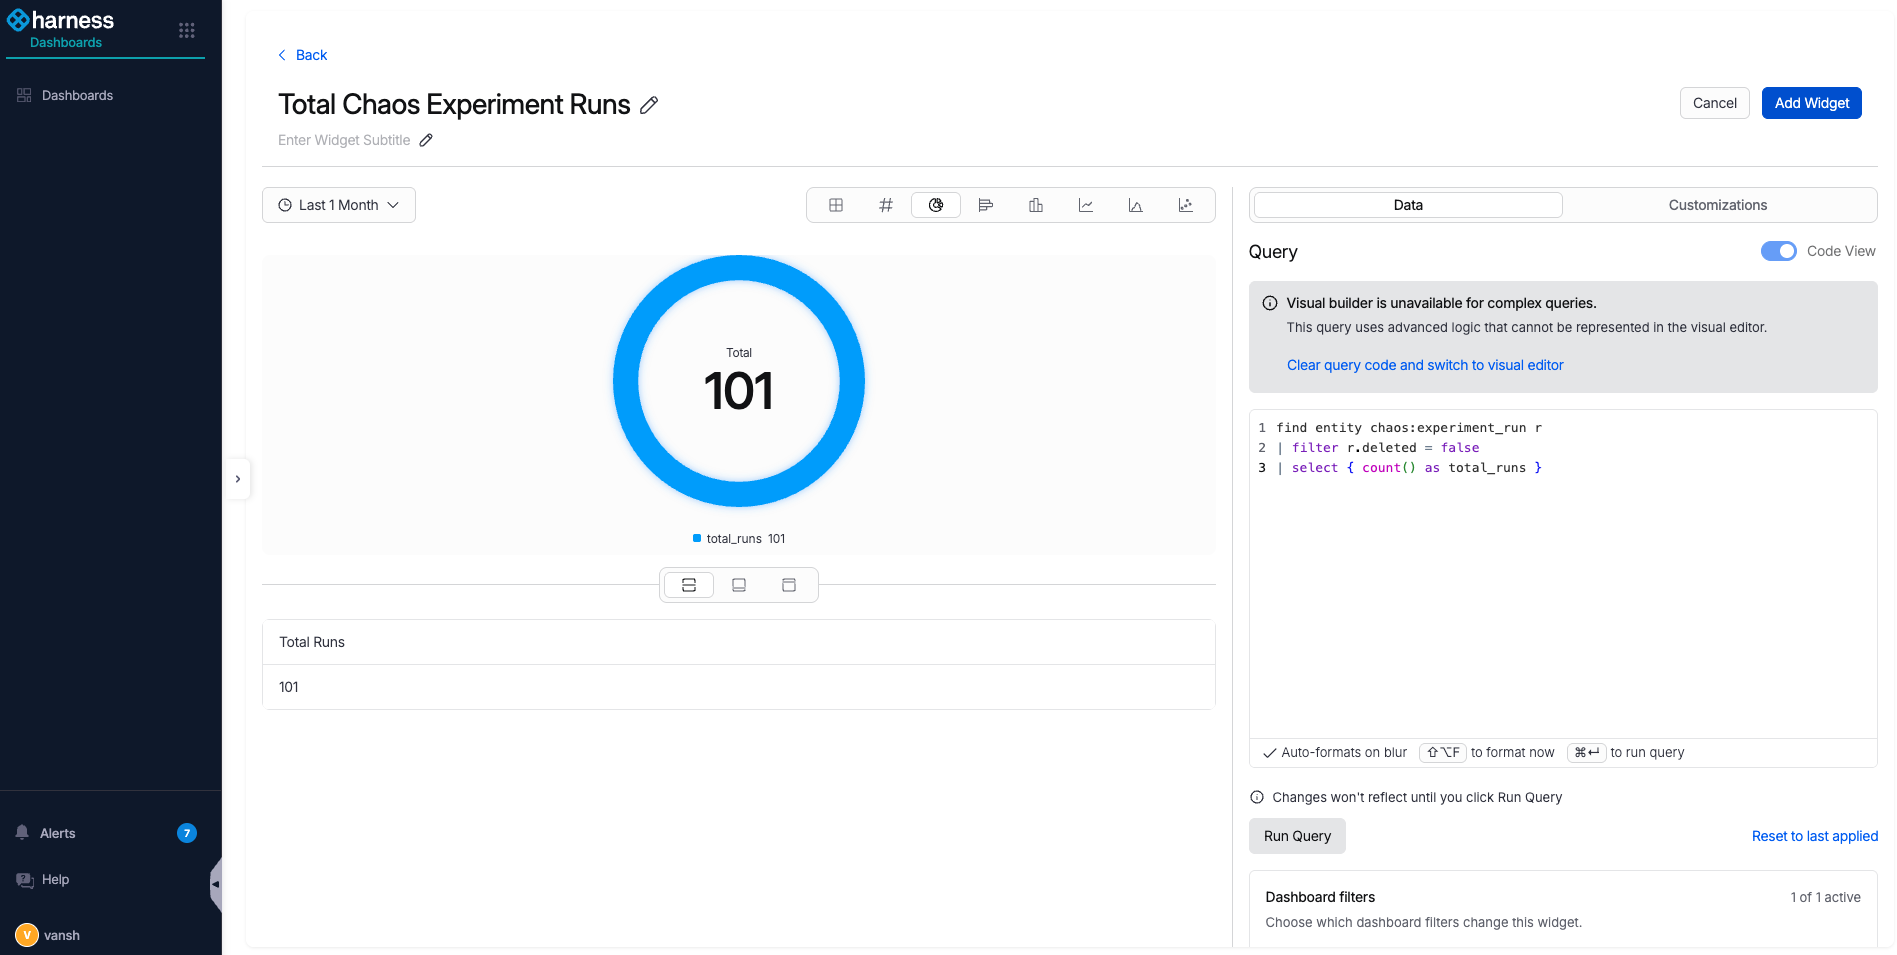
10. Select **Run Query** to fetch data from Harness UDP.

<figure><img src="/files/sAllFP88QiH1FZbpakW2" alt="The Run Query result showing fetched data"><figcaption><p>Click to view full size</p></figcaption></figure>

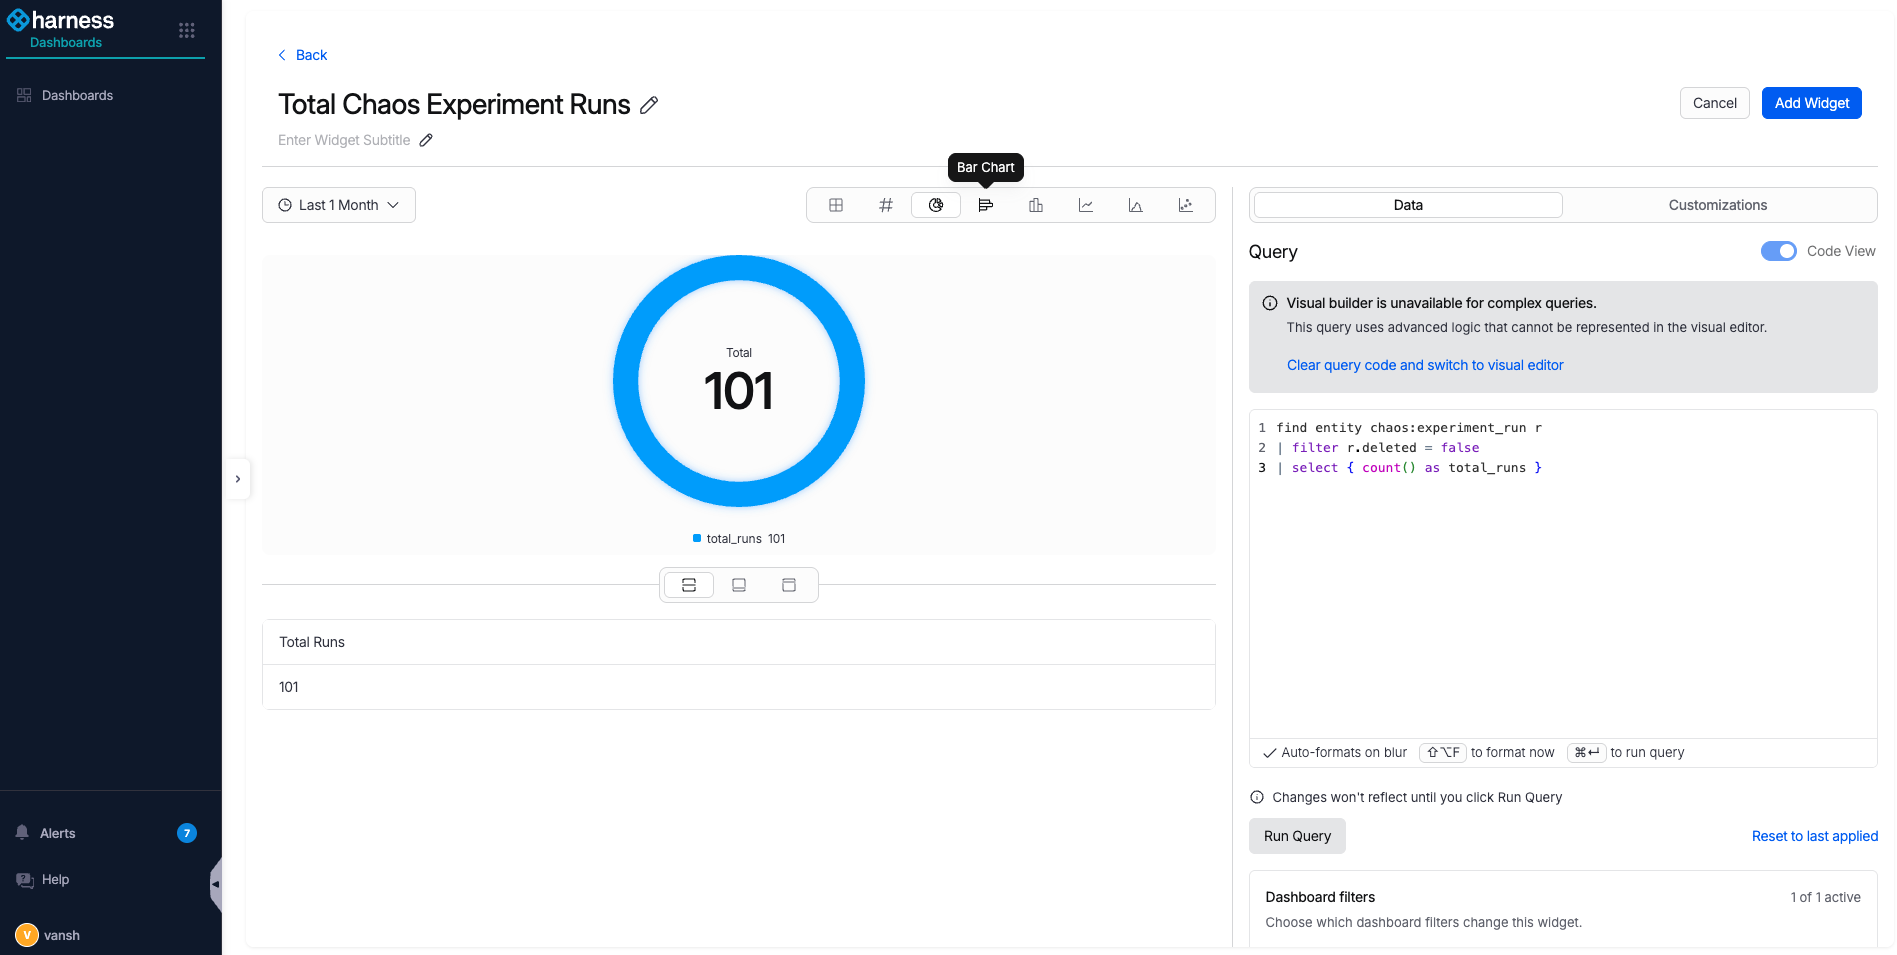
11. Choose a visualization. The available visualizations are:

    * Table View
    * Metric Card
    * Donut Chart
    * Bar Chart
    * Column Chart
    * Line Chart
    * Area Chart
    * Scatter Chart

    This example uses a **Donut Chart**.

<figure><img src="/files/pZ7lO3qpXPnlSFGHEdth" alt="A Donut Chart visualization of the query results"><figcaption><p>Click to view full size</p></figcaption></figure>

12. Select **Add Widget** at the top right to save the widget.

<figure><img src="/files/Z7ezAaSGHQhRdXbyLxtm" alt="The Add Widget button at the top right of the widget editor"><figcaption><p>Click to view full size</p></figcaption></figure>

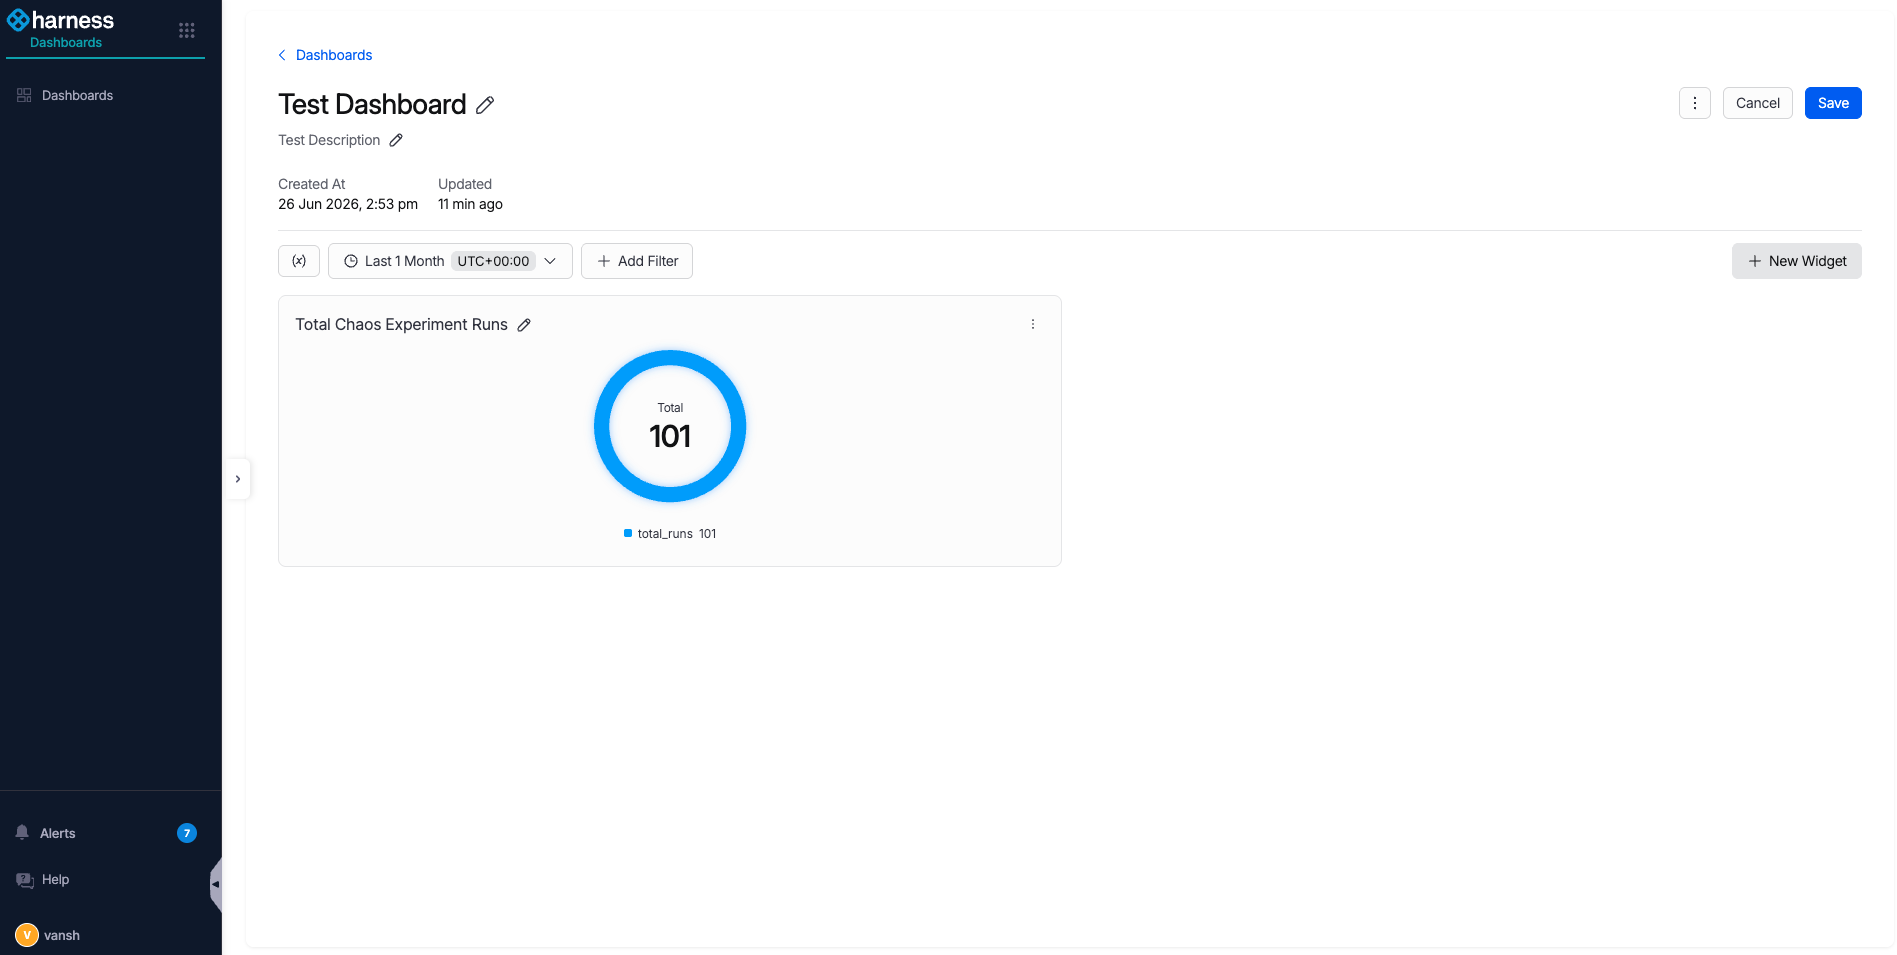
13. The dashboard shows the widget you added. Add any remaining widgets, then select **Save** at the top right.

<figure><img src="/files/B3nHbjHzxK07CbfbevRv" alt="The dashboard showing the newly added widget with the Save button"><figcaption><p>Click to view full size</p></figcaption></figure>

14. Return to the RT module from the left navigation bar.

<figure><img src="/files/4PswopCiTcBuDAZb7Rcp" alt="The left navigation bar option to return to the Resilience Testing module"><figcaption><p>Click to view full size</p></figcaption></figure>

15. In the RT module, go back to the **Dashboards** page under **Insights**.

<figure><img src="/files/rwpWtbFeMDP70kiNLYUz" alt="The Dashboards page under Insights in the RT module"><figcaption><p>Click to view full size</p></figcaption></figure>

Your custom dashboard now appears in the **Dashboards** section, filtered under the category you tagged it with, and you can open it to see the widgets you created.

<figure><img src="/files/6c7uQ2rYEFSeesoT0nUd" alt="The custom Test Dashboard visible in the Dashboards section under its tagged category"><figcaption><p>Click to view full size</p></figcaption></figure>

***

### RBAC considerations <a href="#rbac-considerations" id="rbac-considerations"></a>

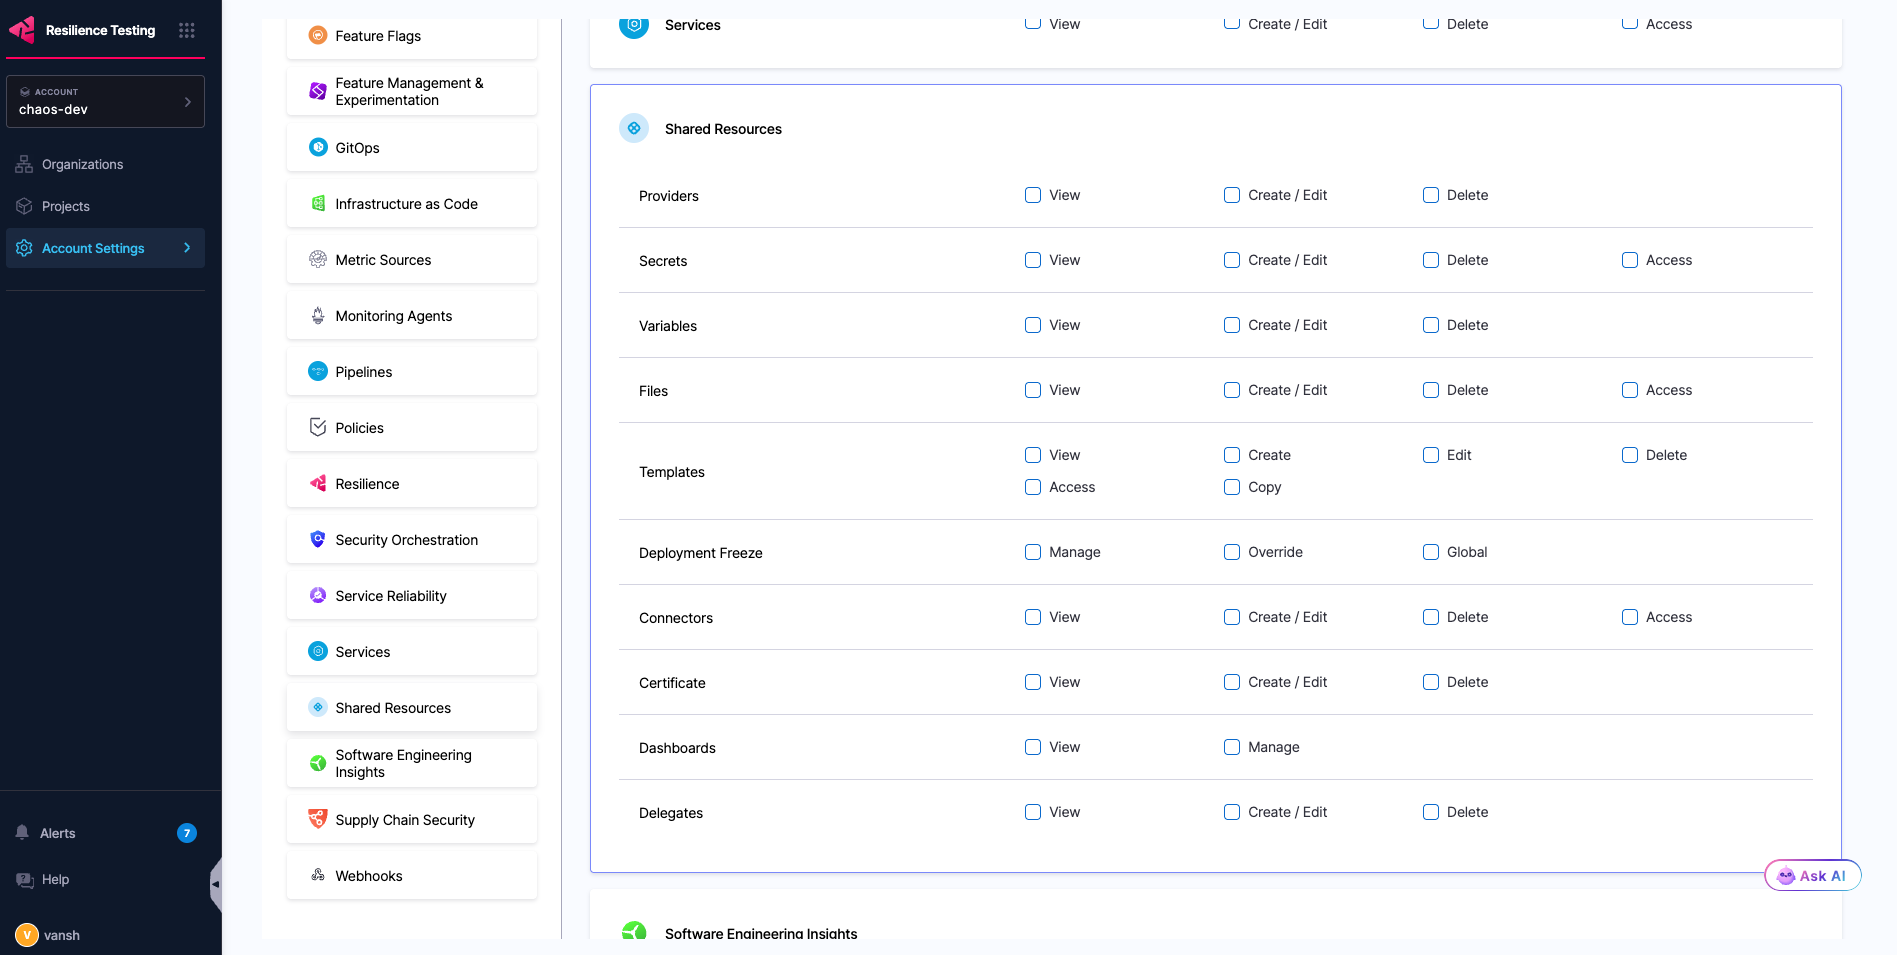
Dashboards fall under the **Shared Resources** category, with **View** and **Manage** permissions:

* **View:** Required to see the RT module in-product dashboards.
* **Manage:** Required to create your own dashboards.
<figure><img src="/files/QSBbwpMeOlo77kMeGMbW" alt="The Shared Resources dashboard permissions, showing View and Manage"><figcaption><p>Click to view full size</p></figcaption></figure>

Go to [RBAC in Harness](/harness-ai/use-harness-platform/platform-access-control.md) to configure roles and permissions.

***

### Dashboard query schema <a href="#dashboard-query-schema" id="dashboard-query-schema"></a>

Custom dashboard widgets query Harness UDP using event and entity types. The following reference lists the available types and example queries.

#### Event types <a href="#event-types" id="event-types"></a>

**Chaos Experiment Runs (`chaos:experiment_run_event`)**

```sql
find event chaos:experiment_run_event | select { created_at, resiliency_score, db_id, unique_id, parent_unique_id, last_modified_at, phase, infrastructure_id, event_timestamp, org_identifier, updated_by, fk_experiment_id, cdc_operation_type, experiment_run_id, sequence, experiment_name, project_identifier, created_by, target_services, account_identifier, yaml, deleted } | filter event_timestamp > ago(1h) | limit 10
```

#### Entity types <a href="#entity-types" id="entity-types"></a>

**Chaos Action (`chaos:action`)**

```sql
find entity chaos:action | select { created_at, description, tags, type, identifier, db_id, unique_id, parent_unique_id, last_modified_at, name, org_identifier, updated_by, account_identifier, project_identifier, created_by, infrastructure_type, deleted } | limit 10
```

**Chaos Action Template (`chaos:action_template`)**

```sql
find entity chaos:action_template | select { created_at, description, tags, type, identifier, db_id, unique_id, hub_identifier, last_modified_at, parent_unique_id, name, org_identifier, updated_by, account_identifier, project_identifier, created_by, infrastructure_type, deleted } | limit 10
```

**Chaos Execution Node (`chaos:execution_node`)**

```sql
find entity chaos:execution_node | select { experiment_id, db_id, finished_at, status, infrastructure_id, name, org_identifier, step_type, last_updated_at, experiment_run_id, spec, account_identifier, project_identifier, infrastructure_type, started_at, deleted } | limit 10
```

**Chaos Experiment (`chaos:experiment`)**

```sql
find entity chaos:experiment | select { created_at, description, tags, experiment_id, identifier, db_id, unique_id, parent_unique_id, last_modified_at, infrastructure_id, name, org_identifier, updated_by, account_identifier, project_identifier, created_by, infrastructure_type, deleted } | limit 10
```

**Chaos Experiment Run (`chaos:experiment_run`)**

```sql
find entity chaos:experiment_run | select { created_at, resiliency_score, db_id, unique_id, parent_unique_id, last_modified_at, phase, infrastructure_id, org_identifier, updated_by, fk_experiment_id, experiment_run_id, sequence, experiment_name, project_identifier, created_by, target_services, account_identifier, yaml, deleted } | limit 10
```

**Chaos Experiment Template (`chaos:experiment_template`)**

```sql
find entity chaos:experiment_template | select { created_at, description, tags, identifier, db_id, unique_id, hub_identifier, last_modified_at, parent_unique_id, name, org_identifier, updated_by, is_default, account_identifier, project_identifier, created_by, revision, template_uid, yaml, infrastructure_type, deleted } | limit 10
```

**Chaos Fault (`chaos:fault`)**

```sql
find entity chaos:fault | select { created_at, description, tags, type, identifier, db_id, unique_id, parent_unique_id, last_modified_at, name, org_identifier, updated_by, account_identifier, project_identifier, created_by, infrastructure_type, deleted } | limit 10
```

**Chaos Fault Template (`chaos:fault_template`)**

```sql
find entity chaos:fault_template | select { created_at, description, tags, type, identifier, db_id, unique_id, hub_identifier, last_modified_at, parent_unique_id, name, org_identifier, updated_by, is_default, account_identifier, project_identifier, created_by, revision, template_uid, yaml, infrastructure_type, deleted } | limit 10
```

**Chaos Hub (`chaos:hub`)**

```sql
find entity chaos:hub | select { created_at, description, tags, identifier, db_id, unique_id, parent_unique_id, last_modified_at, hub_id, name, org_identifier, updated_by, account_identifier, project_identifier, created_by, deleted } | limit 10
```

**Chaos K8s Infrastructure V2 (`chaos:k8s_infrastructure_v2`)**

```sql
find entity chaos:k8s_infrastructure_v2 | select { created_at, description, tags, kind, identifier, db_id, unique_id, parent_unique_id, last_modified_at, environment_identifier, name, org_identifier, updated_by, api_version, account_identifier, project_identifier, created_by, deleted } | limit 10
```

**Chaos Linux Infrastructure (`chaos:linux_infrastructure`)**

```sql
find entity chaos:linux_infrastructure | select { created_at, start_time, tags, description, db_id, infra_id, is_active, parent_unique_id, last_modified_at, unique_id, environment_identifier, name, version, is_infra_confirmed, is_registered, updated_by, org_identifier, account_identifier, project_identifier, hostname, created_by, last_heartbeat, deleted } | limit 10
```

**Chaos Probe (`chaos:probe`)**

```sql
find entity chaos:probe | select { created_at, description, tags, type, identifier, db_id, unique_id, parent_unique_id, last_modified_at, name, org_identifier, updated_by, account_identifier, project_identifier, created_by, infrastructure_type, deleted } | limit 10
```

**Chaos Probe Template (`chaos:probe_template`)**

```sql
find entity chaos:probe_template | select { created_at, description, tags, type, identifier, db_id, unique_id, hub_identifier, last_modified_at, parent_unique_id, name, org_identifier, updated_by, account_identifier, project_identifier, created_by, infrastructure_type, deleted } | limit 10
```

***

### Related concepts <a href="#related-concepts" id="related-concepts"></a>

* Go to [Harness Dashboards](/harness-ai/use-harness-platform/harness-dashboards/dashboard-legacy/dashboard-best-practices.md) to review dashboard best practices.
* Go to [RBAC in Harness](/harness-ai/use-harness-platform/platform-access-control.md) to manage dashboard permissions.