> For the complete documentation index, see [llms.txt](https://developer.harness.io/llms.txt). Markdown versions of documentation pages are available by appending `.md` to page URLs; this page is available as [Markdown](https://developer.harness.io/resilience-testing/load-testing/analyze-results.md).
# Analyze Load Test Results
Understand and interpret load test execution results in Harness Resilience Testing
After you run a load test, Harness opens the **Run detail** page and streams results in real time. The same page shows the final results after the run finishes.
***
## Access results
Go to **Resilience Testing** > **Load Tests**. The page has three tabs.
| Tab | What it lists |
| ------------------------ | ----------------------------------------------------------------------------------------------------------------------------------------------------------------------------------------------------------------------------------------------------- |
| **Executions** | Every run across all load tests, newest first. Each row reports the run identifier, **Users**, **Duration**, **Avg Response Time**, **Success Rate**, **Status**, and who started it. Filter by **Status** to isolate **Failed** or **Stopped** runs. |
| **Load Tests** | The tests themselves, with **Mode**, **Infrastructure**, recent executions, and when each was last modified. Filter by **Type** or **Tag(s)**. |
| **Composite Load Tests** | Pipelines that sequence one or more load tests, with a **No. of Load Tests** count, recent executions, and when each was last modified. Go to [Composite load tests](/resilience-testing/load-testing/composite-load-tests.md) to review them. |
To open a single run, select it from **Executions**, or open a test from **Load Tests** and choose a run from its execution list. Each execution is numbered and keeps its own results, so you can compare runs over time.
The list is sorted by **Last Executed (New -> Old)**. A run that reports **Not Available** for **Success Rate** produced no metrics, which usually means it failed or was stopped before generating load. Open the run and read its logs rather than the summary columns. **Duration** and **Users** frequently read **Not Available** and `0` even on a healthy run, because they reflect what was configured in the Load Test Studio rather than what the script did.
***
## Page anatomy
Every Load Test Engine uses the same Run detail layout, top to bottom.
* **About This Test.** The left rail, holding the test metadata and the live status of the execution. Every engine reports **Test Name**, **Load Test Infrastructure**, **Load Test Engine**, **Users**, **Duration**, **Run Started By**, **Time Elapsed**, and **Status**. The remaining fields describe how the load was distributed and vary by engine.
* **AI Insights.** A generated summary of the run, opening with a one-line verdict such as `System handled 500 concurrent users with low error rates and acceptable response times`, then a paragraph that reads the metrics together and calls out saturation points. Collapse it with the chevron.
* **Summary cards.** Six headline metrics: **Total Requests**, **RPS**, the error card, and the **P50**, **P95**, and **P99** response time percentiles in milliseconds. The error card is labeled **Failed Rate** for JavaScript (k6) and **Error Rate** for Python (Locust) and Java (JMeter), and turns red above zero.
* **Thresholds.** Each declared criterion with its **Metric**, pass/fail **Condition** such as `p(95)<5000`, the **Actual** measured value, and a **Status** that reads `PENDING` while the run is in progress. A breached threshold marks the whole run as **Failed**, which is how a load test becomes a release gate. A test with no thresholds shows an empty state instead of a table.
* **Charts.** Four time-series views, described below.
* **Load Test Logs.** An expandable **Console Logs** panel with the streamed output from the load generator. You can search it, download it, or open it full screen.
* **Endpoint Statistics.** A per-endpoint breakdown. Each row shows the **Endpoint**, **Requests**, **Fails**, a **Latency (ms)** bar marking the median (M), 95th (95), and 99th (99) percentiles, the **Avg (ms)**, and the **Current RPS**. An **Aggregated** row totals every endpoint. Use this table to find which specific endpoint is slow or failing rather than reading the whole-test averages.
## Charts
**Active Users** plots concurrent virtual users over time. Use it to confirm the load followed the shape you configured: a ramp-up from zero to the configured peak, a steady-state plateau, and a ramp-down at the end. An early drop means the run stopped or failed.
**Total Requests Per Second** plots throughput in green and errors per second in red. Read the two lines together. A rising red line while the green line flattens is a strong sign the system is at capacity.
**Response Time Distribution** is a scatter plot of individual response times, color-coded by request name and outcome, so a `Success` and a `Failure` series appear for each named request. Use it to spot latency that drifts upward as load increases and to identify which request produces the outliers.
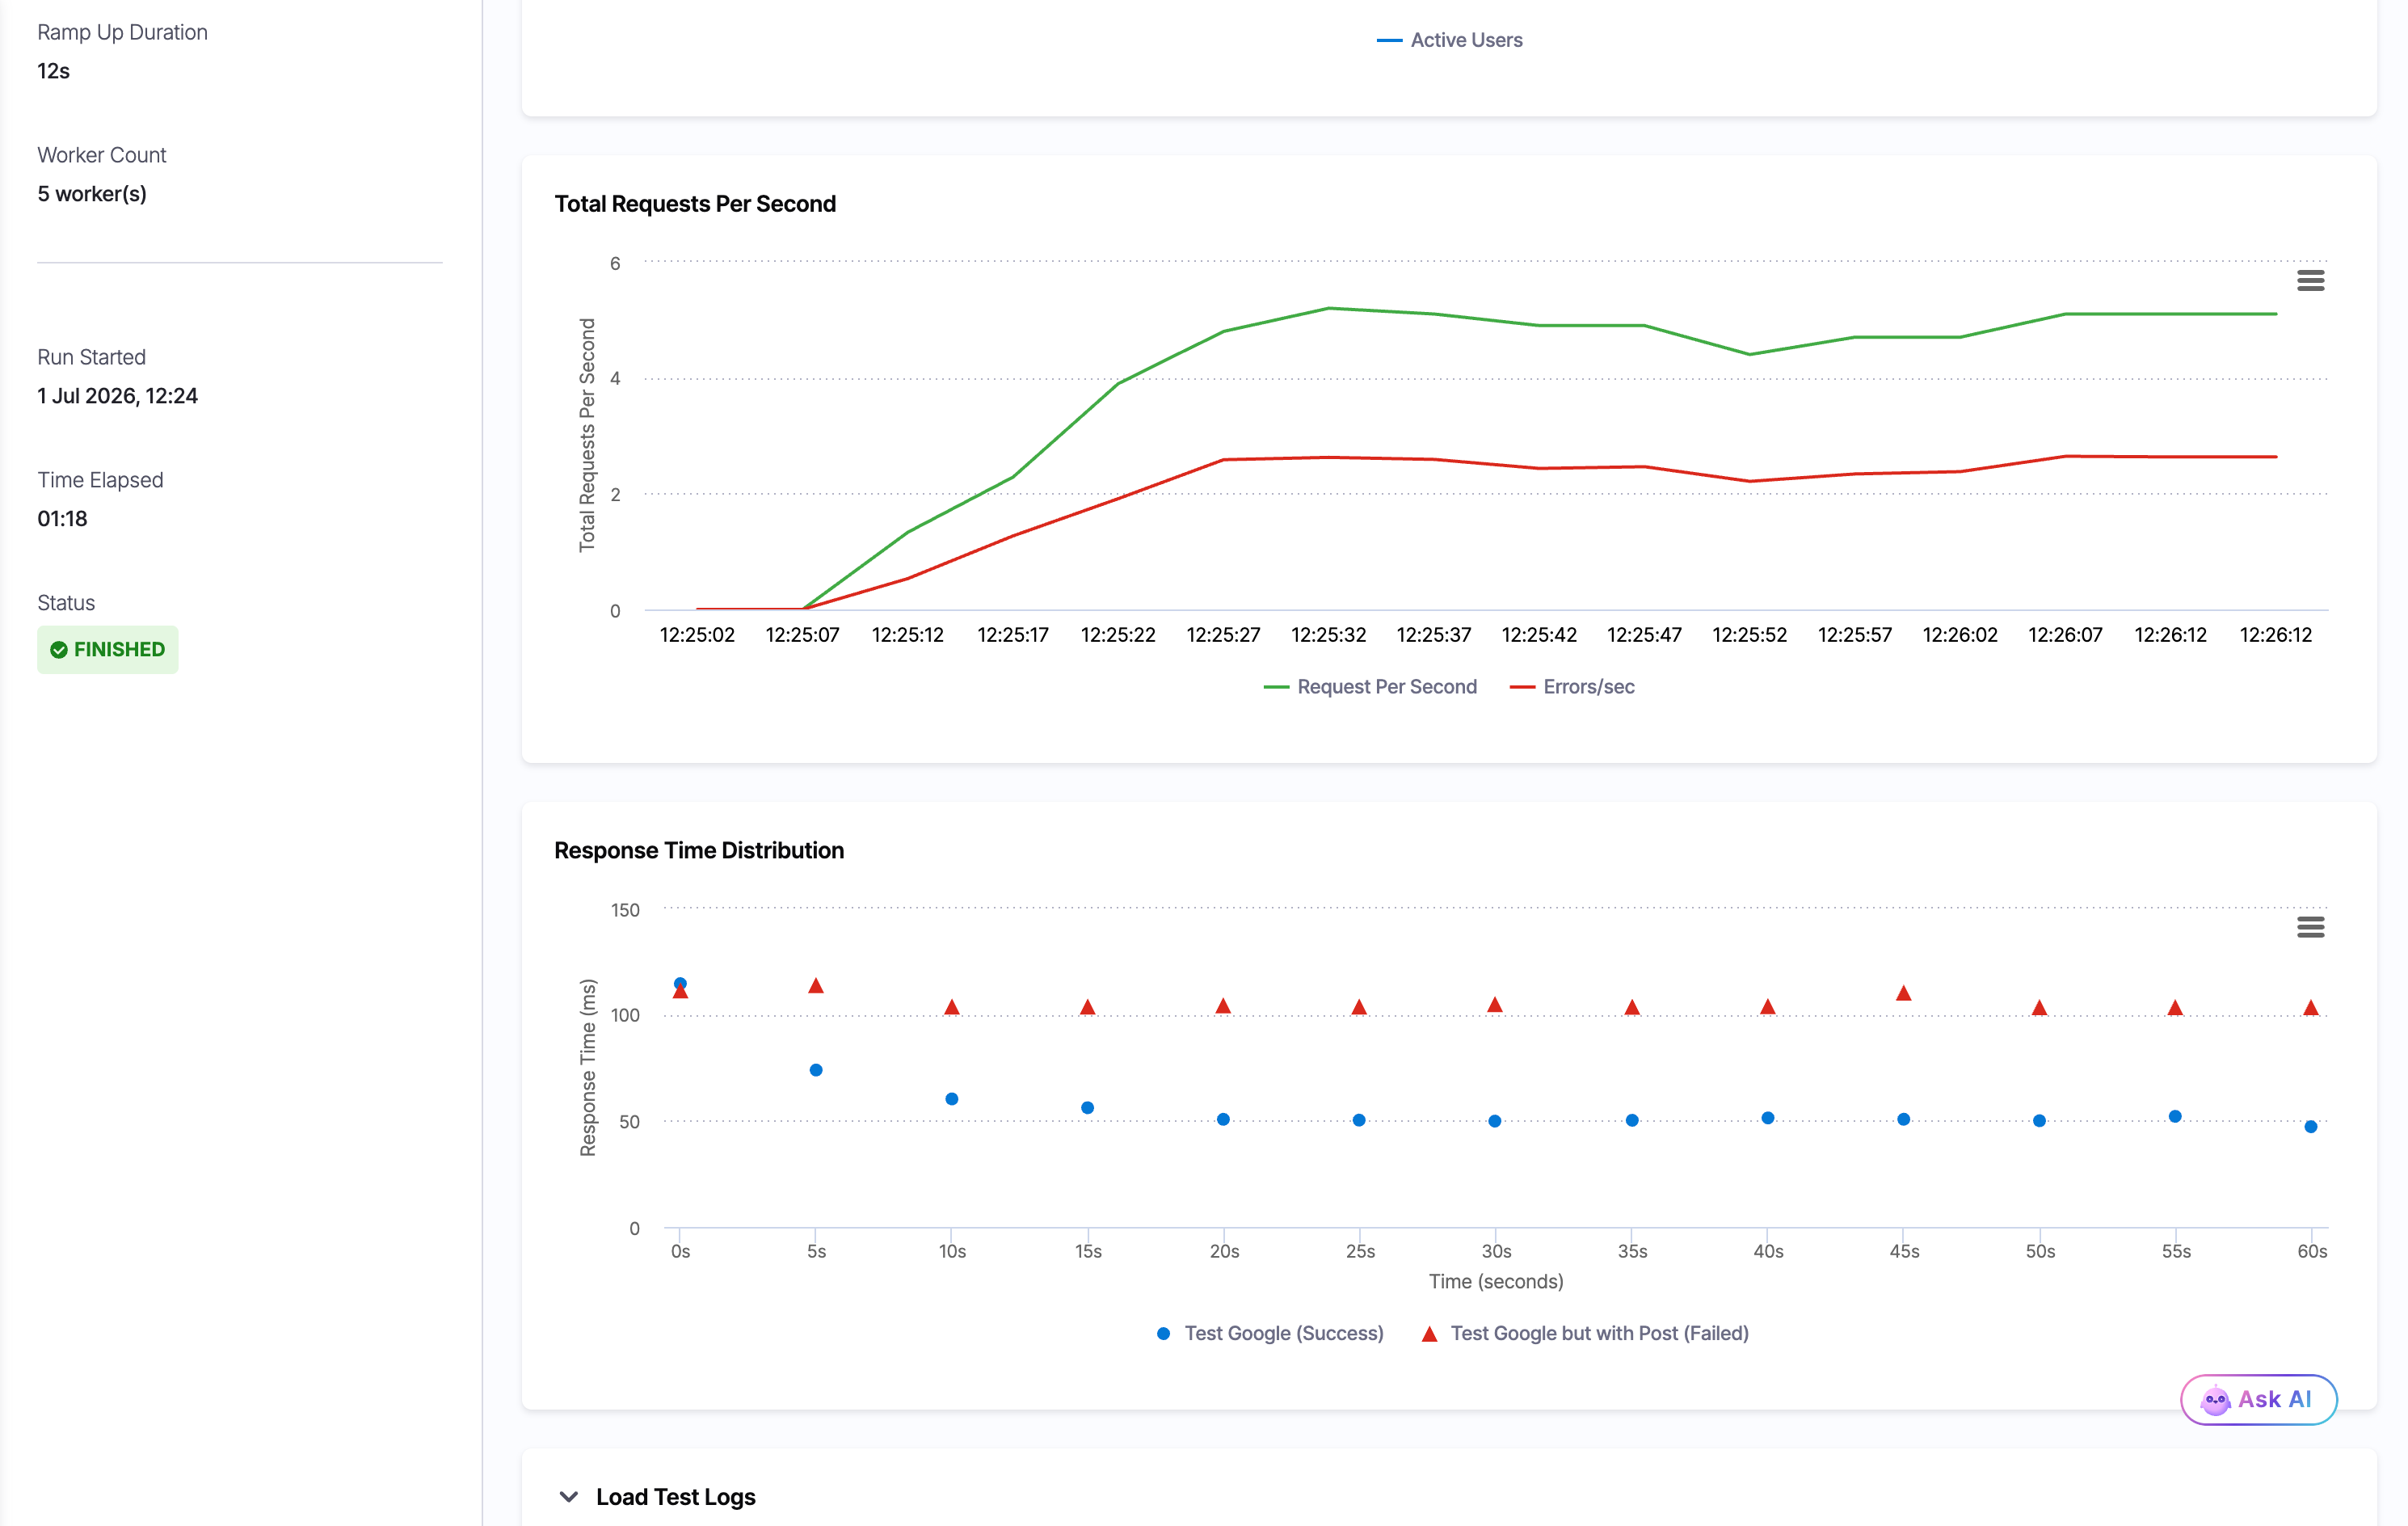
In this run the failed POST requests cluster higher in the distribution than the successful GET requests, which localizes the latency problem to one route.
**Response Time Histogram** bins the per-request response times and plots how many requests fell into each latency band. The subtitle notes that the top one percent of samples is clipped so a few slow outliers do not distort the scale. Use it to see the typical latency band and how tightly response times cluster.

***
## Engine differences
Select your engine to see the fields and tables that are specific to it.
{% @harness-package-selector/package-selector platforms="%5B%7B%22label%22%3A%22Python%22%2C%22slug%22%3A%22python%22%2C%22path%22%3A%22resilience-testing%2Fload-testing%2Fanalyze-results%2Fpython-analyze-results%22%7D%2C%7B%22label%22%3A%22JavaScript%22%2C%22slug%22%3A%22javascript%22%2C%22path%22%3A%22resilience-testing%2Fload-testing%2Fanalyze-results%2Fjavascript-analyze-results%22%7D%2C%7B%22label%22%3A%22Java%22%2C%22slug%22%3A%22java%22%2C%22path%22%3A%22resilience-testing%2Fload-testing%2Fanalyze-results%2Fjava-analyze-results%22%7D%5D" %}
***
## Interpret the results
The following guidance applies to every engine.
A healthy run holds **Error Rate** (or **Failed Rate**) at or near `0.00%`, keeps **P95** and **P99** within your SLA or performance budget, scales **RPS** with active users during ramp-up, and produces a response time distribution that clusters consistently without upward drift.
These are the patterns worth investigating.
* **Error rate climbing during ramp-up:** the system may hit capacity before reaching the target user count.
* **Response times rising over time:** a possible memory leak, connection pool exhaustion, or resource saturation.
* **Throughput plateauing while users increase:** a bottleneck is capping request processing, such as CPU, database connections, or rate limiting.
* **A wide gap between P50 and P99:** the median request is fine while the tail is not, which points at intermittent issues like garbage collection pauses, DNS delays, or cold starts.
* **One endpoint failing in Endpoint Statistics:** the problem is scoped to that route, not the whole service.
A run shows **Failed** status when:
* The test infrastructure lost connectivity during execution.
* The load test process exited with an error.
* A threshold was breached, such as the 95th-percentile response time exceeding its limit.
A run that a user ended early reports **Stopped** rather than **Failed**, and keeps whatever metrics it had gathered up to that point.
{% hint style="info" %}
**STATUS REFLECTS EXECUTION HEALTH, NOT APPLICATION HEALTH**
A high error rate does not by itself mark the run as **Failed**. A test that completes with a 100% error rate still shows as a completed run. Read the **Error Rate** or **Failed Rate** metric to assess how the application behaved, and use **Status** to confirm the test itself ran to completion.
{% endhint %}
***
## Next steps
* Go to [Get started with load testing](/resilience-testing/load-testing/get-started.md) to create and run your first load test.
* Go to [JavaScript](/resilience-testing/load-testing/create-a-load-test/k6.md#gate-a-release-with-passfail-thresholds) to declare thresholds that gate a release on performance.
* Go to [Composite load tests](/resilience-testing/load-testing/composite-load-tests.md) to pair a run with a probe that reports whether the service stayed healthy under load.
* Go to [Load testing key concepts](/resilience-testing/load-testing/key-concepts.md) to review virtual users, load profiles, and thresholds.
{% @harness-feedback/feedback %}