> For the complete documentation index, see [llms.txt](https://developer.harness.io/llms.txt). Markdown versions of documentation pages are available by appending `.md` to page URLs; this page is available as [Markdown](https://developer.harness.io/resilience-testing/load-testing/create-a-load-test/jmeter.md).
# Java
Run a Java load test based on JMeter on Kubernetes to reuse existing JMX test plans, override properties, and gate releases in Harness Resilience Testing
The **Java** Load Test Engine is based on [Apache JMeter](https://jmeter.apache.org/). It drives load from `.jmx` test plans. Use Java when you already have JMX plans you want to reuse without a rewrite, when you need protocol coverage beyond HTTP, or when you want to parameterize a plan with properties at run time. In Harness Resilience Testing, you build a Java test in the **Load Test Studio** and run it on your Kubernetes infrastructure.
{% hint style="info" %}
**JAVA RUNS ON KUBERNETES ONLY**
Java load tests run on **Kubernetes** infrastructure. When you set **Target Type** to **Linux VM**, Java is disabled and marked **Coming Soon**. To run a load test on a Linux VM today, use [Python](/resilience-testing/load-testing/create-a-load-test/locust.md).
{% endhint %}
***
## What you can do with Java
Each goal below maps to a JMeter capability you configure on this page:
* **Reuse an existing JMX plan.** [Upload a `.jmx`, `.xml`, or `.zip`](#define-the-test) and Harness runs it exactly as authored, so you do not rewrite tests you already trust.
* **Bundle data and dependencies.** Package your plan with CSV data files and JAR dependencies in a `.zip` and upload it as one artifact.
* **Parameterize without editing the plan.** Use [property overrides](#override-jmeter-properties) to change values such as thread count, ramp-up, and duration at run time, so one plan is reusable across environments.
* **Bring a packaged setup.** Reference a [custom image](#define-the-test) that already contains JMeter, plugins, and your plan.
* **Gate a release on performance.** Add [pass/fail thresholds](#gate-a-release-with-passfail-thresholds) so a regression fails the run automatically.
* **Drive very high load.** Use [distributed execution](#scale-with-distributed-execution) on Kubernetes to split the plan across worker pods for higher concurrency.
***
## Prerequisites
* **Module access:** Access to the Harness Resilience Testing module.
* **Kubernetes infrastructure:** A [Kubernetes Chaos Infrastructure](/resilience-testing/chaos-testing/infrastructure/kubernetes.md) (v1.85.3 or later) with load testing enabled. Load testing is enabled by default on Kubernetes infrastructure.
* **Environment:** An environment created in your project for the infrastructure.
* **An onboarded service:** At least one service onboarded against that infrastructure.
* **Test plan or image:** A JMeter `.jmx` test plan (or a `.zip` bundle), or a container image that contains JMeter and your plan.
* **Reachable target:** Target application endpoints accessible from the test infrastructure.
***
## Create a load test
Perform the following steps:
1. Go to **Resilience Testing** > **Load Testing**.
2. Click **+ New Load Test**, then select **Create from scratch**.
{% hint style="info" %}
**START FROM THE JAVA SAMPLE TEST**
The **+ New Load Test** menu also offers **Try Java-based Sample Test**, which arrives with a working plan and realistic load settings. Start there to see a complete JMeter run before you bring your own plan or image.
{% endhint %}
### Configure the load test overview
On the **Overview** tab, enter the test metadata, then select the infrastructure where the test runs.
| Field | Description |
| ------------------------------- | ------------------------------------------------------------------------------------------------------------------------------------------------------------------------------------- |
| **Name** | A descriptive identifier for the test. Use lowercase letters, numbers, and dashes only. Harness derives the **Id** from it. |
| **Description** | (Optional) What the test validates. |
| **Tags** | (Optional) Labels to organize tests. |
| **Target Type** | Select **Kubernetes**. The agent in the cluster runs JMeter as a master pod and optional worker pods for load generation. |
| **Load Test Infrastructure** | Select a Kubernetes Chaos Infrastructure from the dropdown. Go to [Kubernetes Infrastructure](/resilience-testing/chaos-testing/infrastructure/kubernetes.md) for setup instructions. |
| **Resilience Testing Services** | Select at least one onboarded service the test targets. This section appears once the infrastructure is set. |
| **Load Test Engine** | Select **Java** (Based on jmeter). |
**Select the services under test**
The **Services** section appears after you choose an infrastructure, and it is required. The picker lists only the services onboarded against that infrastructure, so a test cannot reference a workload the infrastructure does not manage.
If that infrastructure has no onboarded services, the section reads **No resilience testing services yet** and offers **Onboard a Service**. You cannot continue until at least one exists, because Harness reports load results against the service rather than against the test alone.
Click **Next** to proceed to **Test Configuration**.
### Define the test
On the **Test Configuration** tab, choose how you want to define the test workload. JMeter supports two modes: upload a test plan, or reference a custom container image.
{% tabs %}
{% tab title="Upload JMX / XML / ZIP" %}
Upload an existing JMeter test plan. Harness runs it exactly as uploaded, so the plan behaves the same as it does in JMeter.
| Field | Description |
| -------------------- | ----------------------------------------------------------------------------------------- |
| **Upload Test Plan** | Drag and drop or browse to upload a `.jmx`, `.xml`, or `.zip` file. Maximum size is 1 MB. |
Use a `.zip` to bundle the plan with the files it depends on. A `.zip` can include the `.jmx` plan plus CSV data files (for the CSV Data Set Config element) and any JAR dependencies your plan needs.

*The Upload JMX / XML / ZIP mode. Upload your `.jmx`, `.xml`, or `.zip` plan, then override plan properties such as threads, rampup, and duration without editing the file.*
{% endtab %}
{% tab title="Using Custom Image" %}
Use a prebuilt container image as the load test source. The image must contain JMeter and your test plan. This is useful when you maintain a packaged JMeter setup, with plugins and dependencies, outside Harness. Each value can be a fixed value or a runtime input.
| Field | Description |
| ----------------------- | --------------------------------------------------------------------------------------------------------------------------- |
| **Load Test Image** | Container image reference (for example, `my-registry/my-load-test:latest`). |
| **Entrypoint** | Path to the `.jmx` test plan inside the image (for example, `test.jmx`). |
| **Load args** | Additional arguments passed to the JMeter command (for example, `proxyHost=10.0.0.1;proxyPort=8080`). |
| **Image Registry Type** | Select **Public** for an image anyone can pull, or **Private** to pull with credentials. |
| **Secret Name** | The Kubernetes image pull secret used to authenticate. This field appears only when **Image Registry Type** is **Private**. |
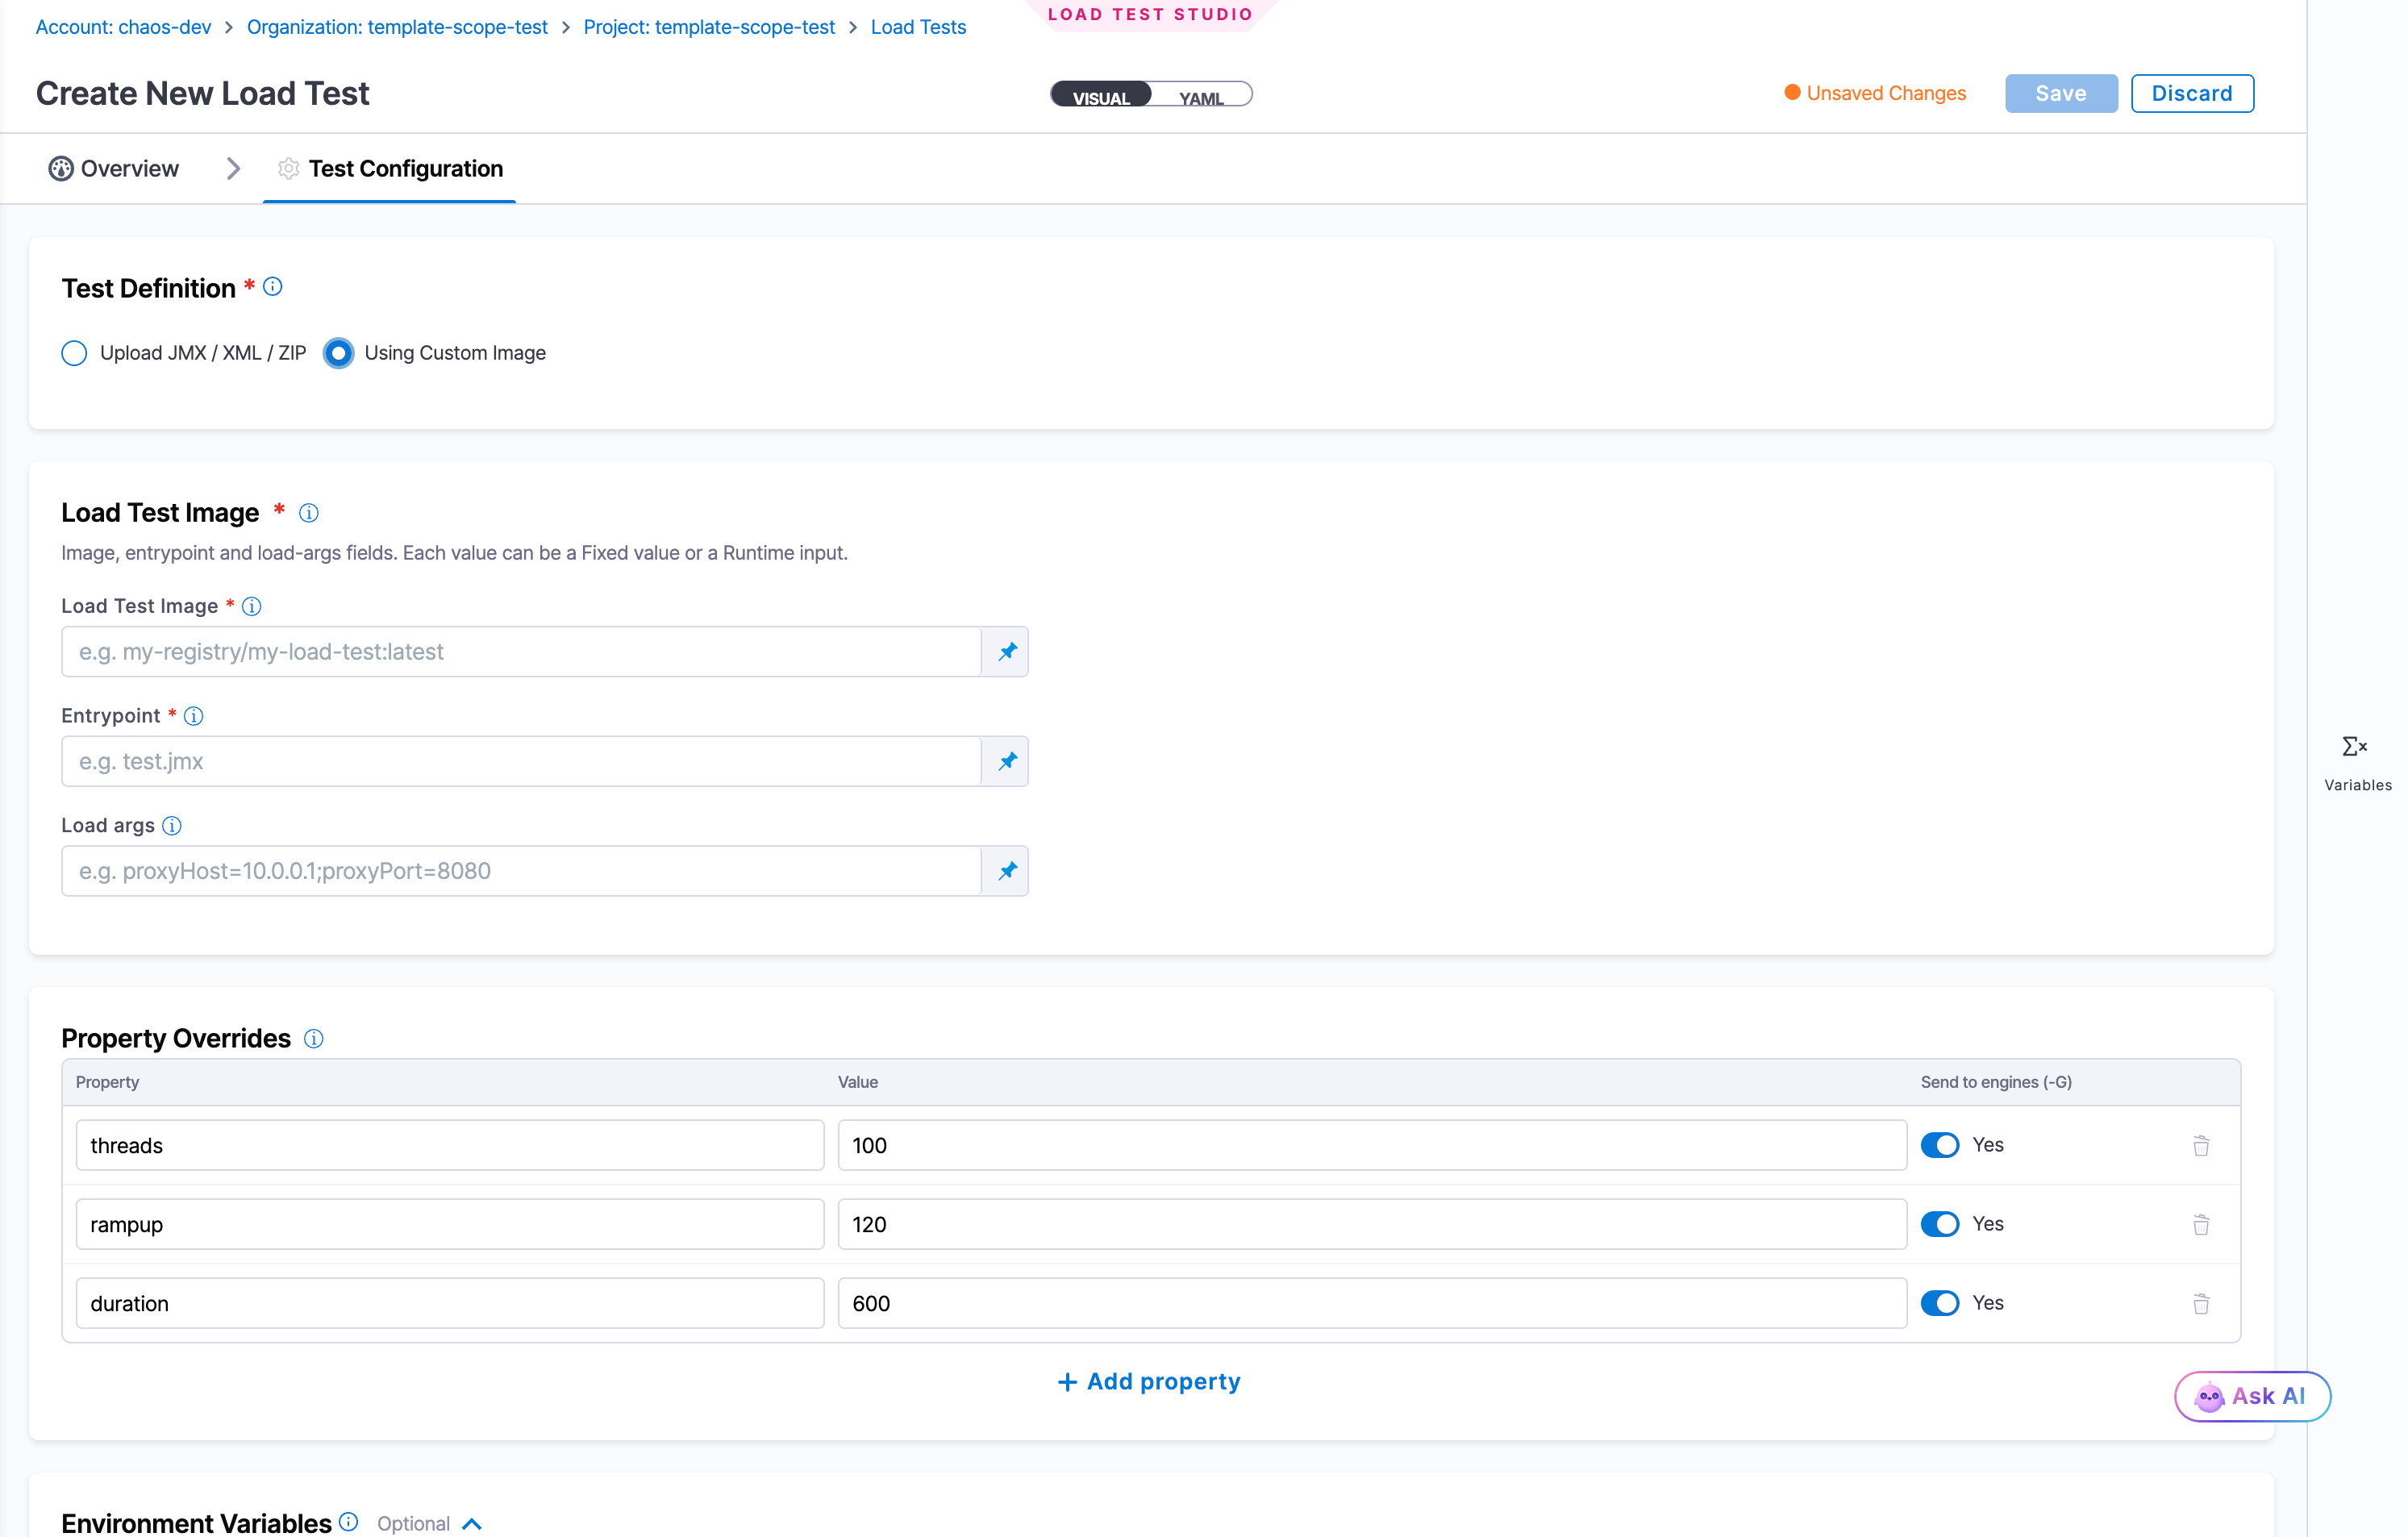
*The Using Custom Image mode. Provide the container image, the entrypoint path to your `.jmx` plan, and optional load args. Each value can be a fixed value or a runtime input.*
{% endtab %}
{% endtabs %}
***
## Override JMeter properties
Property overrides pass JMeter properties into the run without editing the plan, so a single plan works across environments and workloads. In the plan, reference each property with `${__P(name)}`, for example `${__P(threads)}` on a Thread Group's number of threads.
Add one row per property in the **Property Overrides** table:
| Field | Example | Description |
| ------------------------ | --------- | ----------------------------------------------------------------------------------------------------------------------------------------------------------------------------- |
| **Property** | `threads` | The JMeter property name referenced in the plan. |
| **Value** | `100` | The value to pass at run time. Pin the field to supply it when the test runs. |
| **Send to engines (-G)** | Yes | When on, the property is sent to remote engines with the `-G` flag so it applies to every worker in a distributed run. Turn it off for properties that only the master needs. |
Select **+ Add property** to define more overrides. Common properties are `threads` (concurrent users), `rampup` (seconds to reach peak threads), and `duration` (total run time in seconds), but you can override any property your plan reads with `${__P(...)}`.
{% hint style="info" %}
**KEEP THE PLAN ENVIRONMENT-AGNOSTIC**
Put host names, credentials, and load shape behind properties (or [environment variables](#tune-pods-with-advanced-options)) instead of hardcoding them in the `.jmx`. One uploaded plan then serves staging and production with different override values.
{% endhint %}
***
## Gate a release with pass/fail thresholds
Thresholds turn a load test into a gate. Add pass/fail criteria on metrics so Harness evaluates the JMeter run automatically when it finishes. If any threshold fails, the run is marked **Failed**, which makes JMeter suitable for release gates in continuous integration and for [run in a pipeline](/resilience-testing/load-testing/run-in-a-pipeline.md) stages that must stop a promotion on a regression.
The **Thresholds** section is marked *Optional (but recommended)*. Select **+ Add threshold** to add a row, which Harness prefills with `Response time (ms)` / `p95` / `<` / `5000`.
| Column | What to set |
| ----------------- | --------------------------------------------------------------------------------------------------------------------------------- |
| **Metric** | **Response time (ms)**, **Error rate (%)**, or **Throughput (req/s)**. |
| **Stat** | The statistic to evaluate the metric on: **p95**, **p99**, **avg**, **median**, or **max**. |
| **Operator** | `<`, `<=`, `>`, or `>=`. |
| **Value** | The limit that must hold for the run to pass. This field carries a pin control, so the limit can be a runtime input. |
| **Abort on Fail** | Off by default. Turn it on to stop the run the moment the threshold is breached, rather than finishing and reporting the failure. |
Harness evaluates these thresholds itself, against the metrics it collected, so they do not depend on anything in the uploaded plan. Without them, a run still reports metrics on the results page, but it never fails on a performance regression, so a pipeline that only checks whether the step finished can promote a slower or error-prone build.
Use thresholds together with [property overrides](#override-jmeter-properties) when the same plan runs at different load levels: keep the gate fixed (for example, error rate under 1 percent) and change `threads` or `duration` per environment.
***
## Scale with distributed execution
When a single instance cannot generate enough load, distributed execution runs the plan across multiple worker pods on Kubernetes. Set the number of **Workers** in the **Distributed Execution** section.
| Workers | Behavior |
| ------------- | -------------------------------------------------------------------------- |
| **0 or 1** | Single-worker mode (standalone). The plan runs on one instance. |
| **2 or more** | The load is distributed across worker pods. Use this for high concurrency. |
For distributed runs, keep **Send to engines (-G)** on for any [property override](#override-jmeter-properties) that every worker must use.
Rather than guessing at a worker count, select **Suggest** beside **Workers**. Harness estimates the fleet it would take to drive the load you configured and reports the number, which resource limited the estimate, and how many users it expects to fit per worker. Expand **Calculation** to see the assumptions, then select **Apply** to write the number into the field. On a test that has never run, the estimate assumes default per-worker resources and a nominal request rate per user; run the plan once and the next suggestion uses the measured rate instead.
***
## Set a value at run time
Every tool input carries a pin control at the end of the field. Select it to switch the field between **Fixed value** and **Runtime input**.
A fixed value is stored with the test and used on every run. A runtime input leaves the field unset, so the value is supplied when the test runs, which lets one plan serve several environments or load levels. Go to [Run a load test in a pipeline](/resilience-testing/load-testing/run-in-a-pipeline.md) to supply these values from a pipeline.
***
## Define variables
**Variables** is a drawer on the right edge of the Load Test Studio. A variable holds a value once and supplies it to the tool inputs, so a value such as a host name or a thread count lives in one place instead of being repeated across fields.
Select **+ Add Variable** and complete the **New Variable** dialog:
| Field | Description |
| --------------- | ------------------------------------------------------------------------------------------------------------------------ |
| **Type** | **String**, **Number**, or **Secret**. Use **Secret** for credentials so the value is not stored in the test definition. |
| **Name** | The variable name. |
| **Value** | The value to use. This field carries its own pin control, so a variable can itself be a runtime input. |
| **Description** | (Optional) What the variable is for. |
Select **Save** to add the row, then **Apply Changes** to keep the drawer's edits. The drawer lists each variable with its **Variable**, **Description**, and **Value**.
Variables and [property overrides](#override-jmeter-properties) solve different problems. A property override feeds a value into the JMeter plan through `${__P(name)}`, while a variable supplies a value to the Load Test Studio fields around it.
***
## Tune pods with advanced options
**Advanced Options** is a drawer on the right edge of the Load Test Studio, available on the **Test Configuration** tab. It controls how the load pods behave and what the plan receives.
| Setting | Default | What it does |
| --------------------------- | ------- | ---------------------------------------------------------------------------------------------------------------------------------------------------------------------- |
| **Clean-up Load Resources** | On | Deletes the pods, configmaps, and secrets a run created once the run finishes. Turn it off to keep those resources for debugging, and remove them yourself afterwards. |
| **Resource Requirements** | Off | Sets CPU and memory requests and limits on the master and worker pods. Turn it on when a run is throttled or evicted, or when your cluster enforces quotas. |
| **Environment Variables** | None | Passes configuration and secrets into the test without hardcoding them in the plan. Set **SECRET** to encrypt a value at rest. |
Select **Apply Changes** to keep your edits, or **Discard** to close the drawer without saving.
{% hint style="info" %}
**GIVE WORKERS HEADROOM BEFORE BLAMING THE TARGET**
A distributed run whose workers are CPU-starved reports high response times that come from the load generators, not the system under test. If throughput plateaus as you add workers, set **Resource Requirements** before concluding the target is the bottleneck.
{% endhint %}
***
## Save and run the test
Perform the following steps:
1. Click **Save** to create the load test.
2. Find your test on the **Load Tests** tab, which lists each test with its **Mode**, **Infrastructure**, recent executions, and when it was last modified.
3. Click the **Run** (▶) button to start an execution.
4. Monitor real-time results during execution. A breached threshold marks the run as Failed.
***
## Next steps
* Go to [Analyze load test results](/resilience-testing/load-testing/analyze-results.md) to interpret throughput, error rate, response times, and threshold outcomes.
* Go to [Python](/resilience-testing/load-testing/create-a-load-test/locust.md) to run a Python-based test on Linux VM or Kubernetes.
* Go to [JavaScript](/resilience-testing/load-testing/create-a-load-test/k6.md) to run a JavaScript-based test with thresholds on Kubernetes.
* Go to [Composite load tests](/resilience-testing/load-testing/composite-load-tests.md) to run this test alongside a probe that measures health while the load is applied.
* Go to [Load testing key concepts](/resilience-testing/load-testing/key-concepts.md) to review virtual users, load profiles, and thresholds.
{% @harness-feedback/feedback %}