> For the complete documentation index, see [llms.txt](https://developer.harness.io/llms.txt). Markdown versions of documentation pages are available by appending `.md` to page URLs; this page is available as [Markdown](https://developer.harness.io/resilience-testing/shared-capabilities/custom-dashboards.md).
# Dashboards
Use out-of-the-box dashboards and build your own custom dashboards in the Harness Resilience Testing module
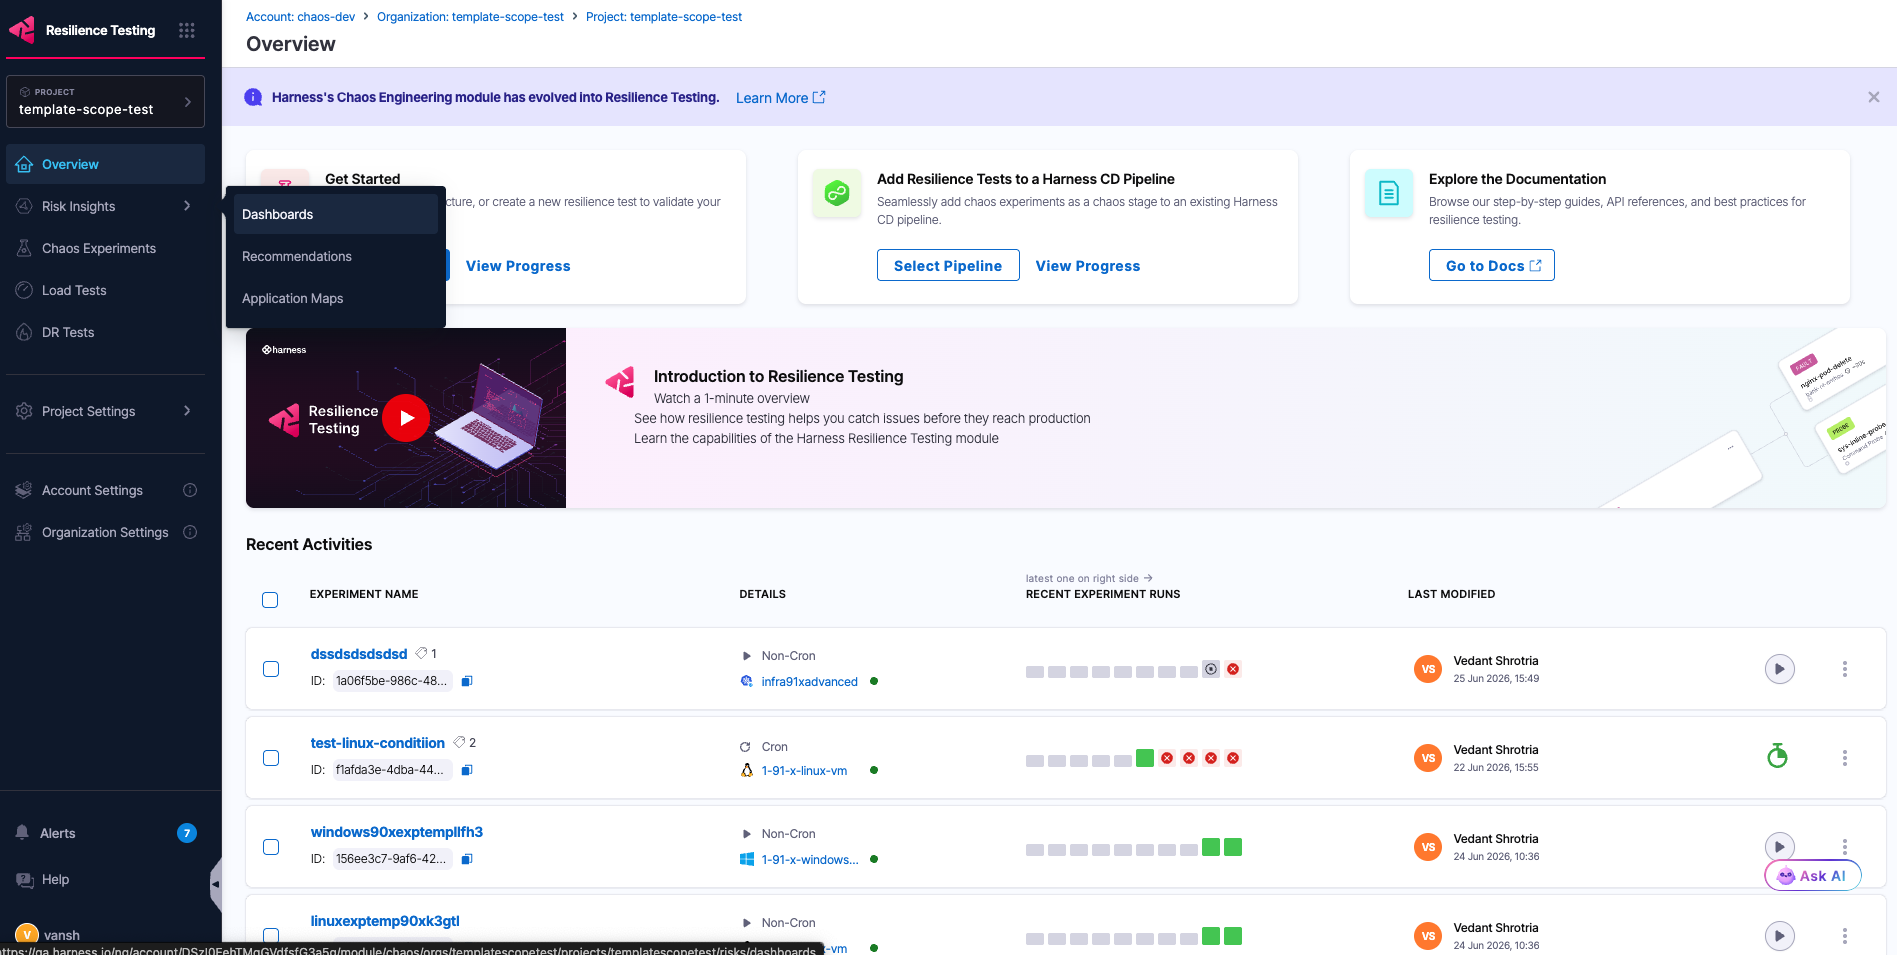
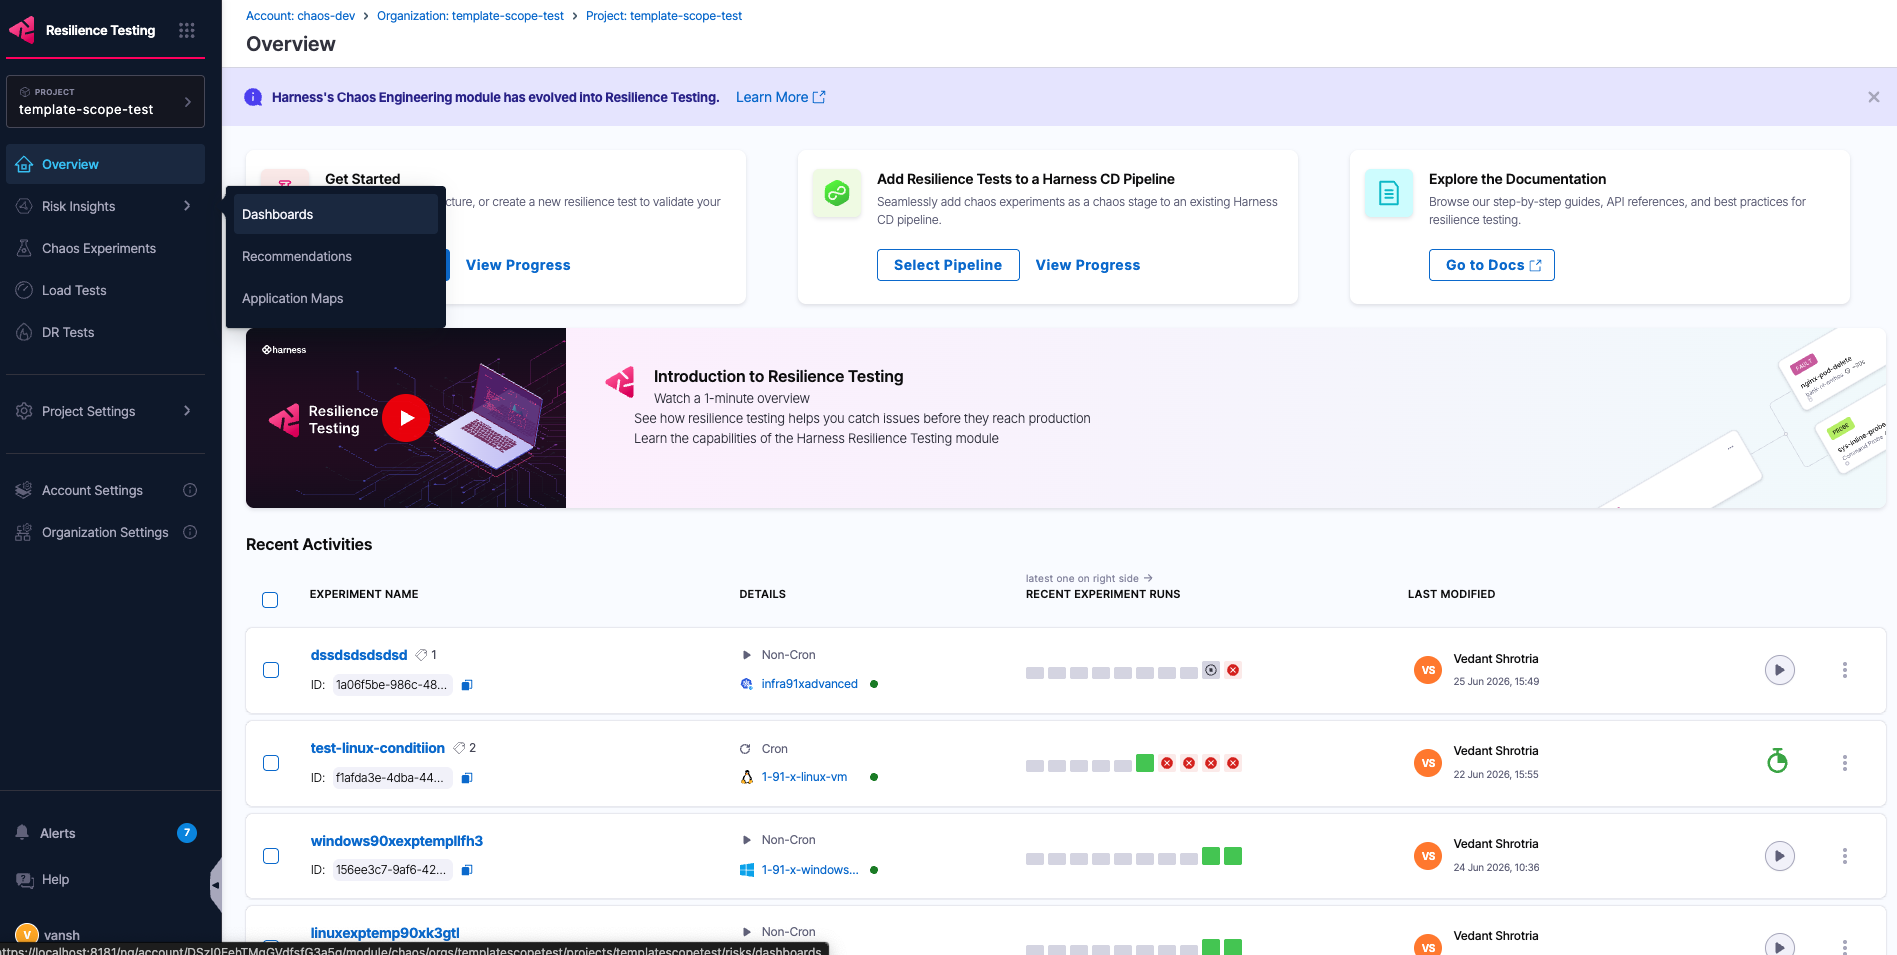
The Resilience Testing (RT) module provides dashboards that visualize key metrics from your chaos testing operations. You access them under the **Dashboards** section of the **Insights** left navigation.
The module ships with out-of-the-box (OOTB) dashboards for a high-level view of chaos testing across an account, and you can also build your own custom dashboards from Harness Unified Data Platform (UDP) queries.
Click to view full size
*The Dashboards item under Insights in the Resilience Testing module.*
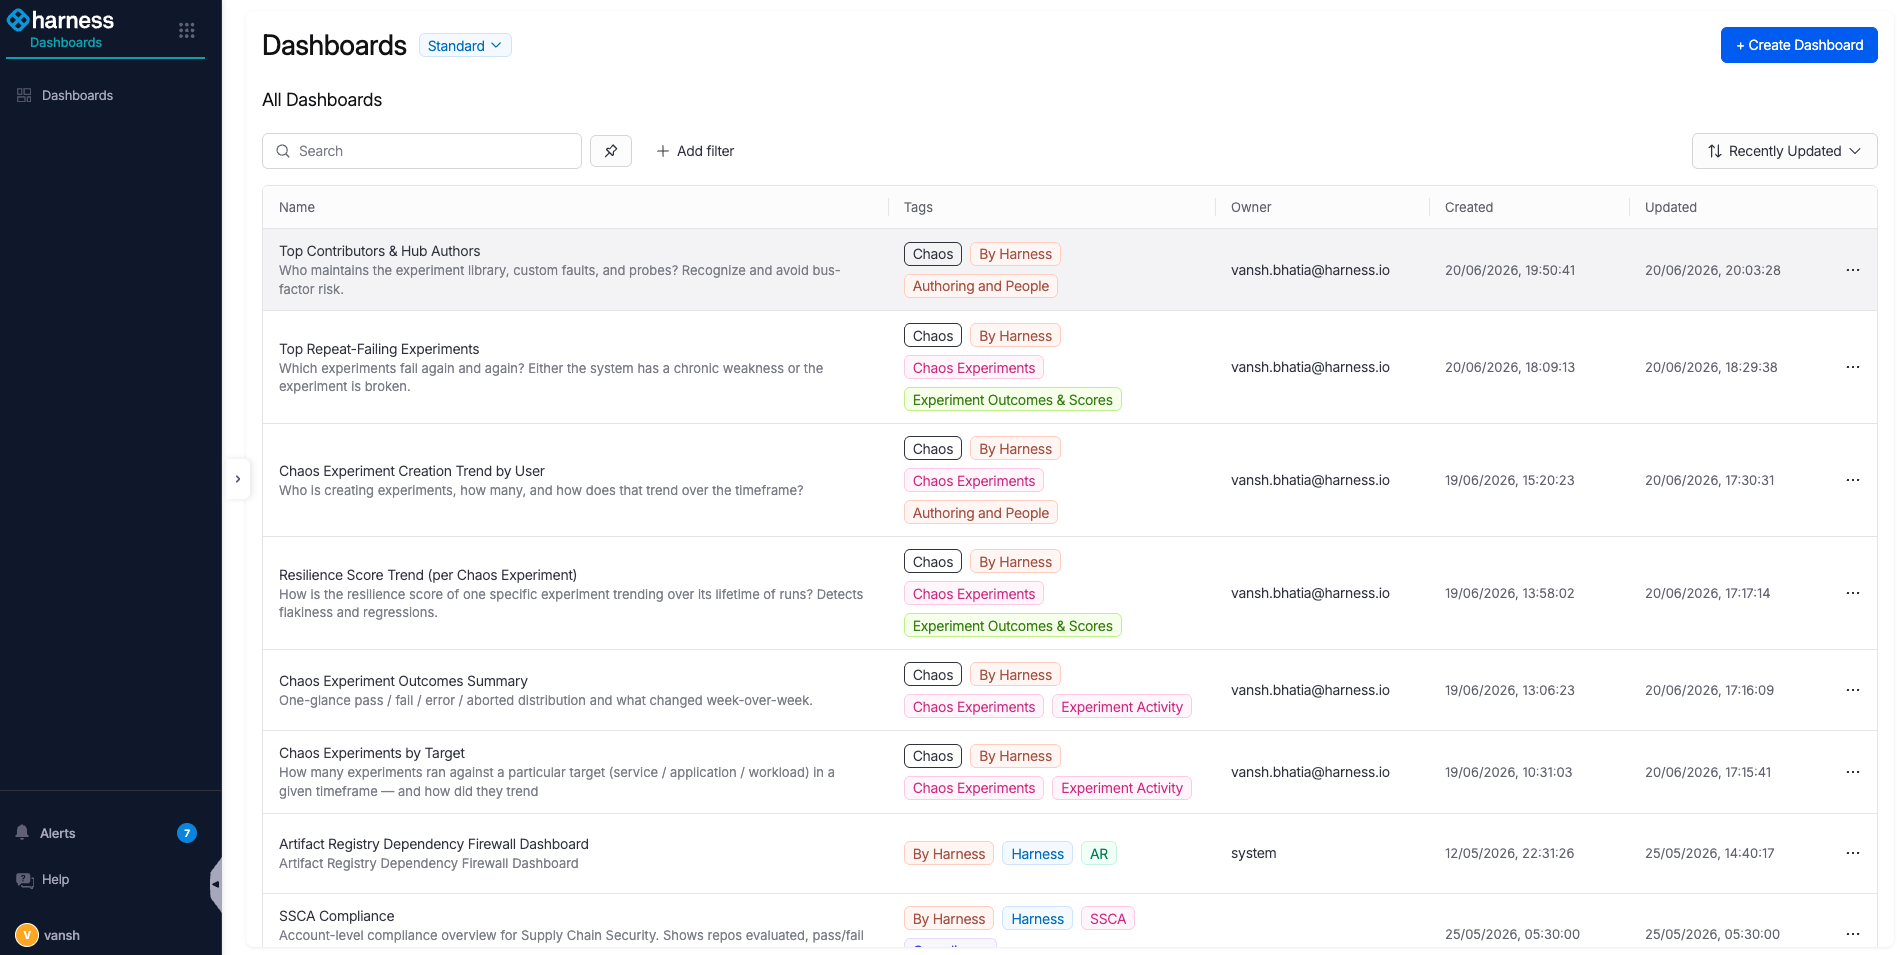
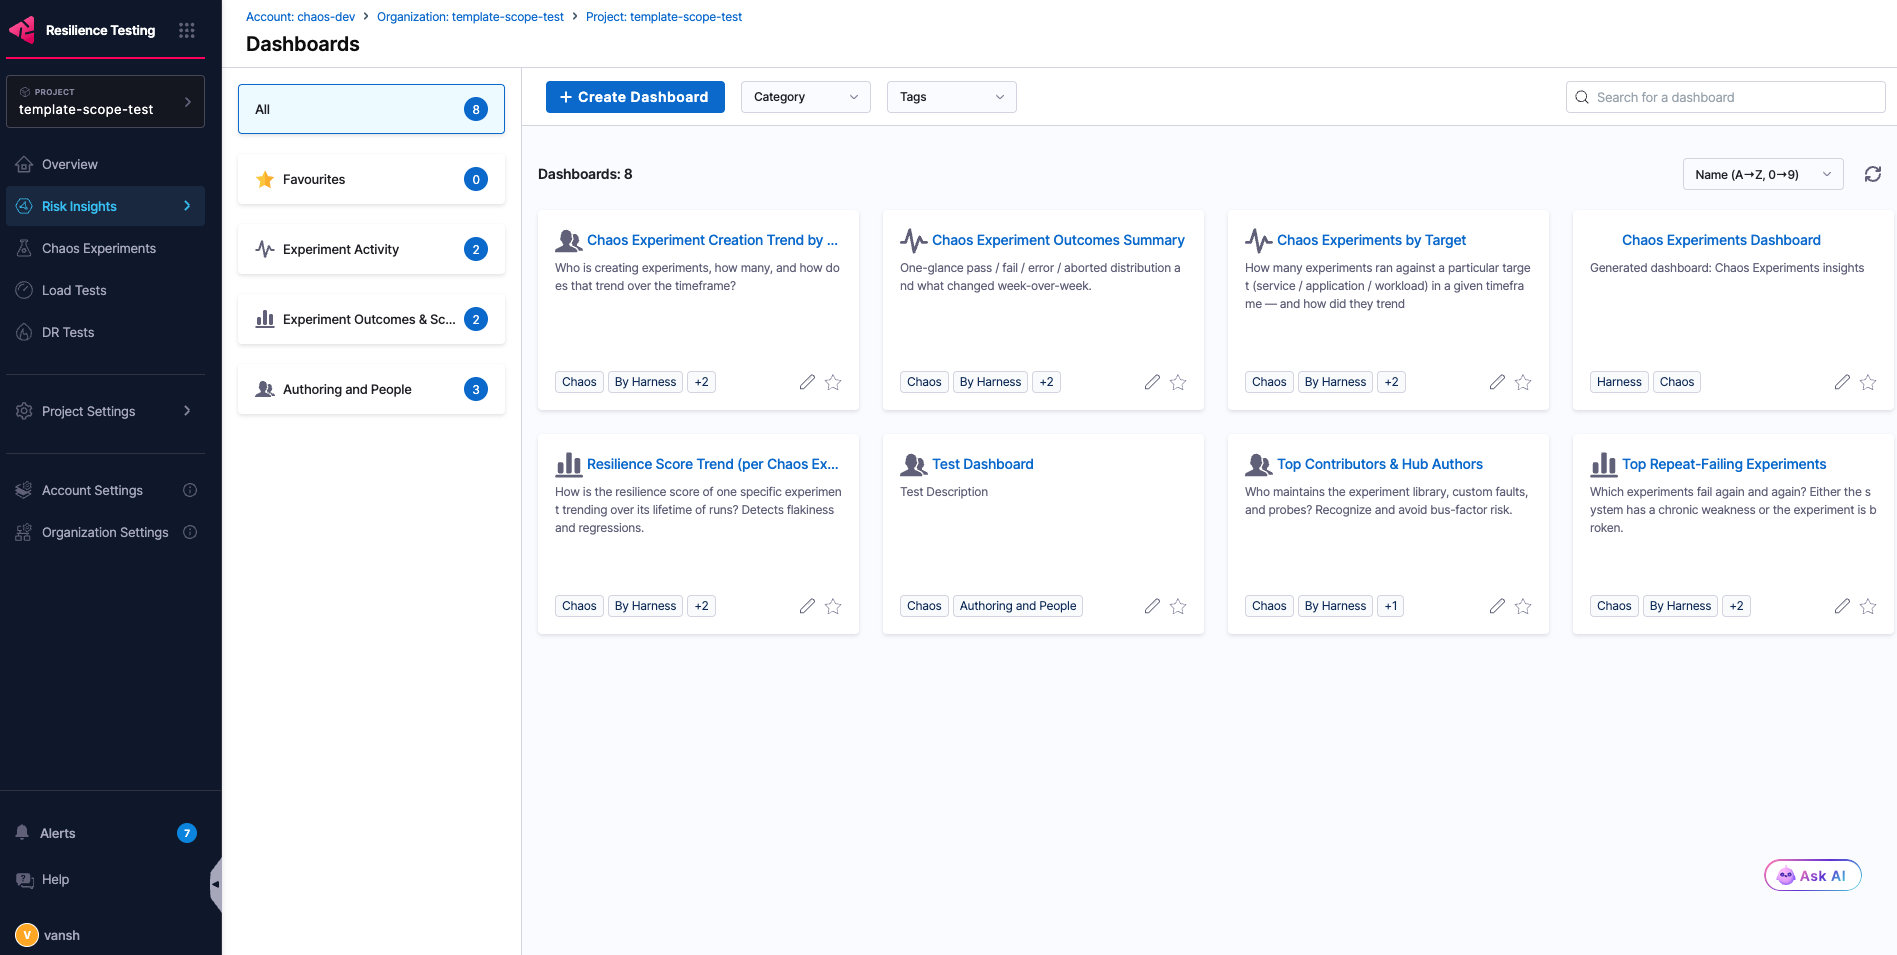
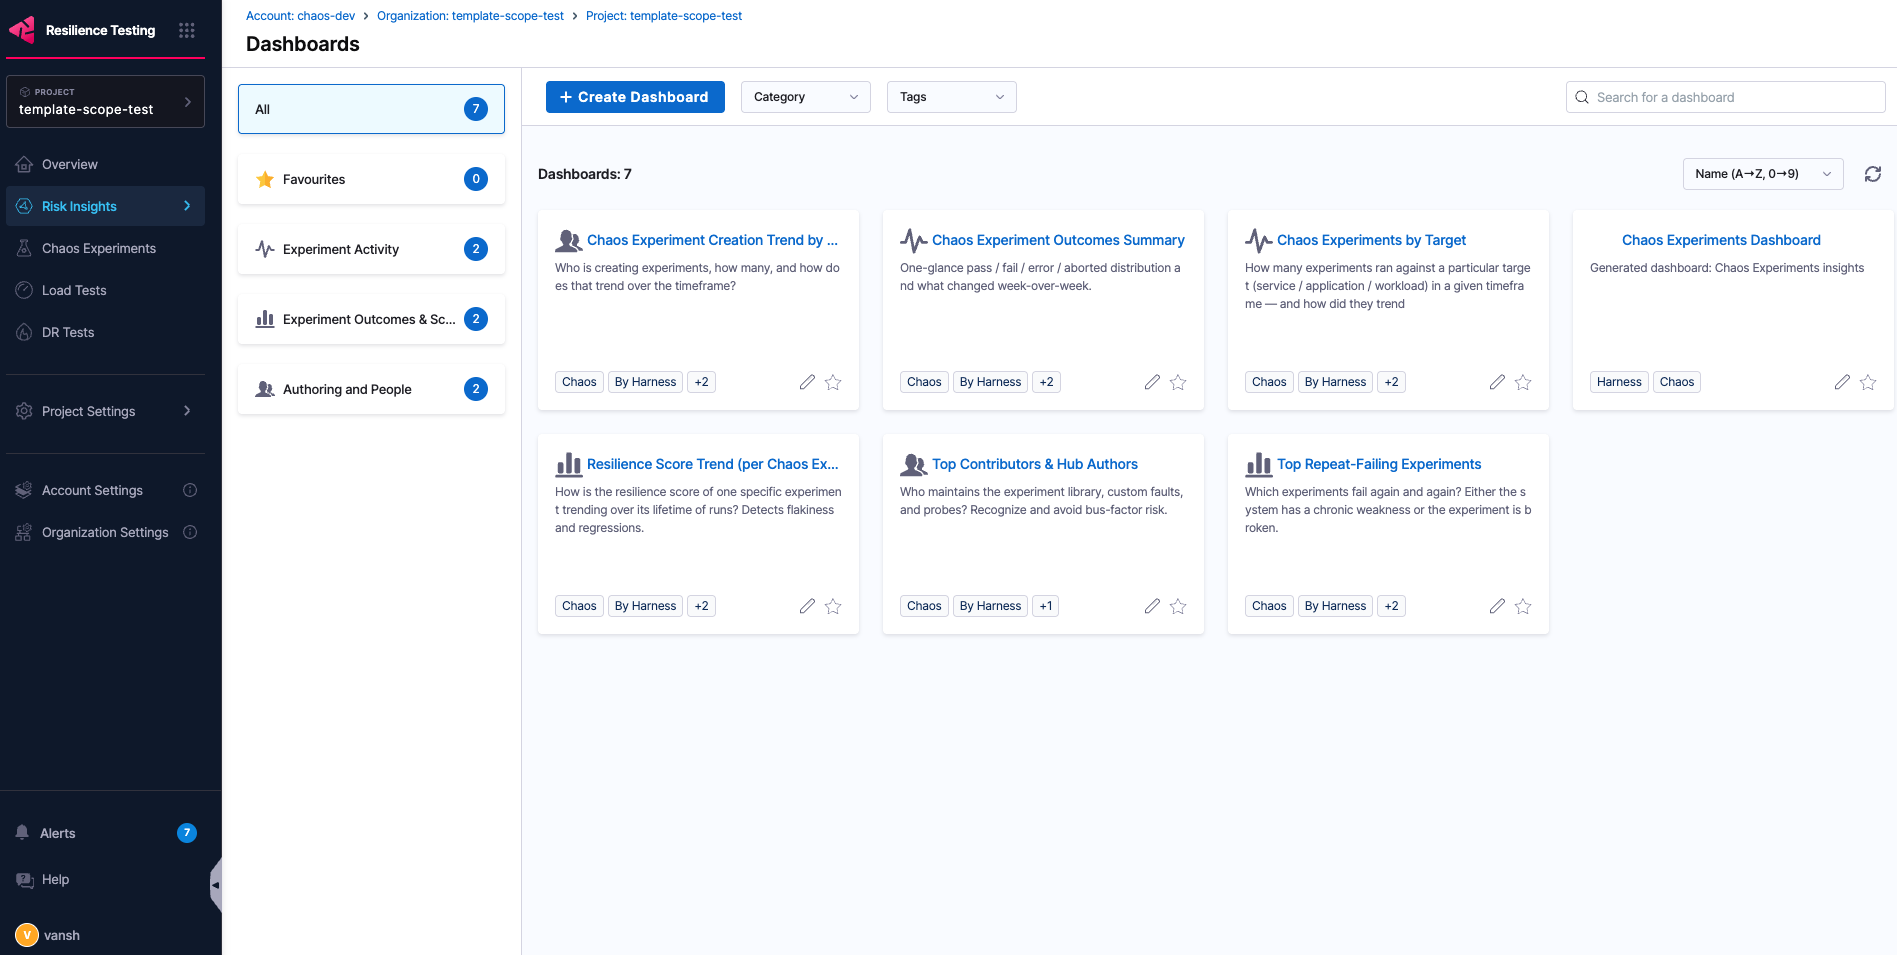
Selecting **Dashboards** opens the dashboards landing page.
Click to view full size
***
## Out-of-the-box dashboards
The OOTB dashboards fall under three categories:
* **Experiment Activity**
* **Experiment Outcomes & Scores**
* **Authoring & People**
The following dashboards ship out of the box:
| Dashboard | Category | Key widgets |
| ------------------------------------------------- | ---------------------------- | ------------------------------------------------------------------------------------------------------------------------------------------------------------------------------------------------------------------------------------------------------------------------------------- |
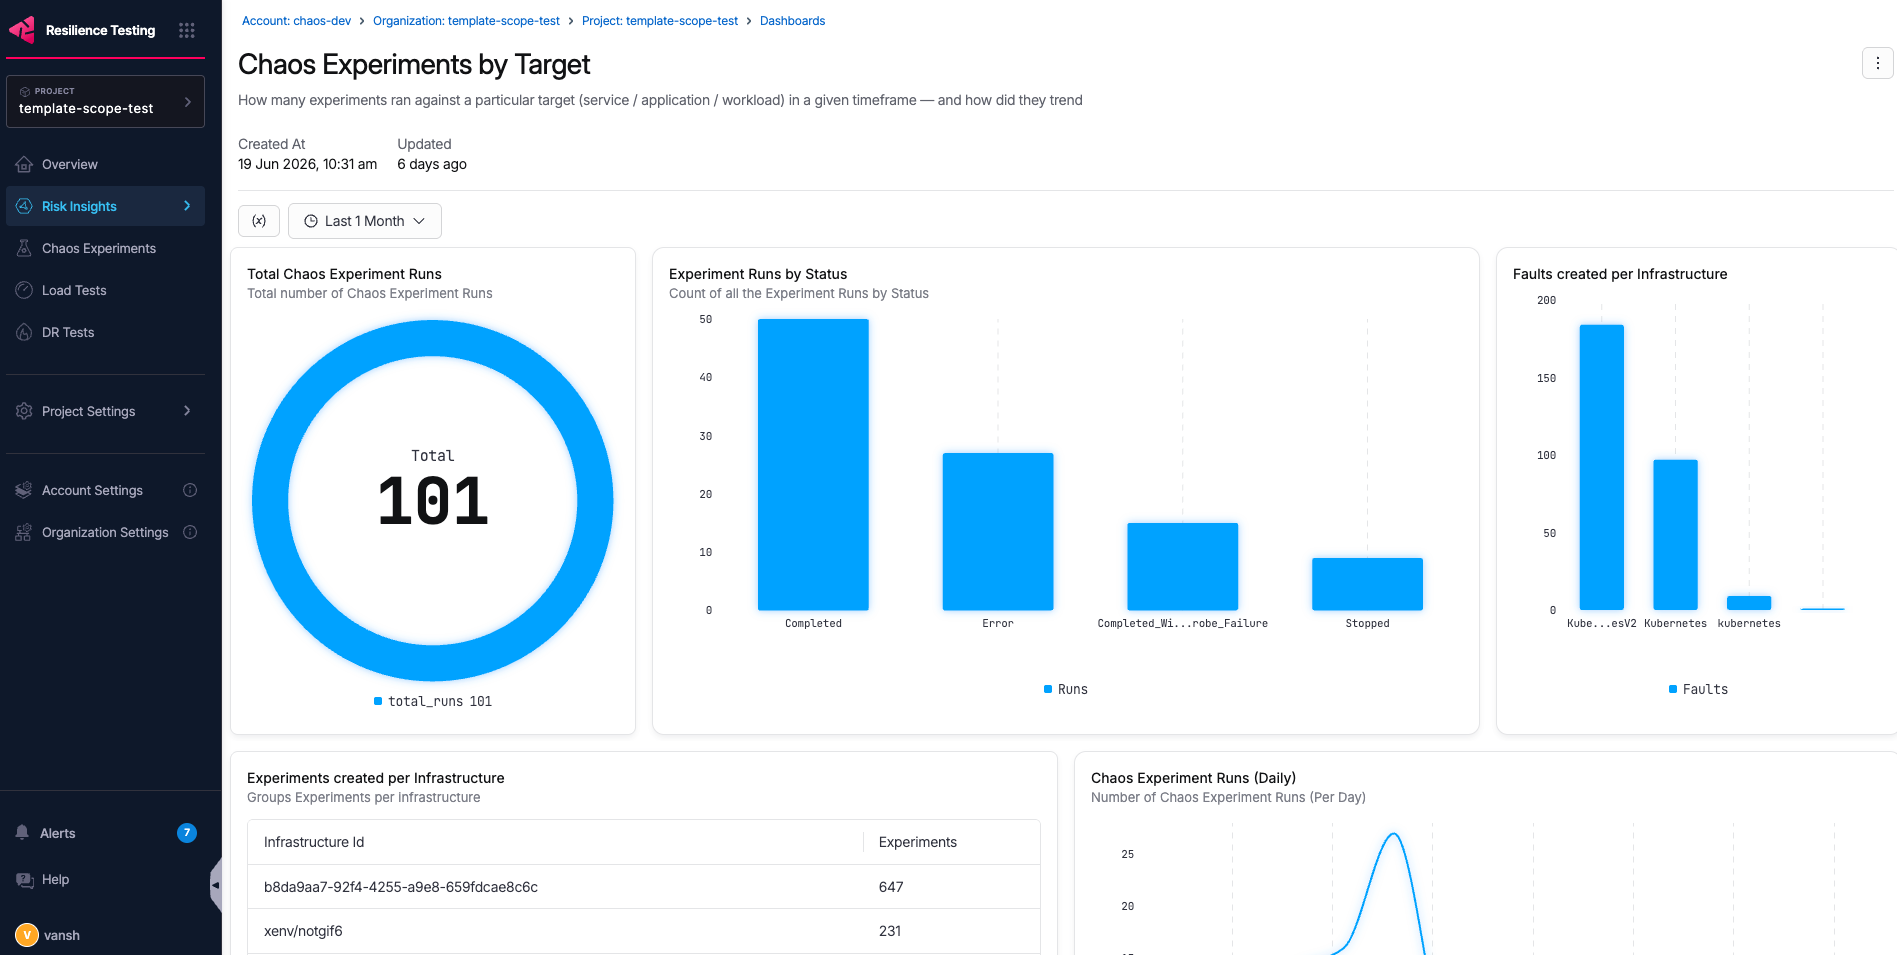
| **Chaos Experiments by Target** | Experiment Activity | Total Chaos Experiment Runs, Experiment Runs by Status, Faults created per Infrastructure, Experiments created per Infrastructure, Chaos Experiment Runs (Daily/Weekly), Experiment Runs per Chaos Experiment, Average & Median Resilience score, Chaos Experiment Runs (Project/Org) |
| **Chaos Experiment Outcomes Summary** | Experiment Activity | Total Chaos Experiment Runs, Chaos Experiment Outcome Distribution, Weekly Chaos Experiment Run Trend, Chaos Experiment Run Outcomes (Project/Org/Infrastructure) |
| **Resilience Score Trend (per Chaos Experiment)** | Experiment Outcomes & Scores | Chaos Experiment Run trend, Latest Run (Per Experiment), Chaos Experiment Pass Rate, Experiment Resilience score variance |
| **Top Repeat-Failing Experiments** | Experiment Outcomes & Scores | Repeat-failing experiments, Repeat failing experiments (User) |
| **Chaos Experiment Creation Trend by User** | Authoring & People | Chaos Experiments created by users, Experiment creation per user (weekly), Chaos experiment creation (new users), Chaos Experiment Runs Creation (User) |
| **Top Contributors & Hub Authors** | Authoring & People | Top Actions Contributors, Top Probe contributors, Top Hub contributors, Top Probe creation by Probe type |
The following is an example OOTB dashboard:
Click to view full size
***
## Create a custom dashboard
You can create your own dashboards to visualize the metrics that matter to your team. Perform the following steps.
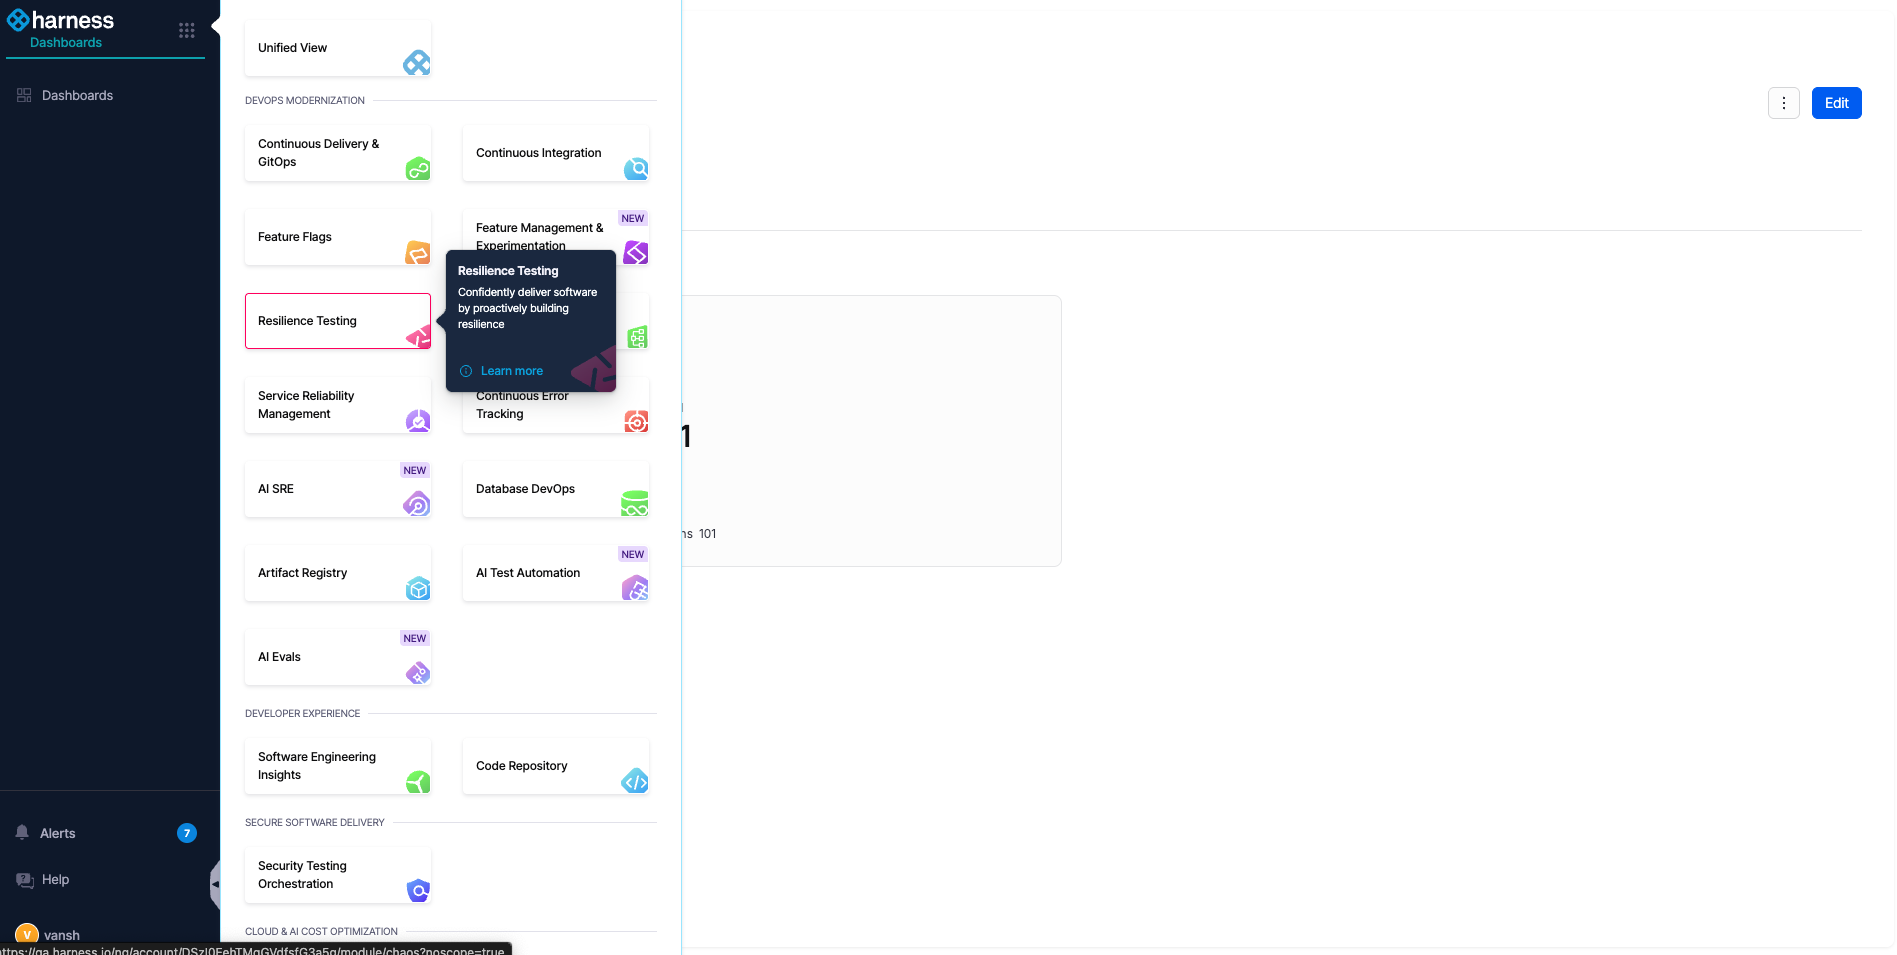
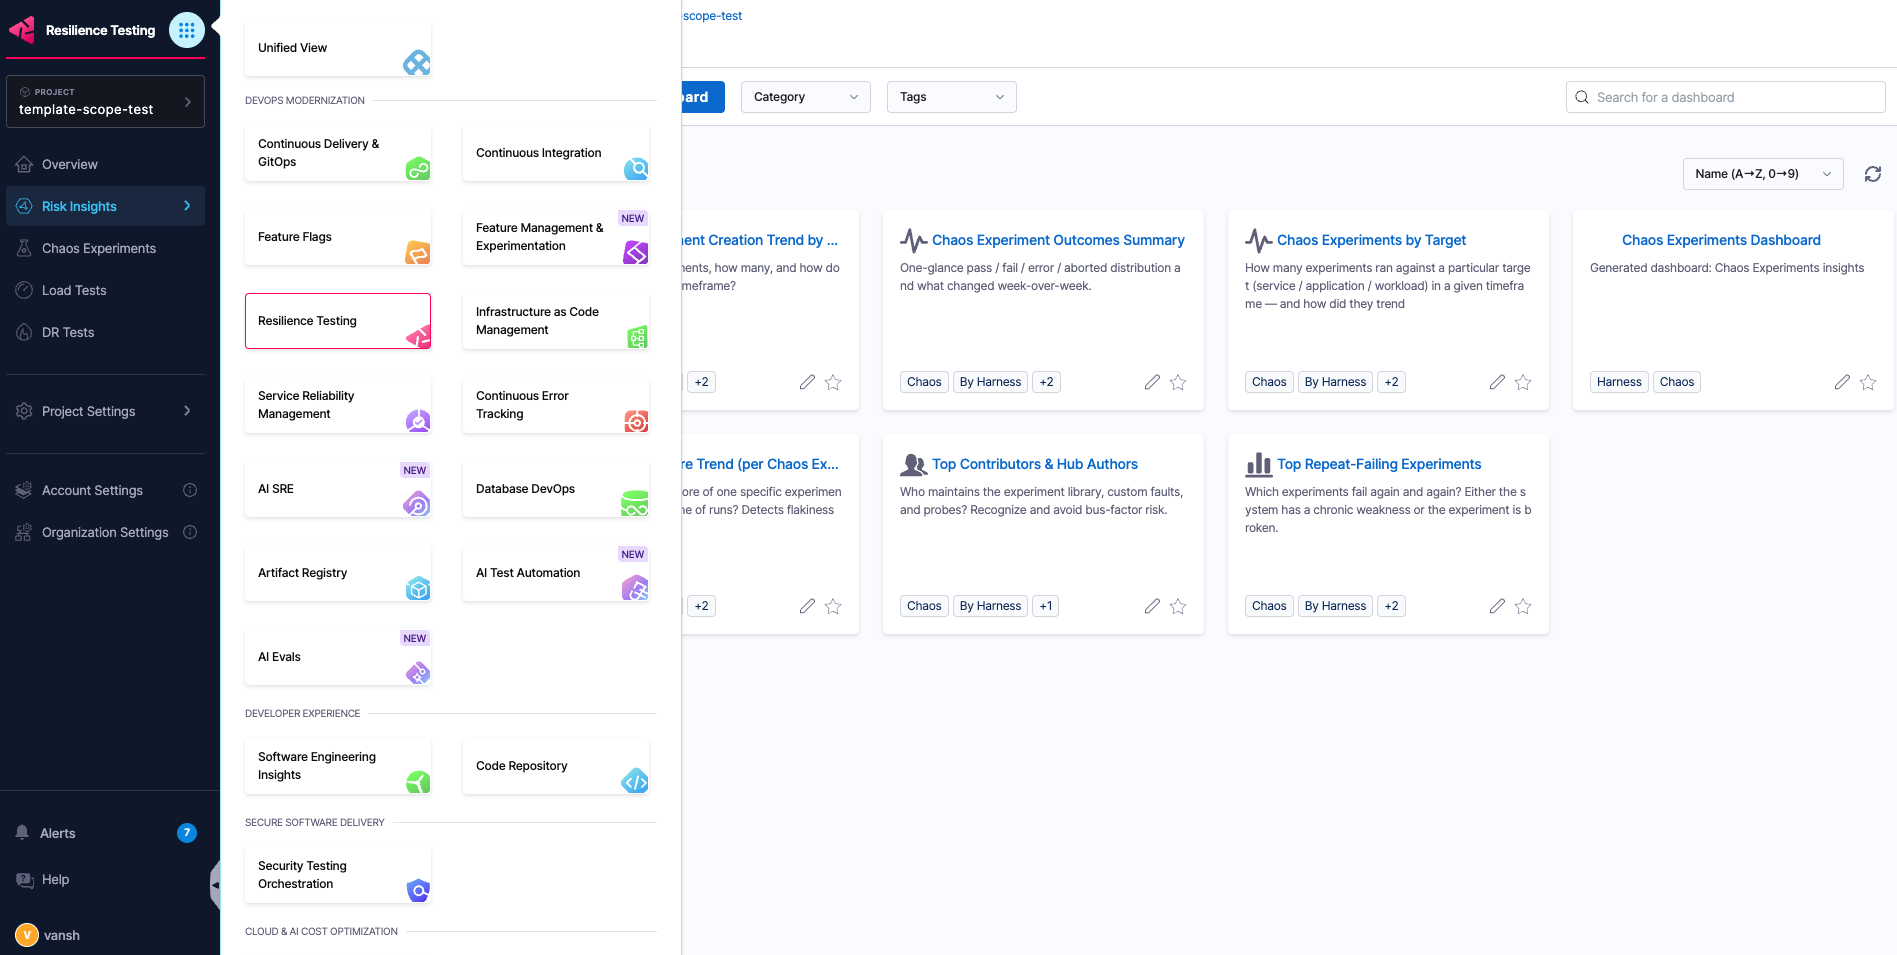
1. Select the nine-dot icon at the top of the left navigation bar.
Click to view full size
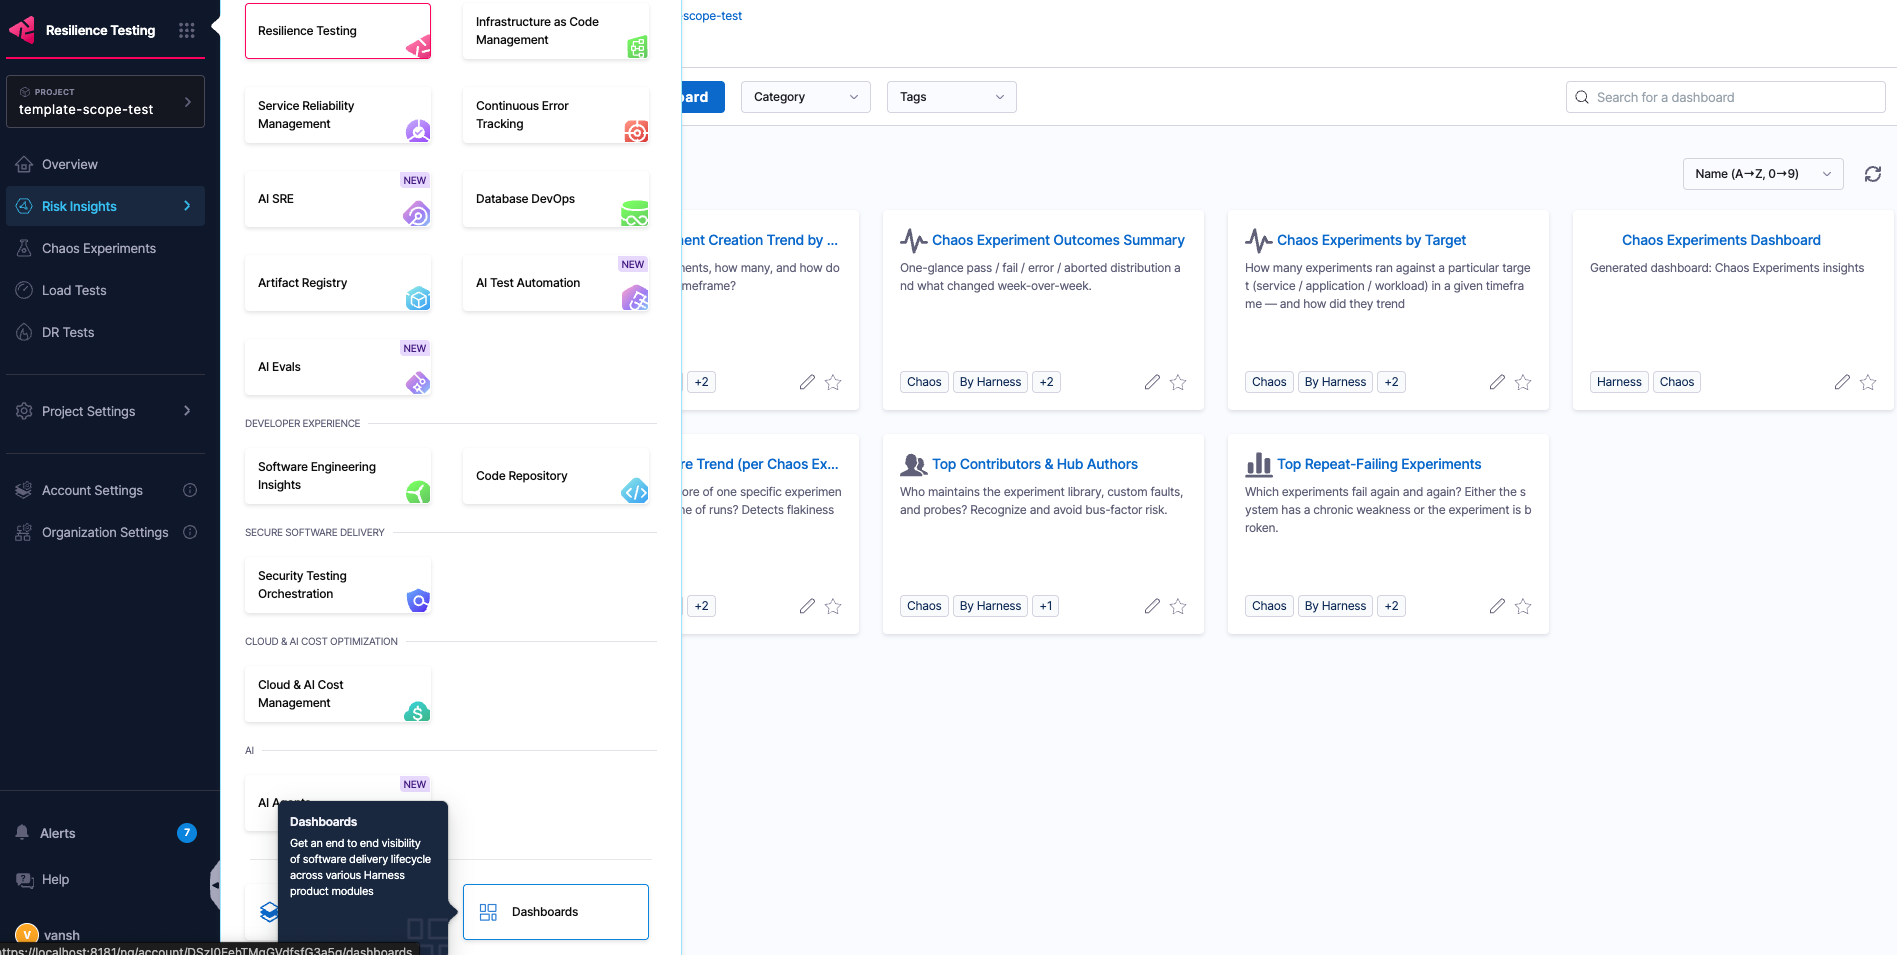
2. At the bottom of the navigation bar, select **Dashboards**.
Click to view full size
{% hint style="info" %}
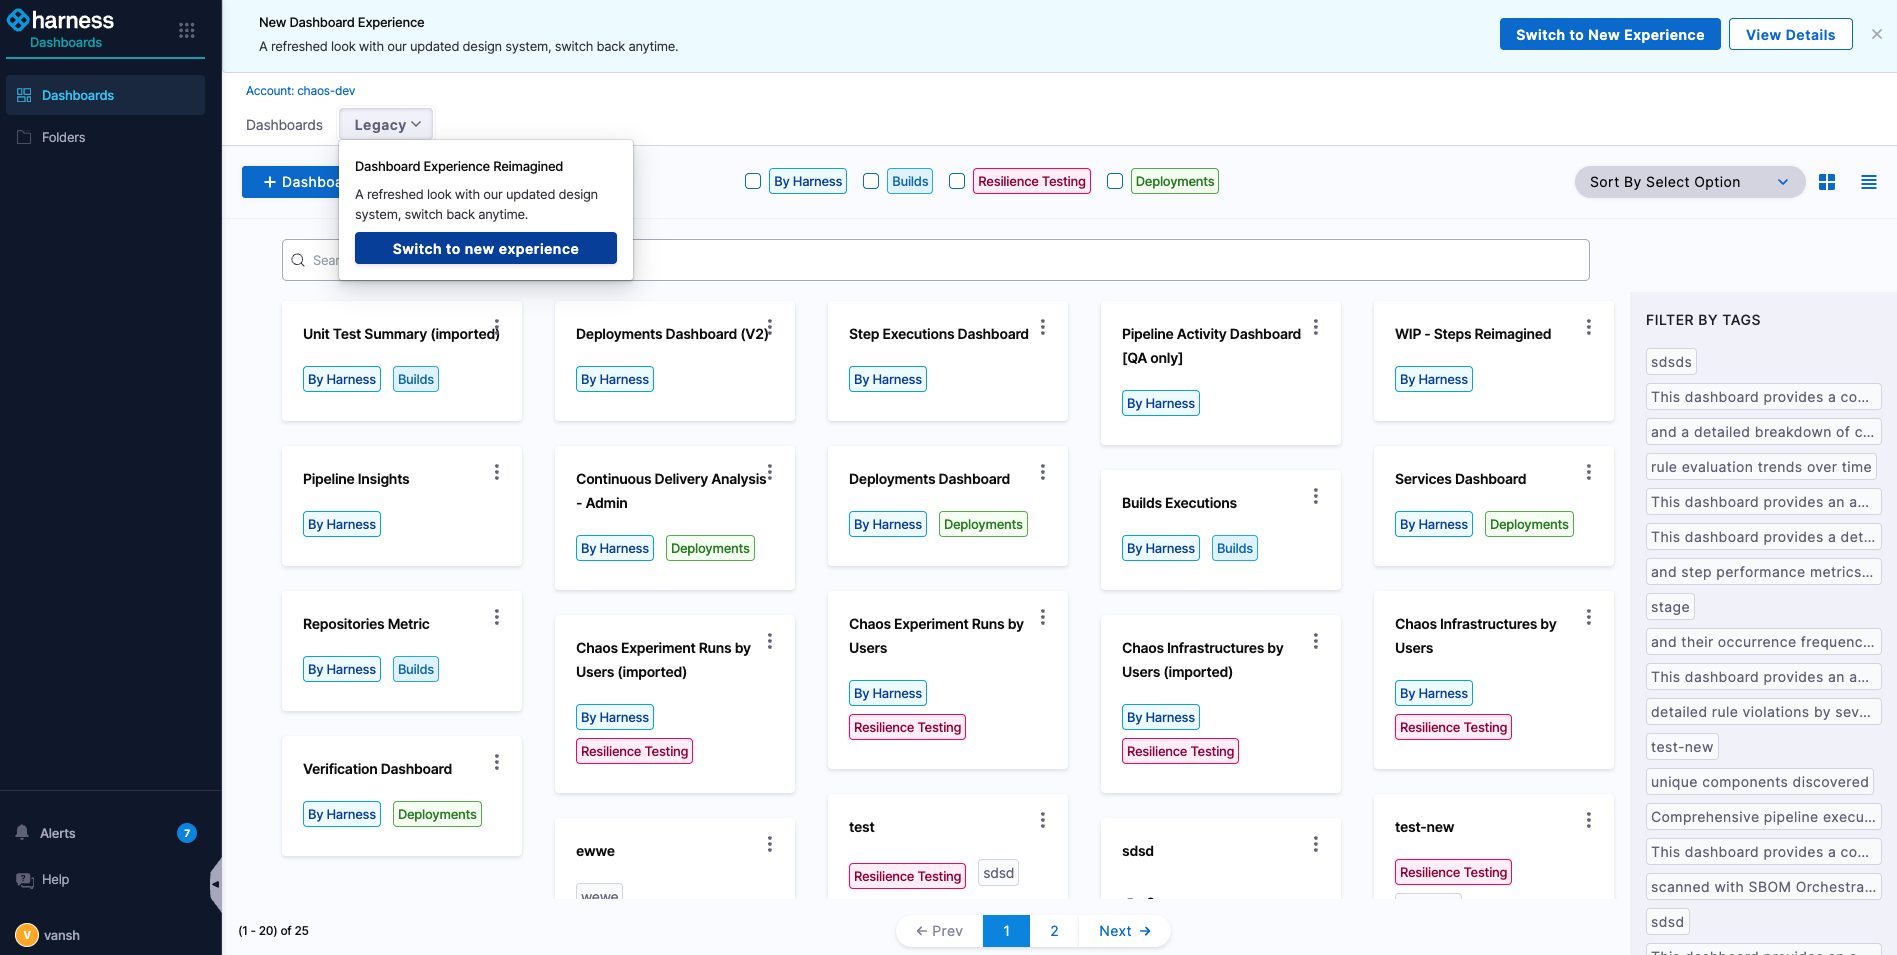
**SWITCH TO THE NEW EXPERIENCE**
If you see a prompt to switch experiences, use the dropdown and select **Switch to new experience**.
{% endhint %}
You now see the dashboards home.
Click to view full size
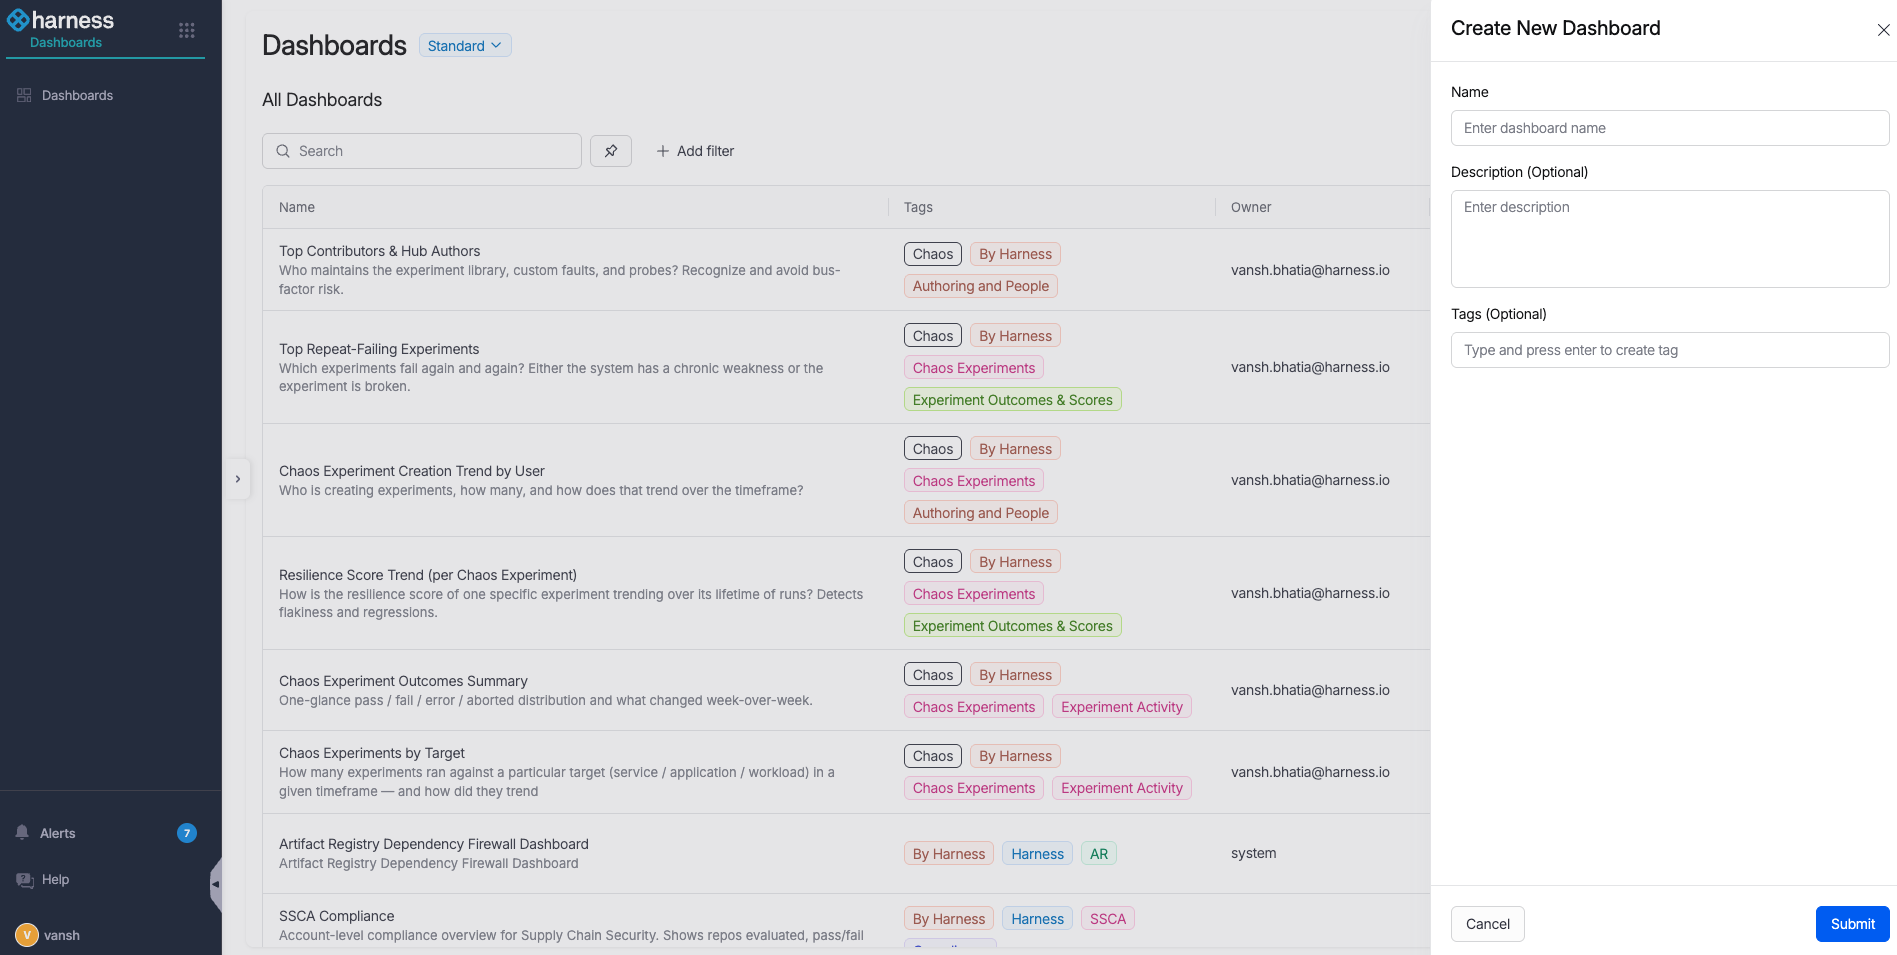
3. Select **+ Create Dashboard**. A right-side drawer opens.
Click to view full size
4. Enter a name and description. Add two mandatory tags so the RT module can identify and classify the dashboard:
* `Chaos`
* ``, where the category is one of `Experiment Activity`, `Experiment Outcomes & Scores`, or `Authoring & People`.
Click to view full size
{% hint style="warning" %}
**TAGS ARE REQUIRED**
The `Chaos` tag and a category tag are mandatory. Without them, the RT module cannot identify or classify the dashboard, so it does not appear in the module's Dashboards section.
{% endhint %}
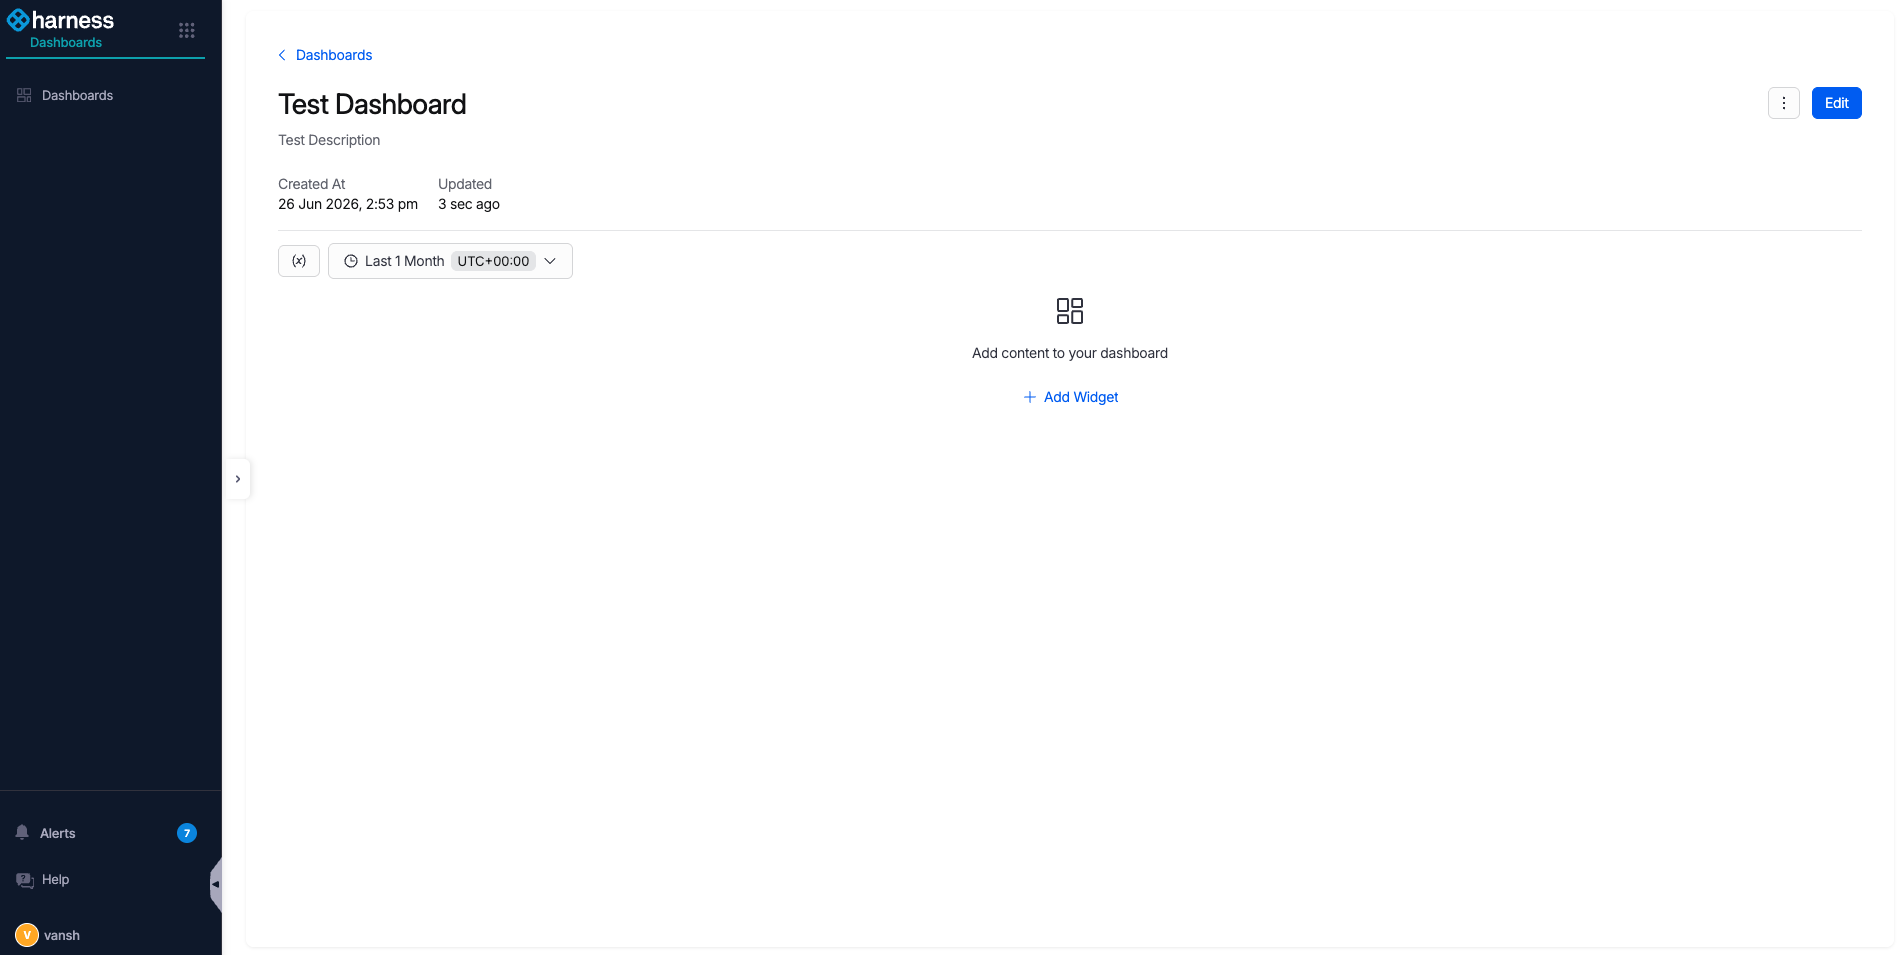
5. Select **Submit**. You land on the new, empty dashboard.
Click to view full size
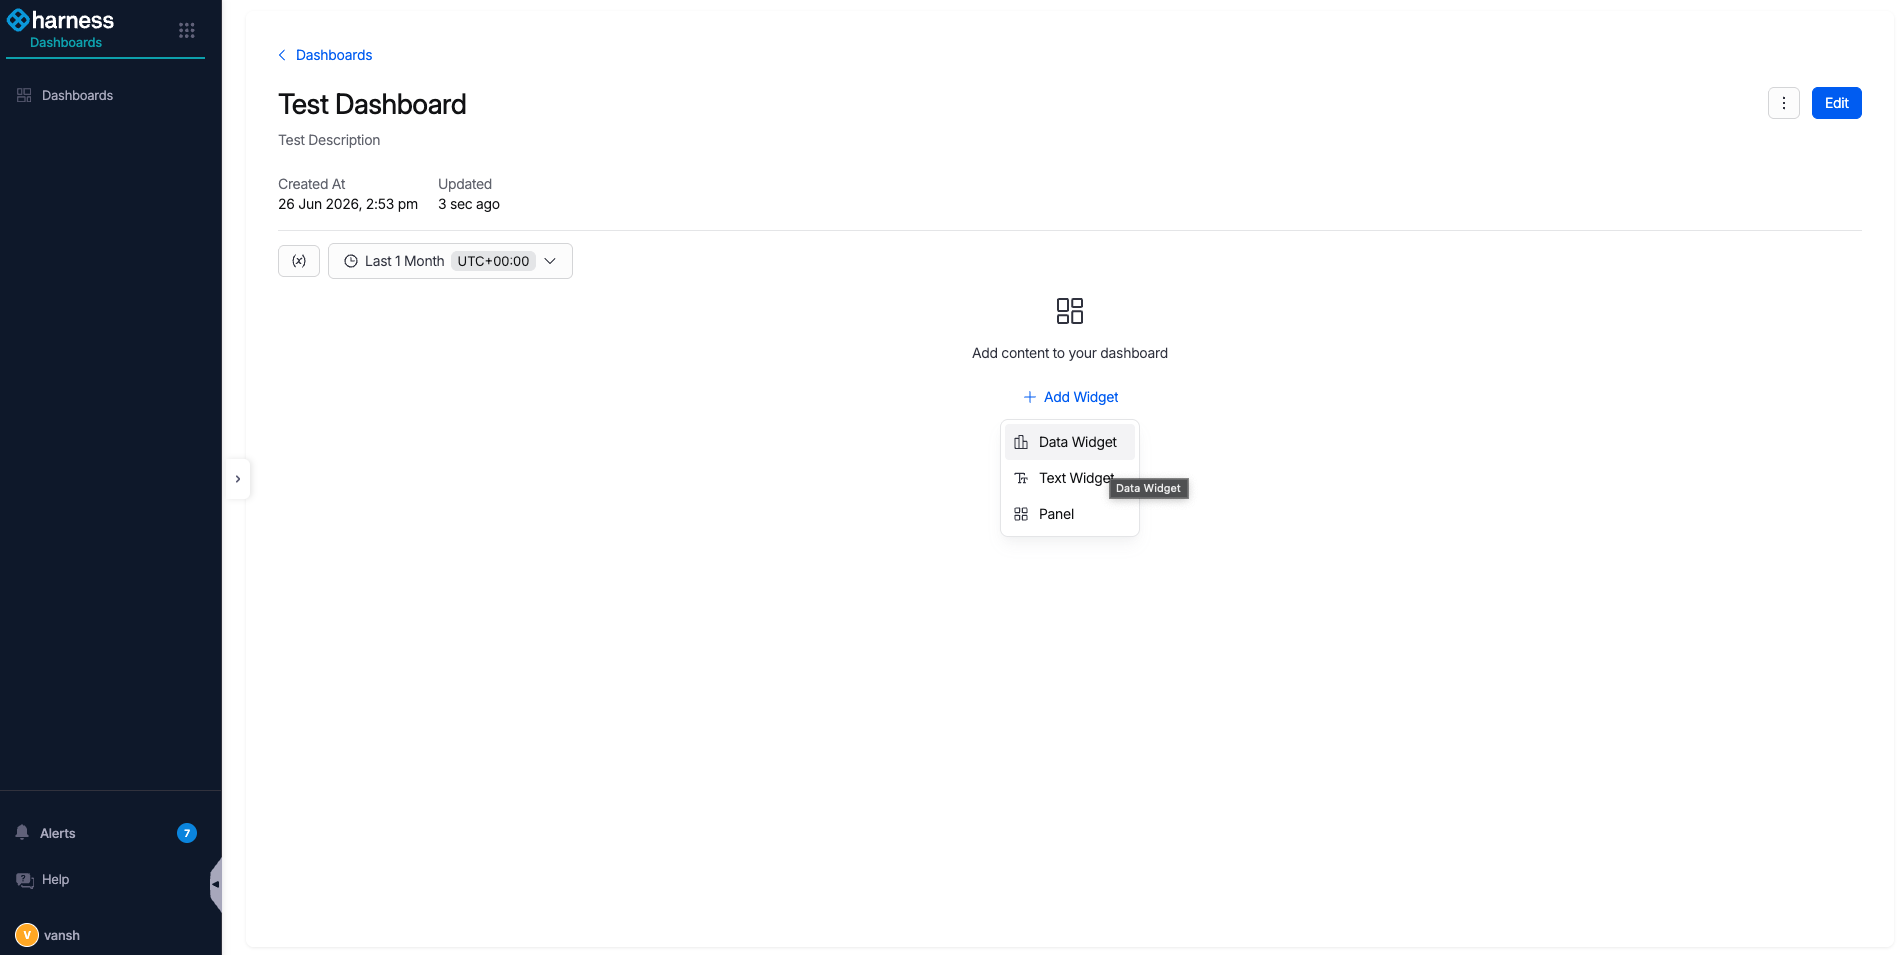
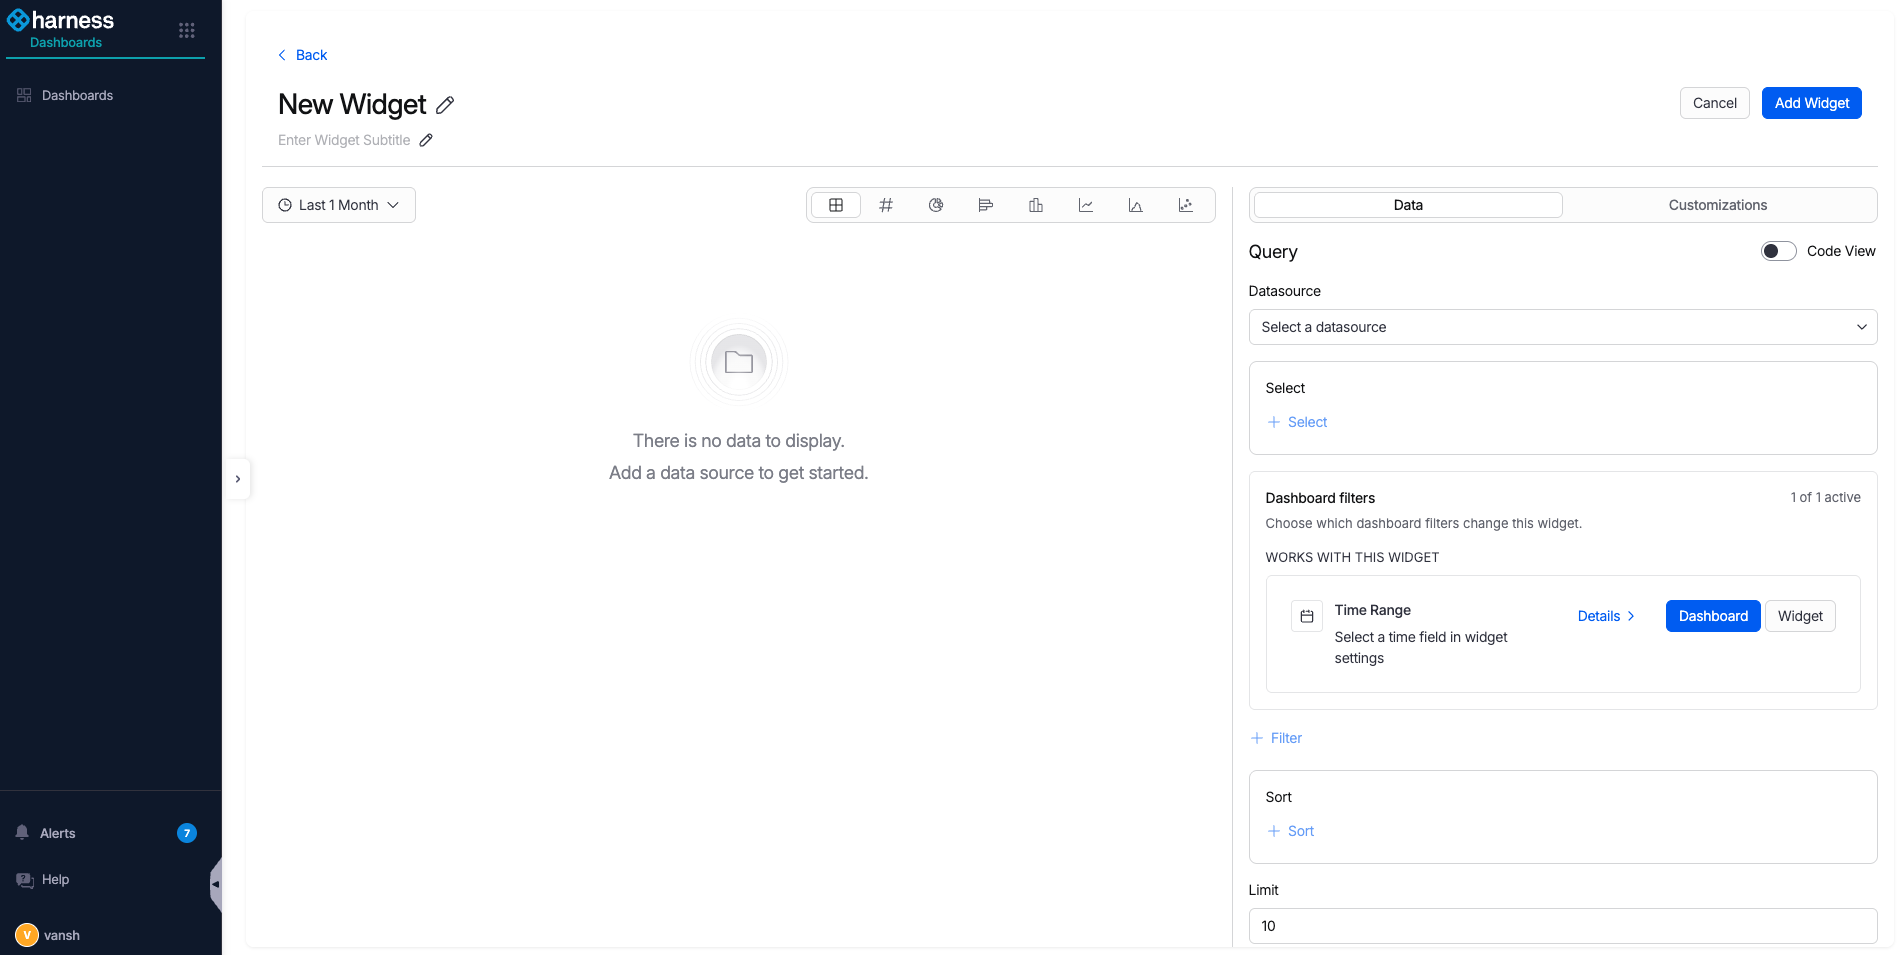
6. Select **+ Add Widget** to start adding widgets (individual tables or graphs).
Click to view full size
7. Select **Data Widget**.
Click to view full size
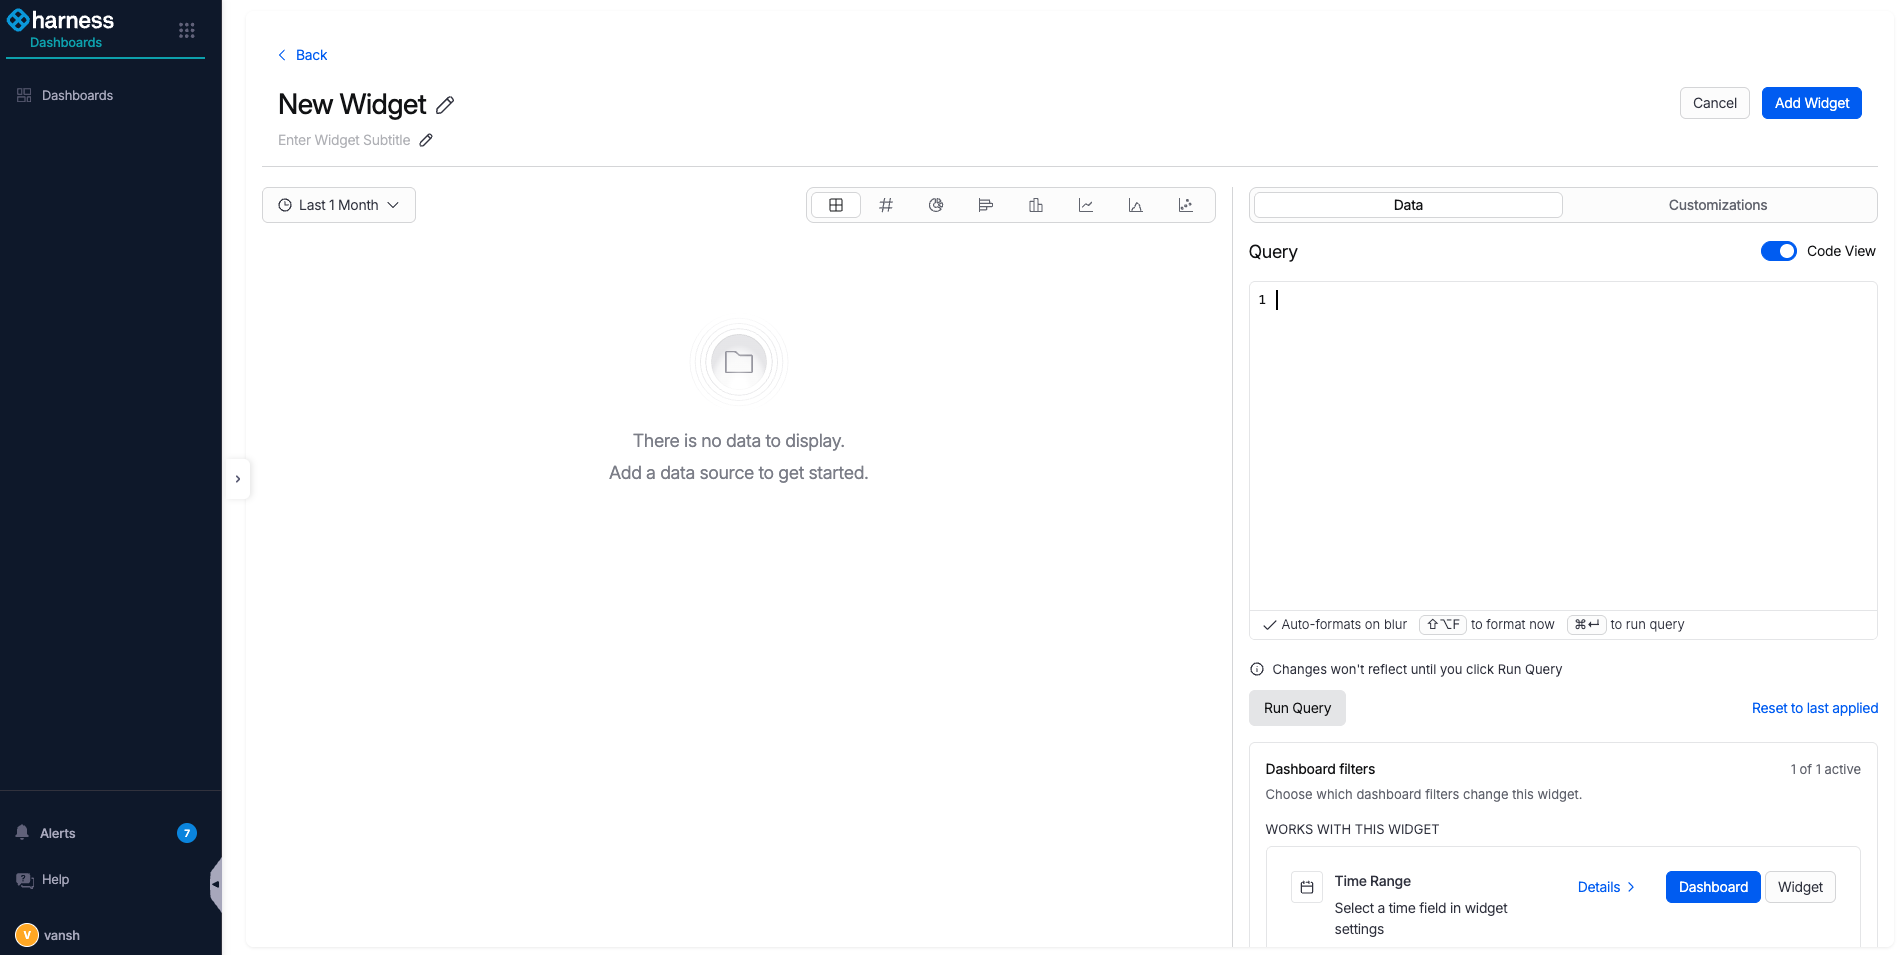
8. Toggle **Code View**.
Click to view full size
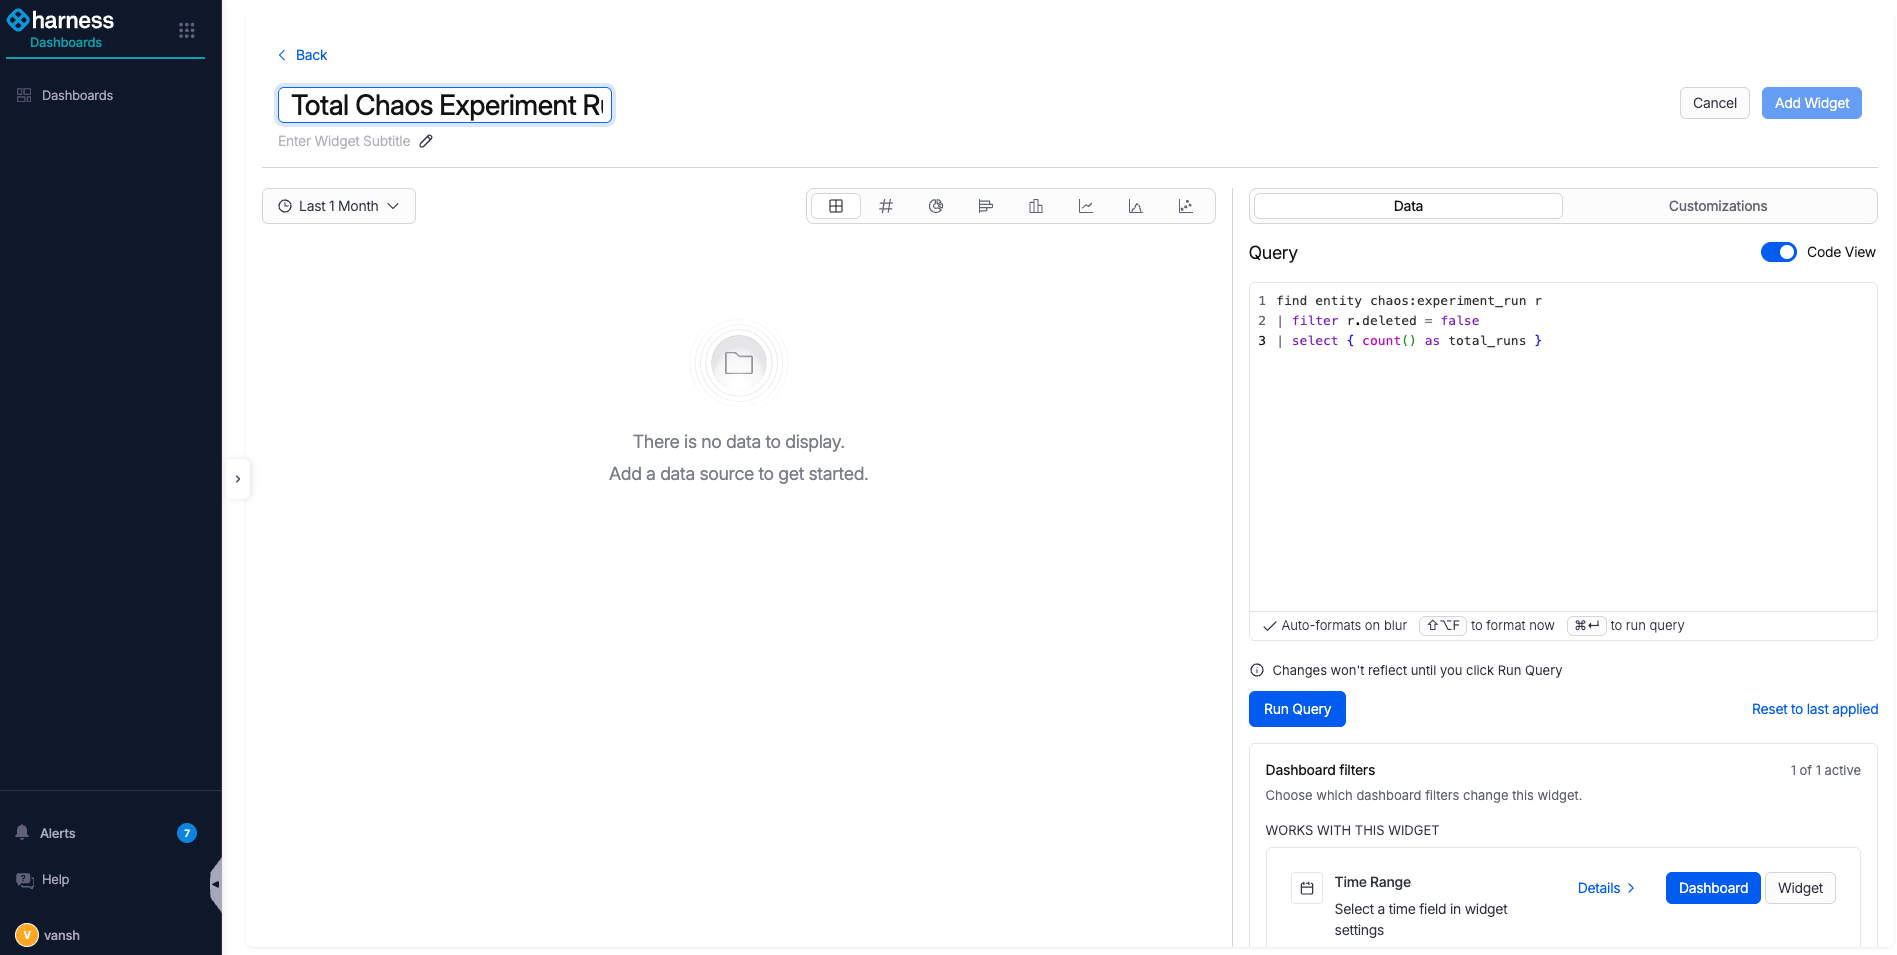
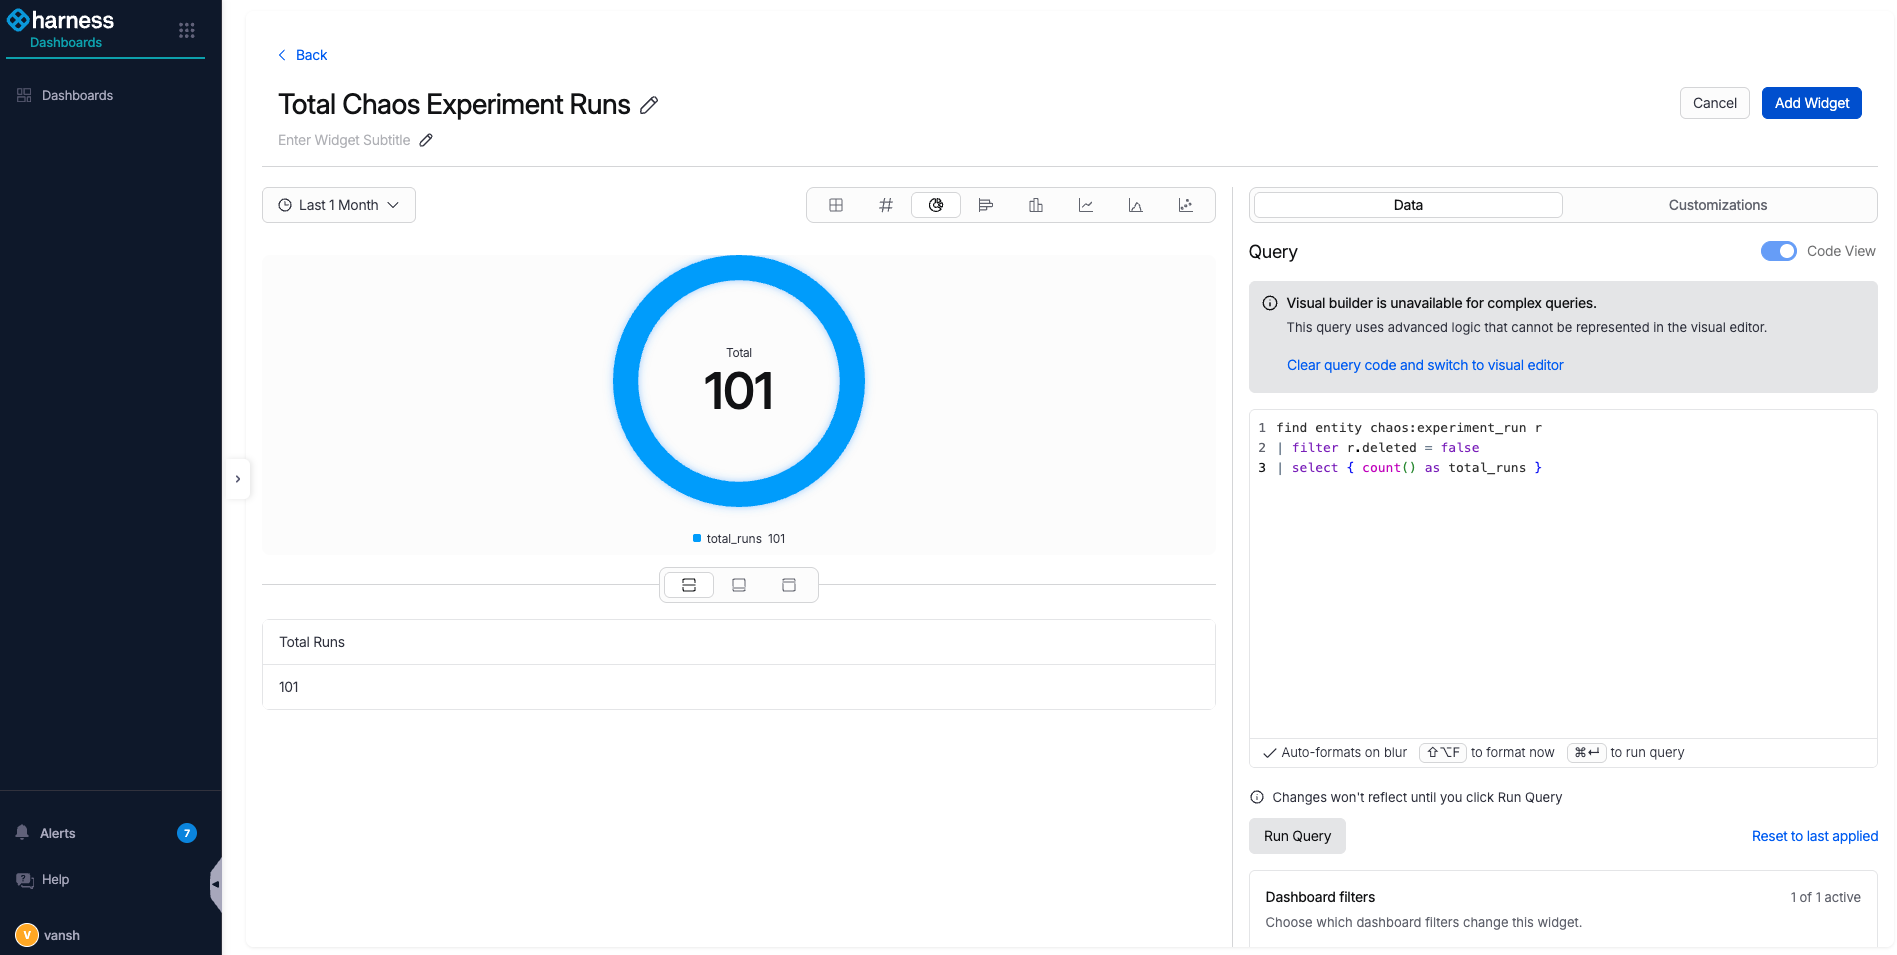
9. Enter a name and description for the widget, then write your query in the **Query** text area. Go to [Dashboard query schema](#dashboard-query-schema) to review the available event and entity types.
Click to view full size
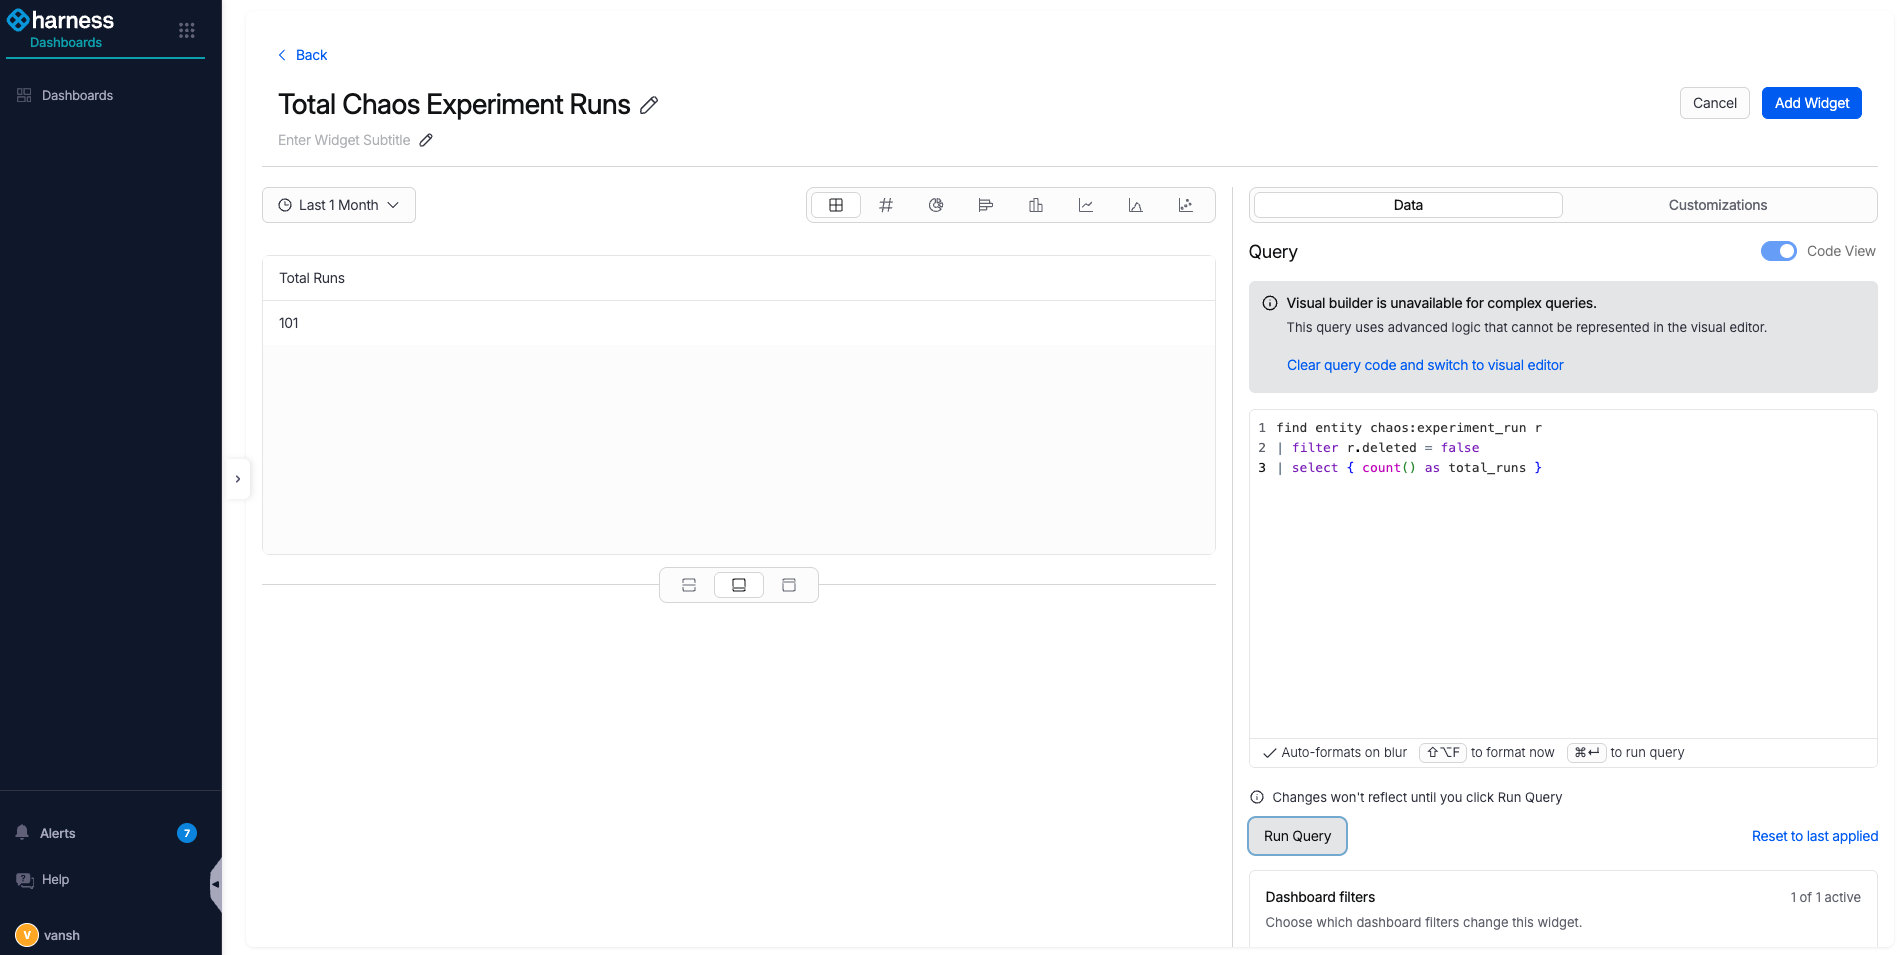
10. Select **Run Query** to fetch data from Harness UDP.
Click to view full size
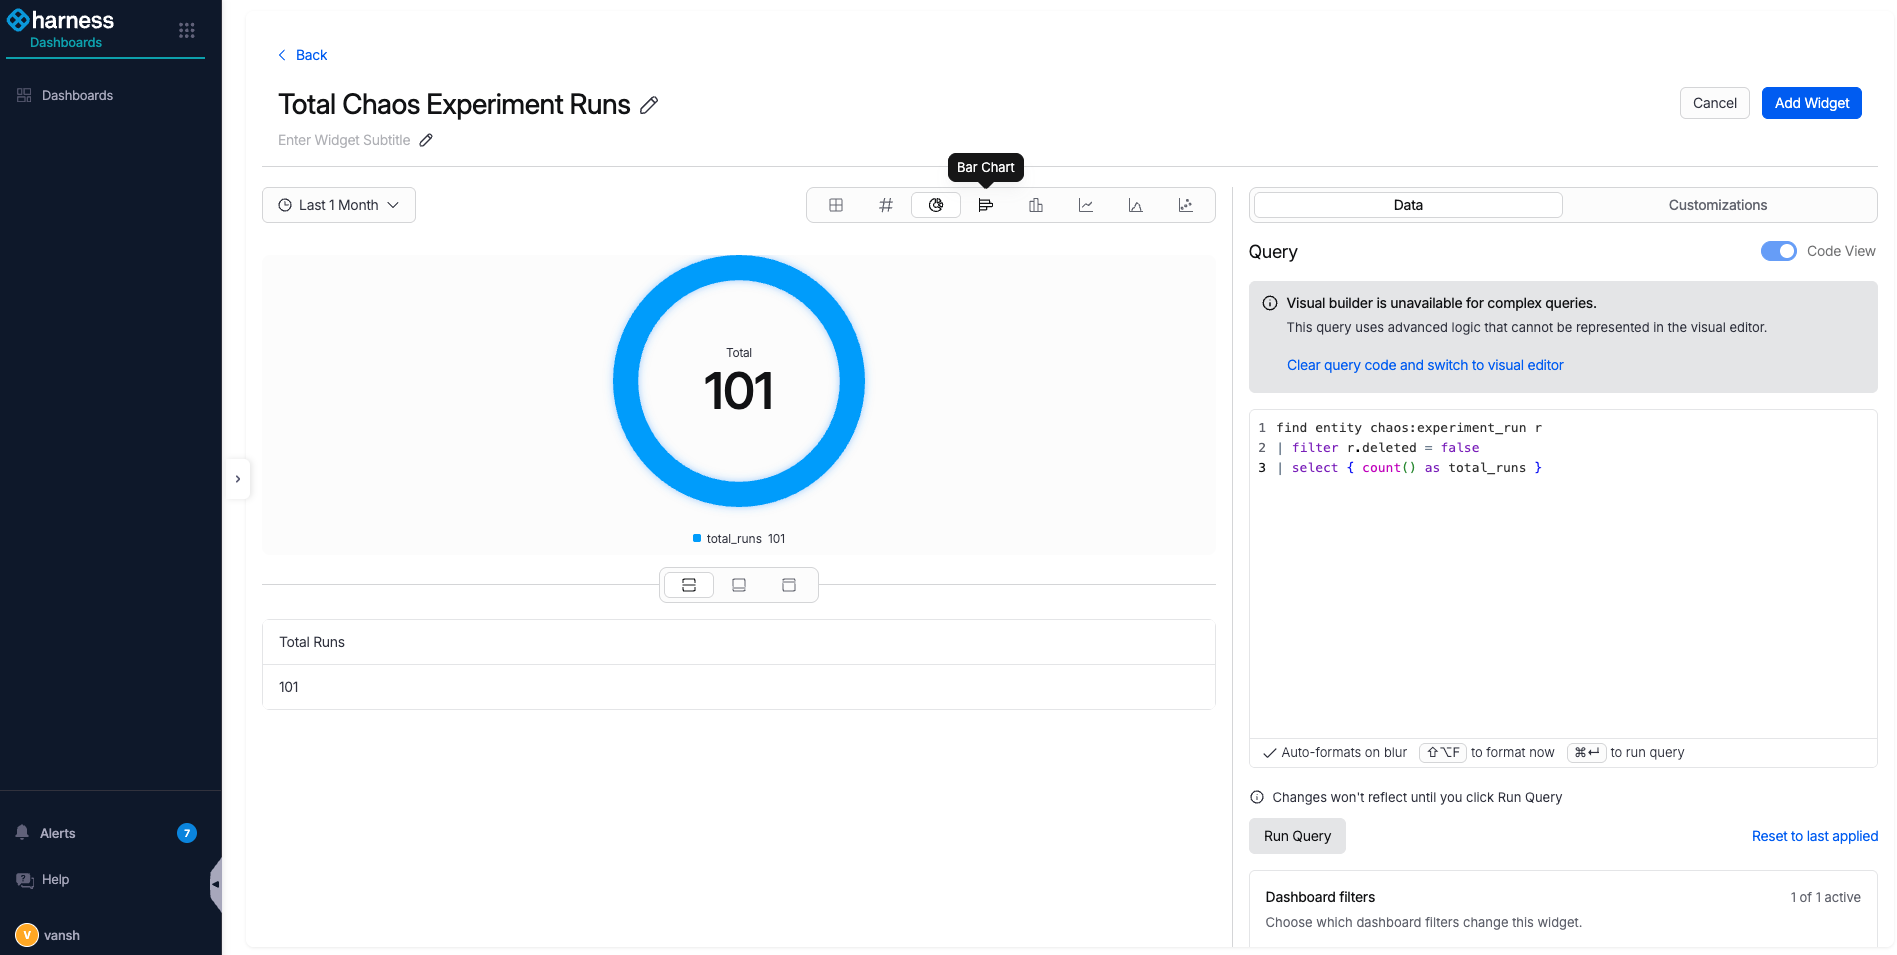
11. Choose a visualization. The available visualizations are:
* Table View
* Metric Card
* Donut Chart
* Bar Chart
* Column Chart
* Line Chart
* Area Chart
* Scatter Chart
This example uses a **Donut Chart**.
Click to view full size
12. Select **Add Widget** at the top right to save the widget.
Click to view full size
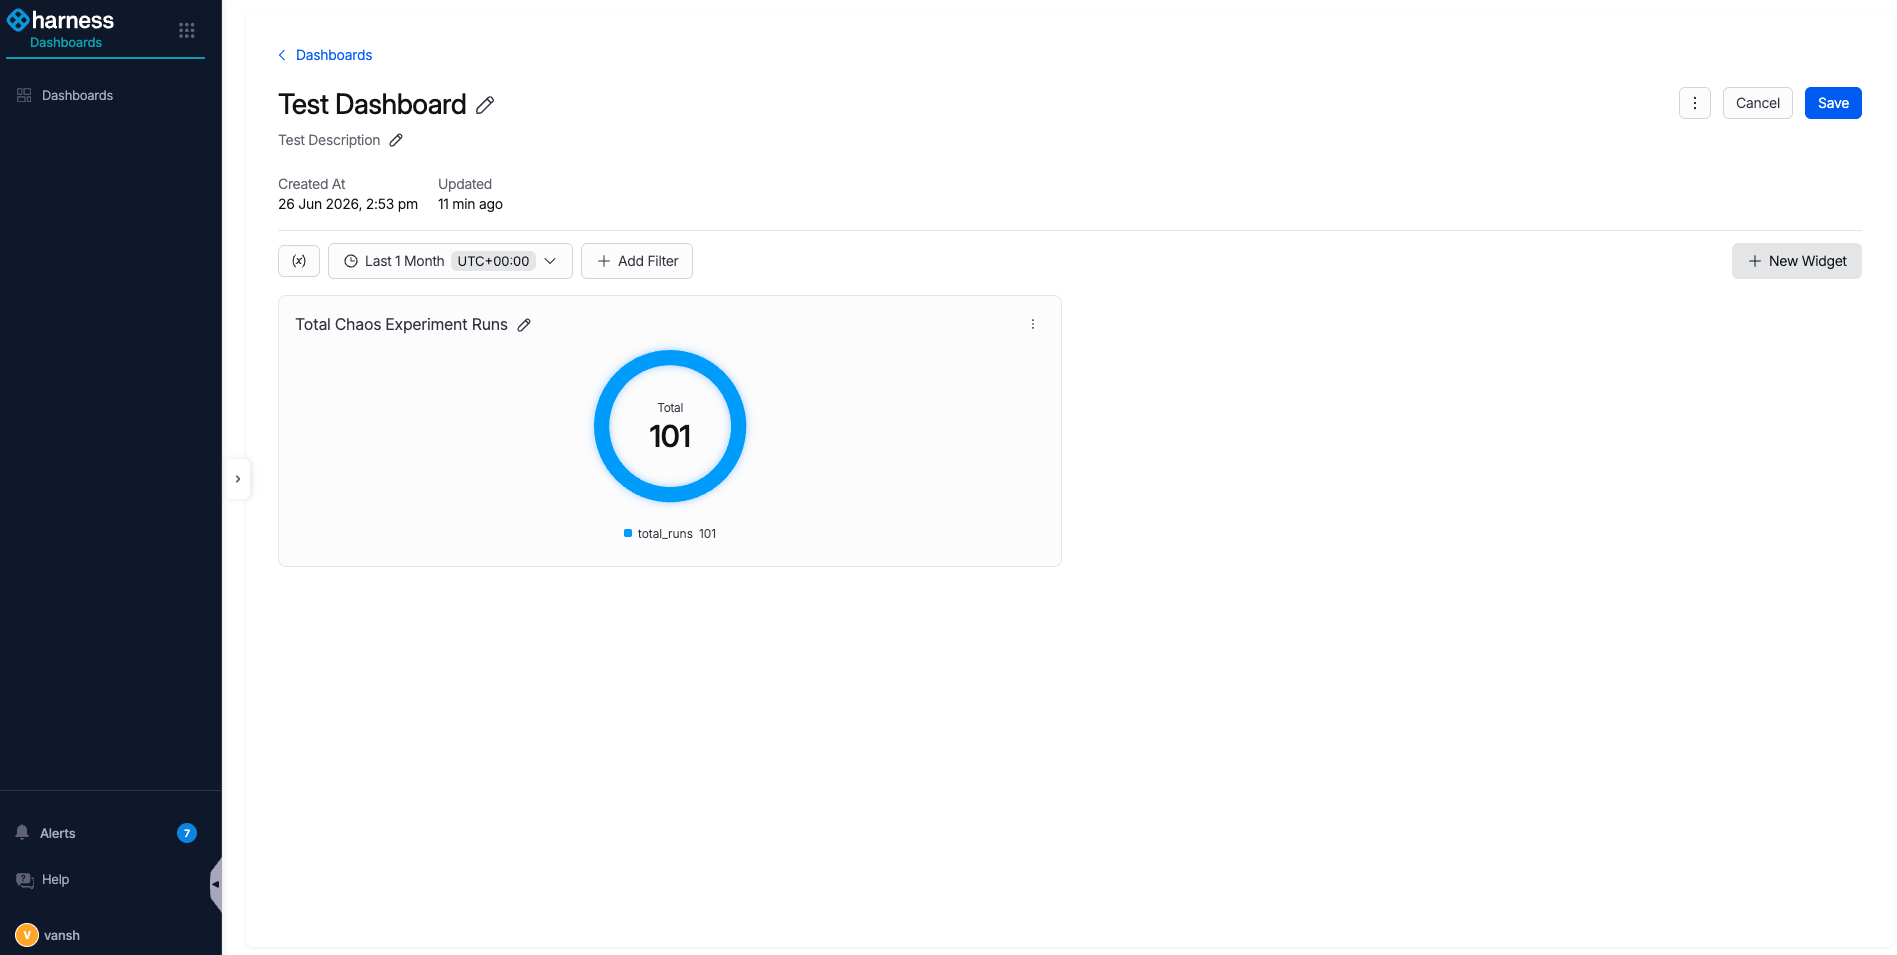
13. The dashboard shows the widget you added. Add any remaining widgets, then select **Save** at the top right.
Click to view full size
14. Return to the RT module from the left navigation bar.
Click to view full size
15. In the RT module, go back to the **Dashboards** page under **Insights**.
Click to view full size
Your custom dashboard now appears in the **Dashboards** section, filtered under the category you tagged it with, and you can open it to see the widgets you created.
Click to view full size
***
## RBAC considerations
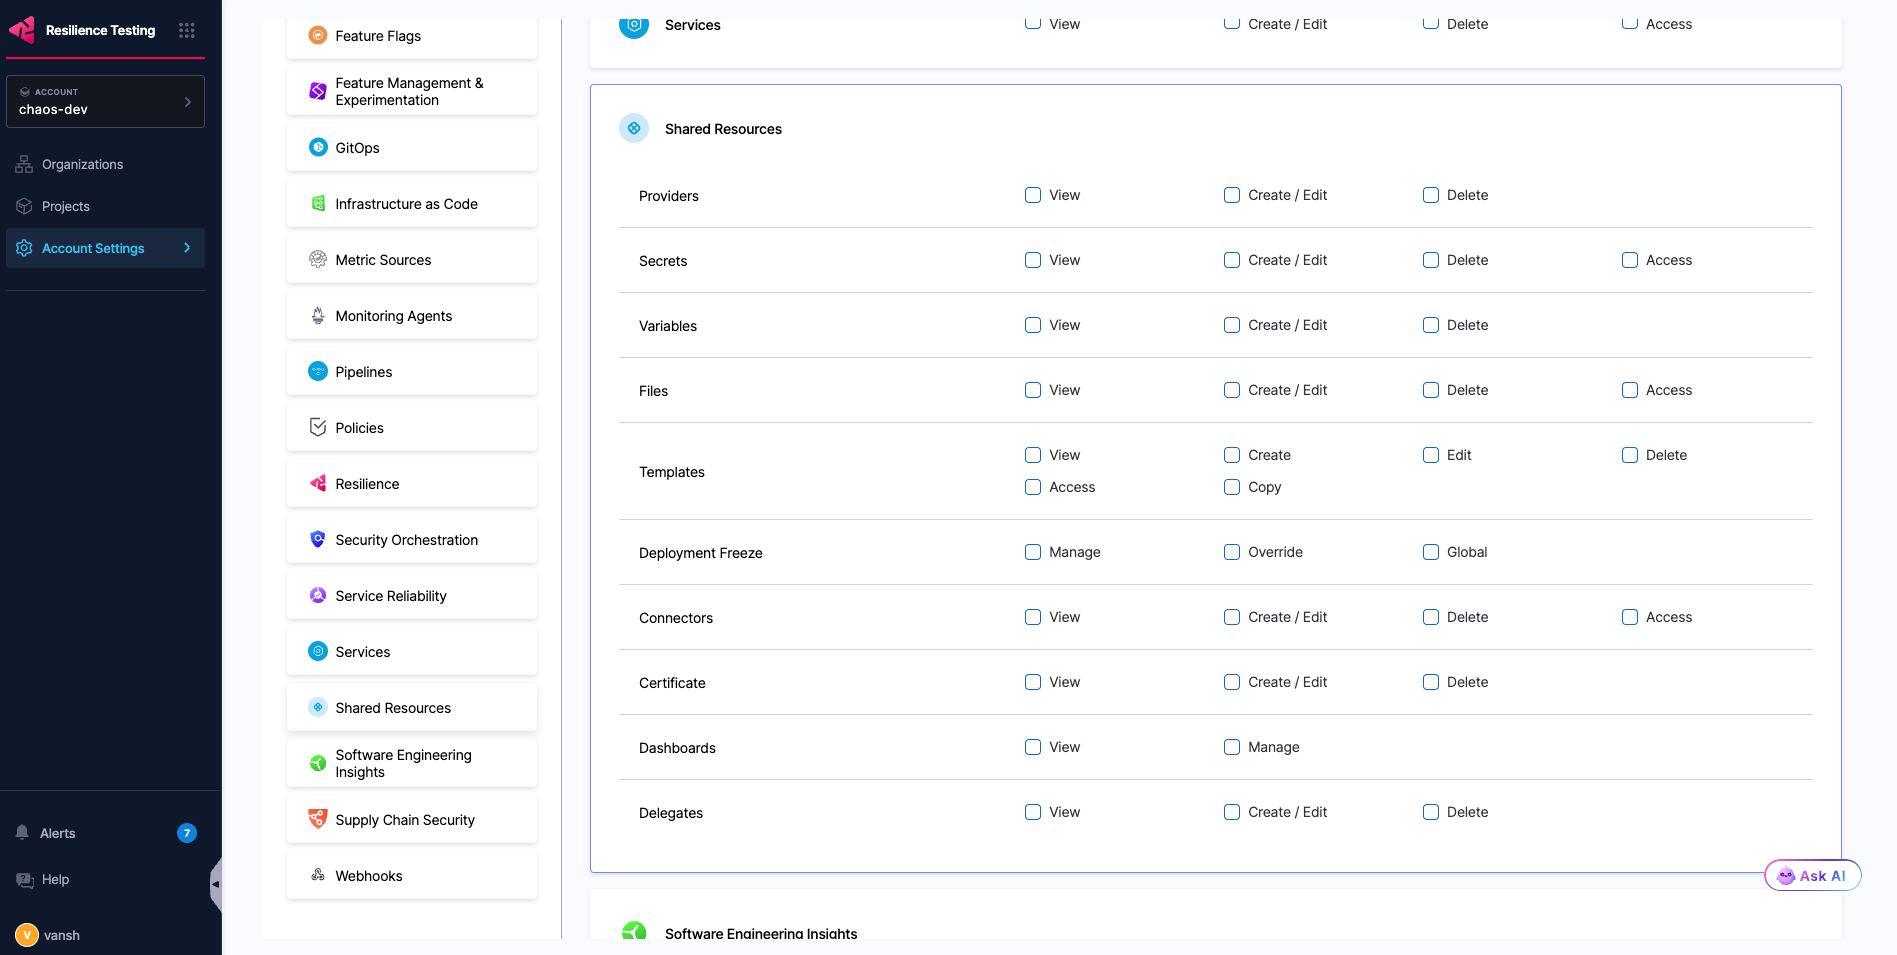
Dashboards fall under the **Shared Resources** category, with **View** and **Manage** permissions:
* **View:** Required to see the RT module in-product dashboards.
* **Manage:** Required to create your own dashboards.
 {% endhint %}
You now see the dashboards home.
{% endhint %}
You now see the dashboards home.