> For the complete documentation index, see [llms.txt](https://developer.harness.io/llms.txt). Markdown versions of documentation pages are available by appending `.md` to page URLs; this page is available as [Markdown](https://developer.harness.io/security-testing-orchestration/use-sto/sto-dashboards-and-reports/sto-pipeline-execution-summary.md).
# STO Pipeline Execution Summary Dashboard
View, analyze, and export scan results for a specific STO pipeline execution, including detailed issue metadata.
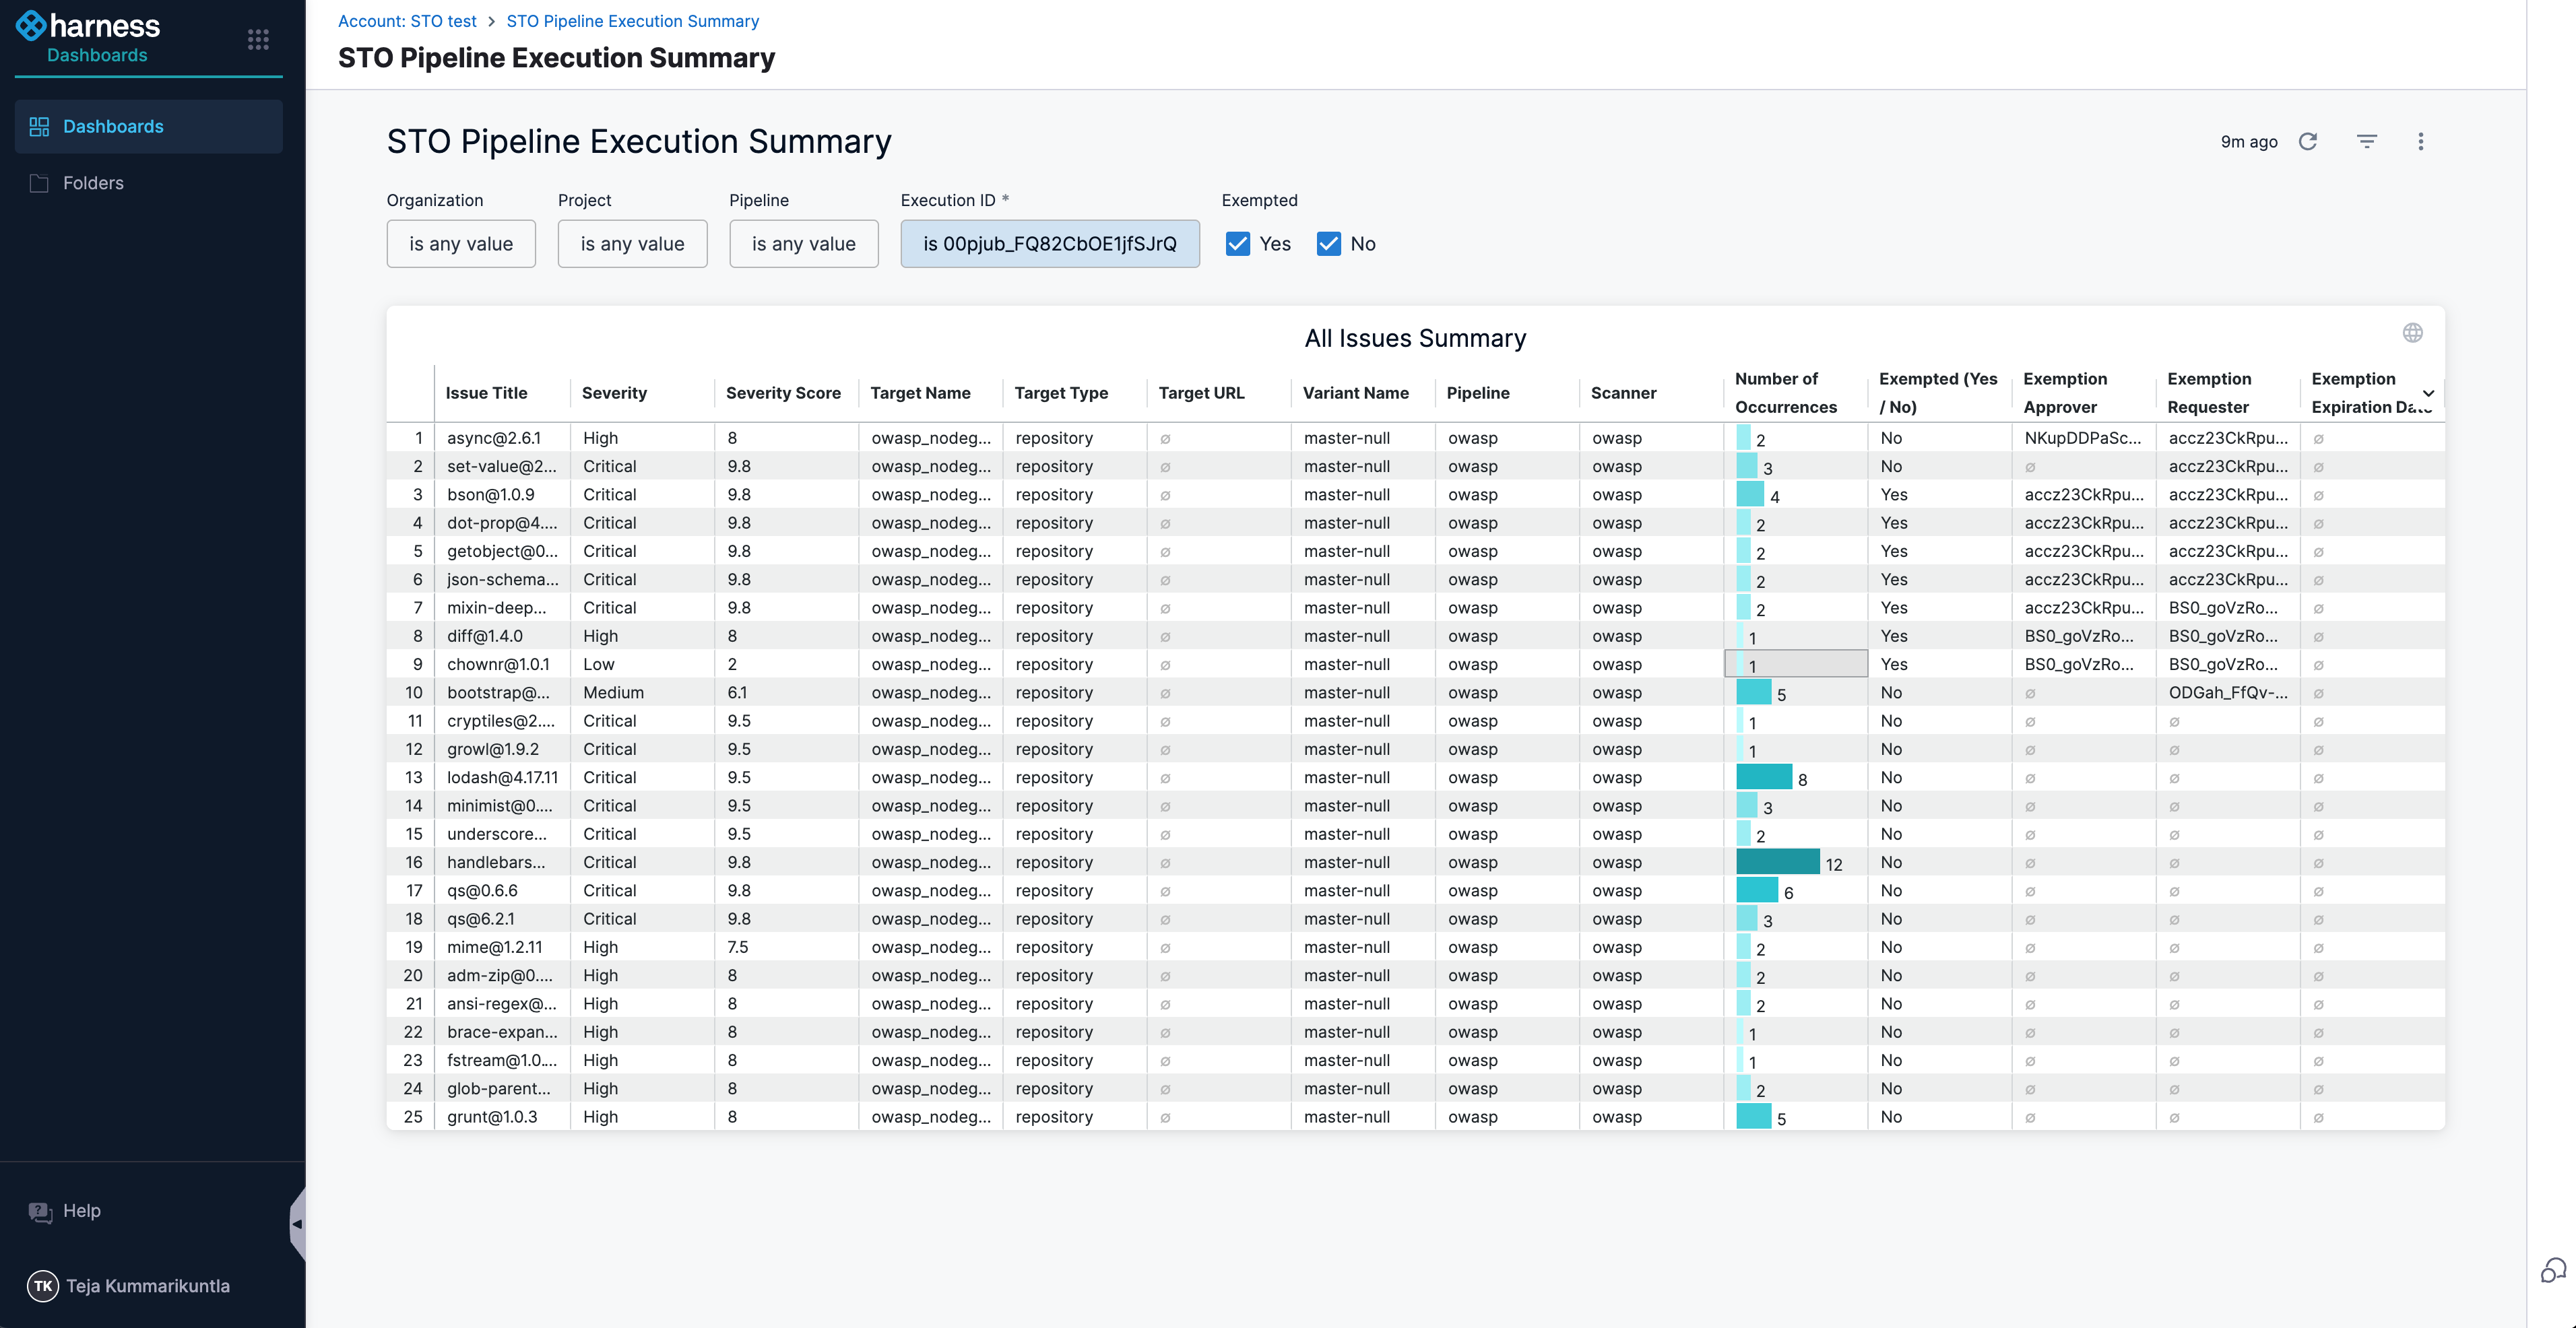
The **STO Pipeline Execution Summary** dashboard provides a detailed view of all issues identified during a specific STO pipeline execution. It is designed to help you investigate scan results for a single execution and review associated metadata, such as the target, scanner, exemption status, and more.
Importantly, you can export the scan results for a specific execution. The dashboard provides an option to download the report directly, or you can configure a pipeline to automatically generate the scan results report and send it via email. Refer to [this guide](/security-testing-orchestration/use-sto/sto-security-issues/export-scan-results.md) to learn how to set up the report generation and email step.
{% hint style="info" %}
* This dashboard requires an **Execution ID** filter to display scan results for a specific pipeline execution.
* Access to this dashboard requires an **Enterprise** account.
{% endhint %}
The dashboard includes a single data table:
* **All Issues Summary Table**: Displays issue-level data collected from a specific pipeline execution. Each row in the table represents an issue instance, along with relevant metadata.
The table includes the following columns:
* **Issue Title**: Name or description of the security issue.
* **Severity**: The severity level of the issue (e.g., Critical, High, Medium, Low).
* **Severity Score**: Numeric representation of the issue's severity.
* **Target Name**: Name of the scanned target where the issue was found.
* **Target Type**: Type of target (e.g., container image, repository, configuration).
* **Target URL**: The associated URL or path for the scanned target.
* **Variant Name**: Name of the test variant or sub-component where the issue was identified.
* **Pipeline**: Name of the pipeline that executed the scan.
* **Scanner**: Name of the scanner used to detect the issue.
* **Number of Occurrences**: Count of how many times this issue was observed in the scan.
* **Exempted (Yes/No)**: Indicates whether the issue is exempted.
* **Exemption Approved**: Indicates whether the exemption was approved.
* **Exemption Requester**: The user who requested the exemption.
Click to view full size image
#### Filters on STO Pipeline Execution Summary
The **STO Pipeline Execution Summary** dashboard supports filters that let you narrow the data to a specific execution context. After applying any filter, click **Reload** at the top right of the dashboard to refresh the data.
The available filters include:
* **Organization**: Filters results by the selected Harness Organization.
* **Project**: Filters results within a specific Project.
* **Pipeline**: Filters results for a specific pipeline name.
* **Execution ID**: Required. Filters the data for a specific STO step execution.
* **Exempted**: Filters results based on exemption status
{% hint style="info" %}
You can find the **Execution ID** in your pipeline’s execution URL. For example: `https://app.harness.io/ng/account/ACCOUNT_ID/module/MODULE/orgs/ORG/projects/PROJECT/pipelines/PIPELINE/executions/EXECUTION_ID/pipeline`\
In this URL, the value after `/executions/` is the **Execution ID**.
{% endhint %}
{% @harness-feedback/feedback %}