> For the complete documentation index, see [llms.txt](https://developer.harness.io/llms.txt). Markdown versions of documentation pages are available by appending `.md` to page URLs; this page is available as [Markdown](https://developer.harness.io/self-managed-enterprise-edition/troubleshooting-and-resources/monitoring/enabling-tracing.md).
# Enabling Tracing for Harness Leveraging OpenTelemetry
Enable distributed tracing in Harness Self-Managed Enterprise Edition using OpenTelemetry and Grafana Tempo, with setup steps for storage, service configuration, and trace visualization in Grafana.
### Enable Tracing in Harness Services
The following Harness services(Platform, CD, CI, IACM, SSCA) support OpenTelemetry tracing:
* access-control, harness-manager, ng-manager, platform-service, pipeline-service, ci-manager, sto-manager, cv-nextgen, iacm-manager, audit-event-streaming, debezium-service, template-service, idp-service, ssca-manager.
#### Common Global Configuration
```yaml
global:
monitoring:
otel:
enabled: true
collectorEndpoint: http://opentelemetry-collector.otel.svc.cluster.local:4317/
```
### Overview of Tracing Architecture
The tracing setup for Harness leverages OpenTelemetry to capture distributed traces across services, enabling deeper observability and troubleshooting.
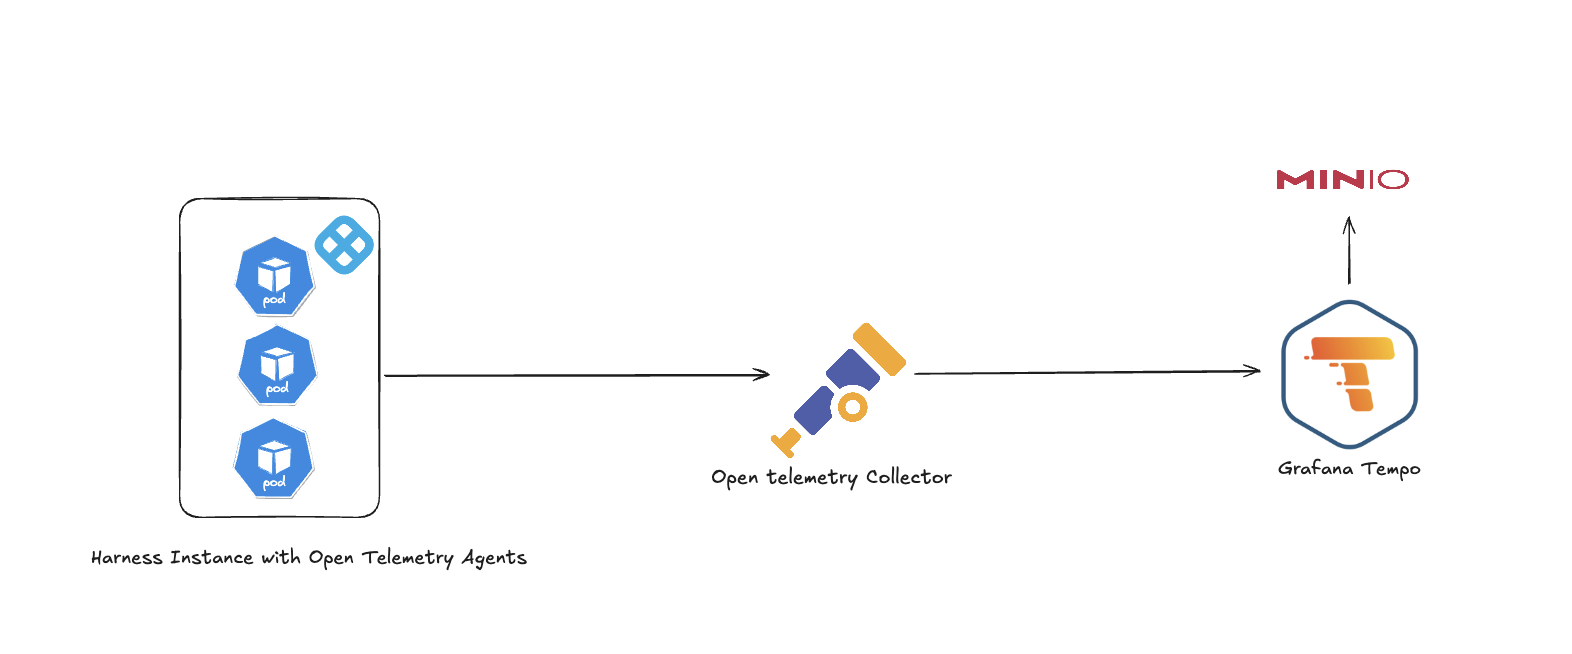
Overview of Tracing Architecture for Harness Self-Managed Enterprise Edition.
The architecture follows this flow:
1. Harness Instance with OpenTelemetry Agents: Each service in the Harness cluster is instrumented with OpenTelemetry agents to generate trace data.
2. OpenTelemetry Collector: Trace data is sent to the collector, which processes, batches, and exports it to supported backends.
3. Grafana Tempo: The collector forwards the traces to Grafana Tempo, a high-scale distributed tracing backend.
4. MinIO: Tempo stores the trace data in an object store, such as MinIO, for durability and querying.
### Install Grafana Tempo (Optional)
Grafana Tempo is used to store and query trace data collected via OTel.
#### Step 1: Install MinIO for Trace Storage (Optional)
* Create a file named `minio.yaml`:
```yaml
fullnameOverride: "minio"
mode: standalone
provisioning:
enabled: true
buckets:
- name: tempo
region: us-east-1
lifecycle:
- id: 7dRetention
expiry:
days: 7
nonconcurrentDays: 3
tags:
owner: tempo
persistence:
size: 20Gi
auth:
rootUser: admin
rootPassword: "admin123"
```
* Install MinIO:
```bash
helm repo add bitnami https://charts.bitnami.com/bitnami
helm install minio bitnami/minio -f minio.yaml -n tempo --create-namespace
```
#### Step 2: Install Tempo Distributed
* Create a file `tempo.yaml` with appropriate overrides.
* Install Tempo:
```bash
helm repo add grafana https://grafana.github.io/helm-charts
helm install tempo-distributed grafana/tempo-distributed -f tempo.yaml -n tempo
```
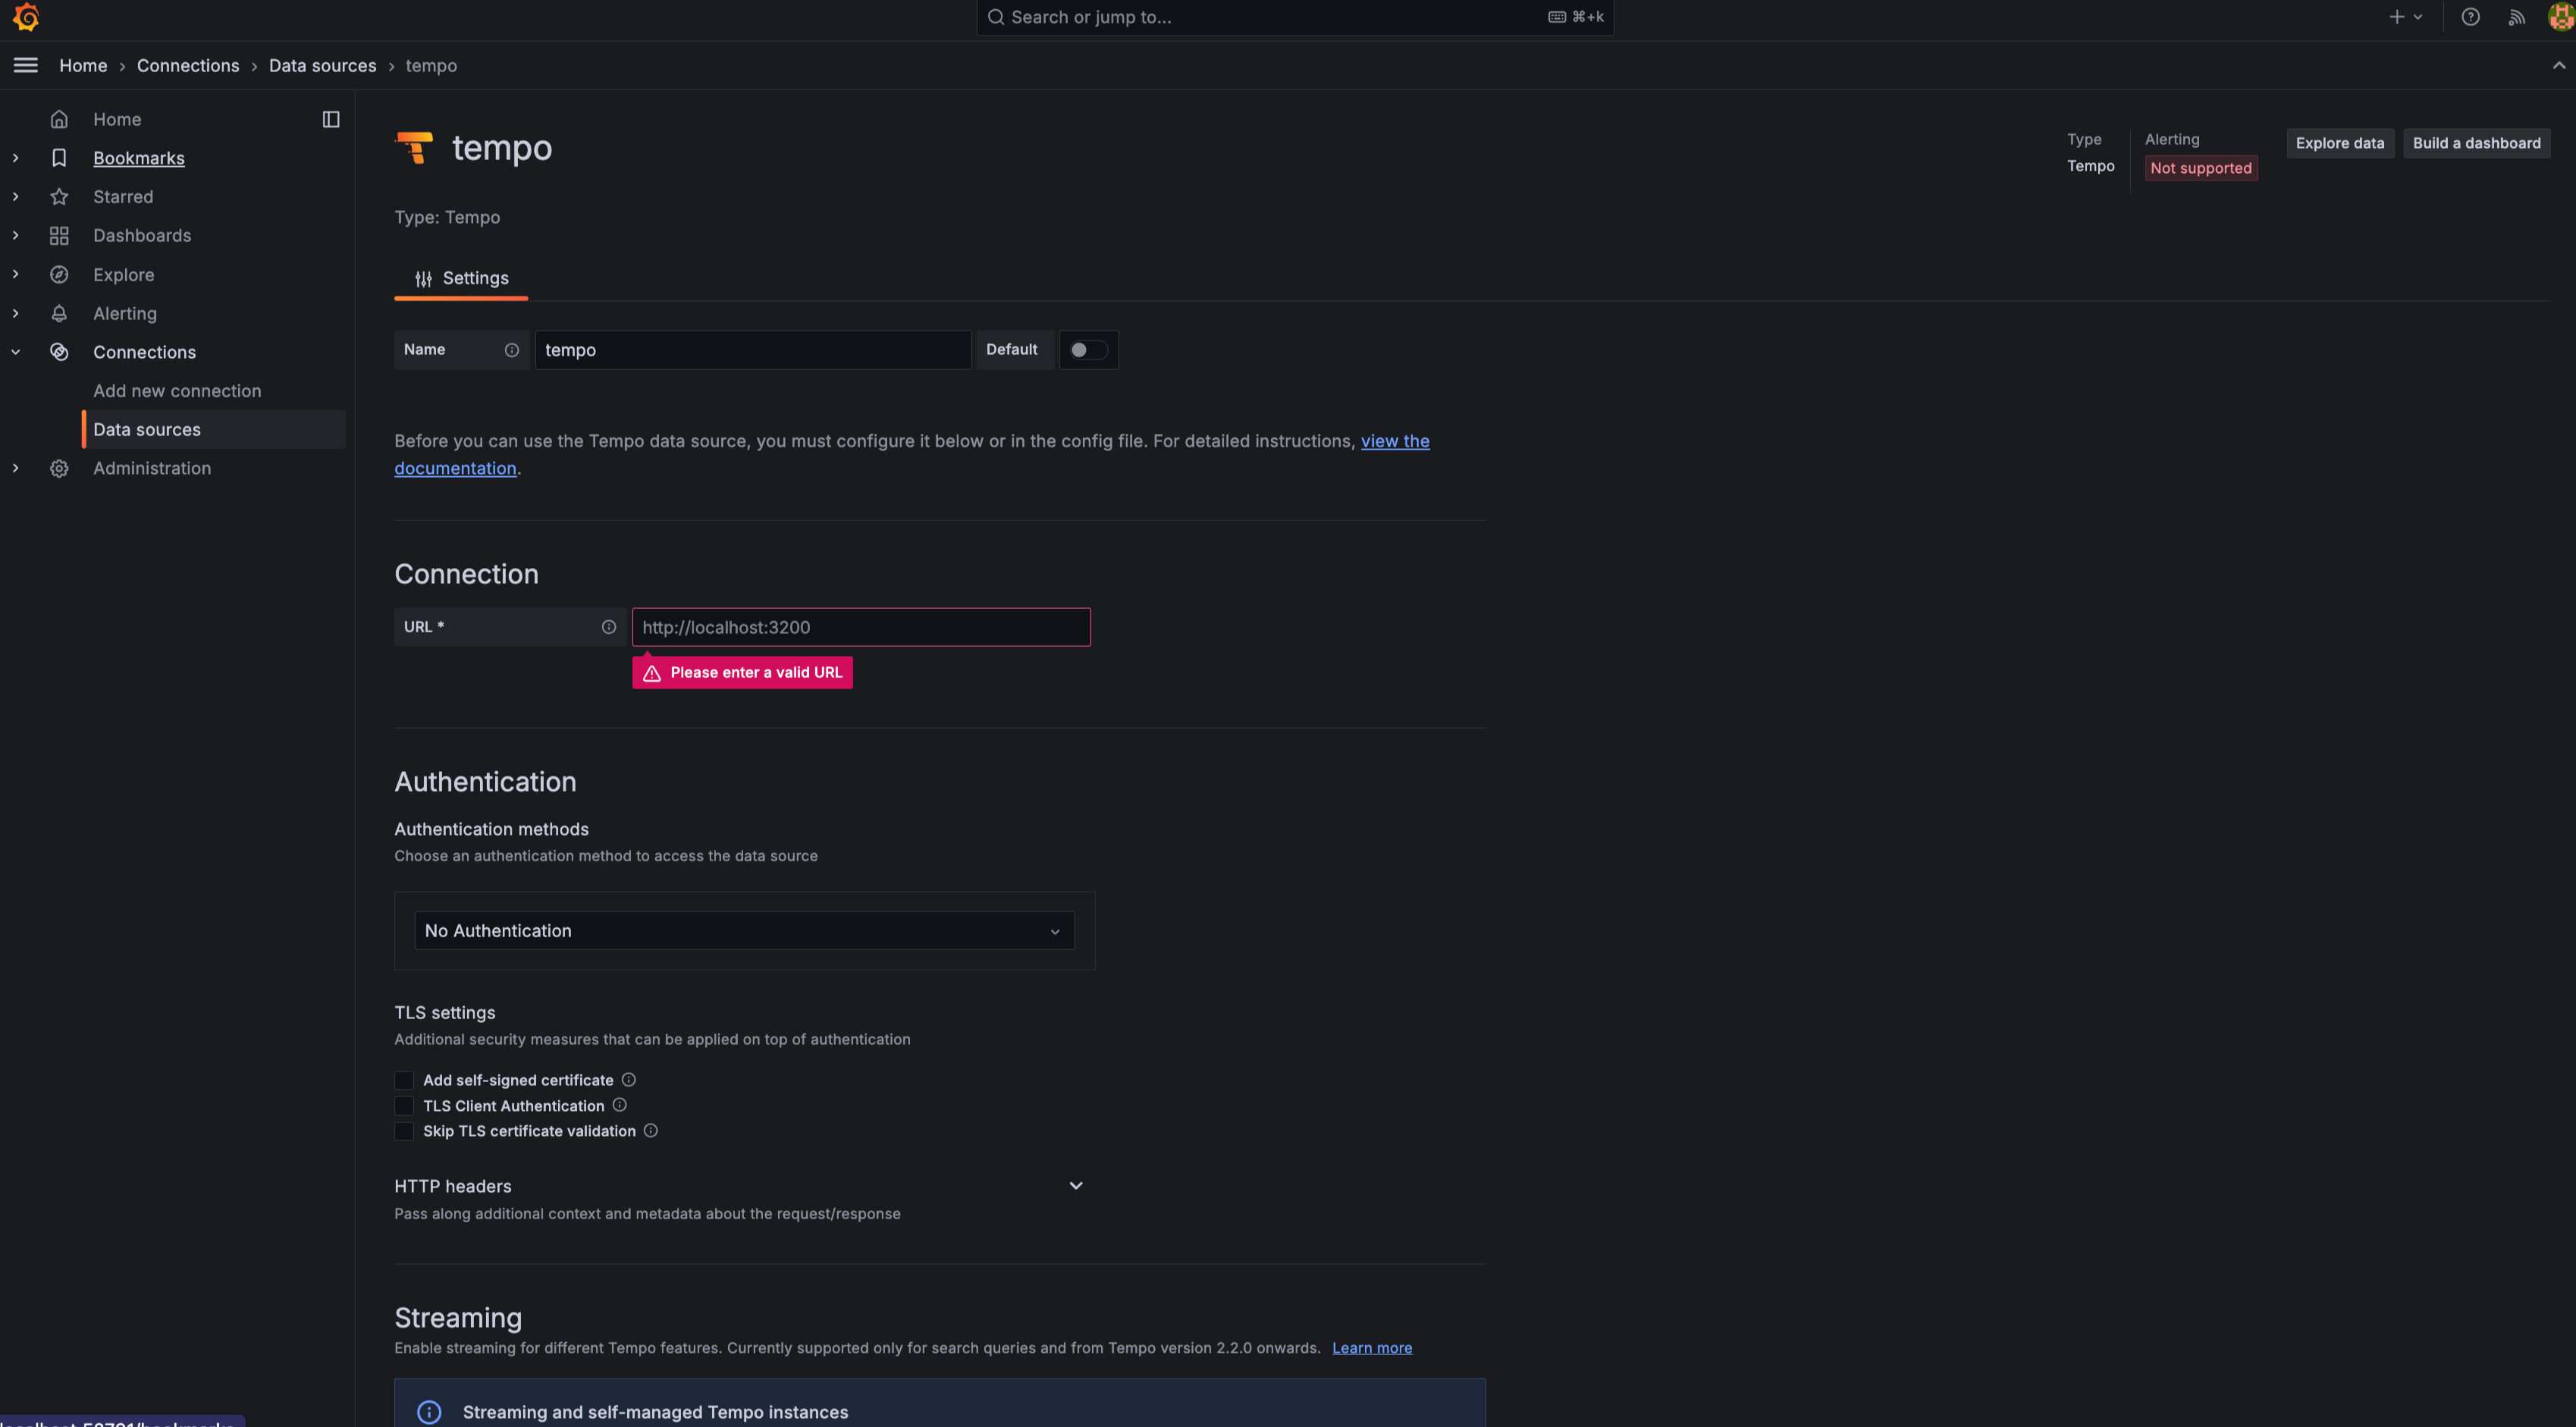
### Configure Grafana with Tempo as Trace Datasource
Configure Tempo in Grafana
In Grafana:
* Go to **Settings > Data Sources**
* Add a new **Tempo** data source
* If everything is deployed in the same namespace, set the URL as:
```http
http://tempo-distributed-gateway.tempo.svc.cluster.local:80/
```
### Install OpenTelemetry Collector (Optional)
This step allows fine-grained control over trace ingestion, processing, and exporting.
#### Step 1: Create a Collector Override
Create a file `otel-collector.yaml` and define the receivers, exporters, and pipelines.
#### Step 2: Install Collector
```bash
helm repo add open-telemetry https://open-telemetry.github.io/opentelemetry-helm-charts
helm install opentelemetry-collector open-telemetry/opentelemetry-collector -f otel-collector.yaml -n otel --create-namespace
```
### Visualize Traces in Grafana
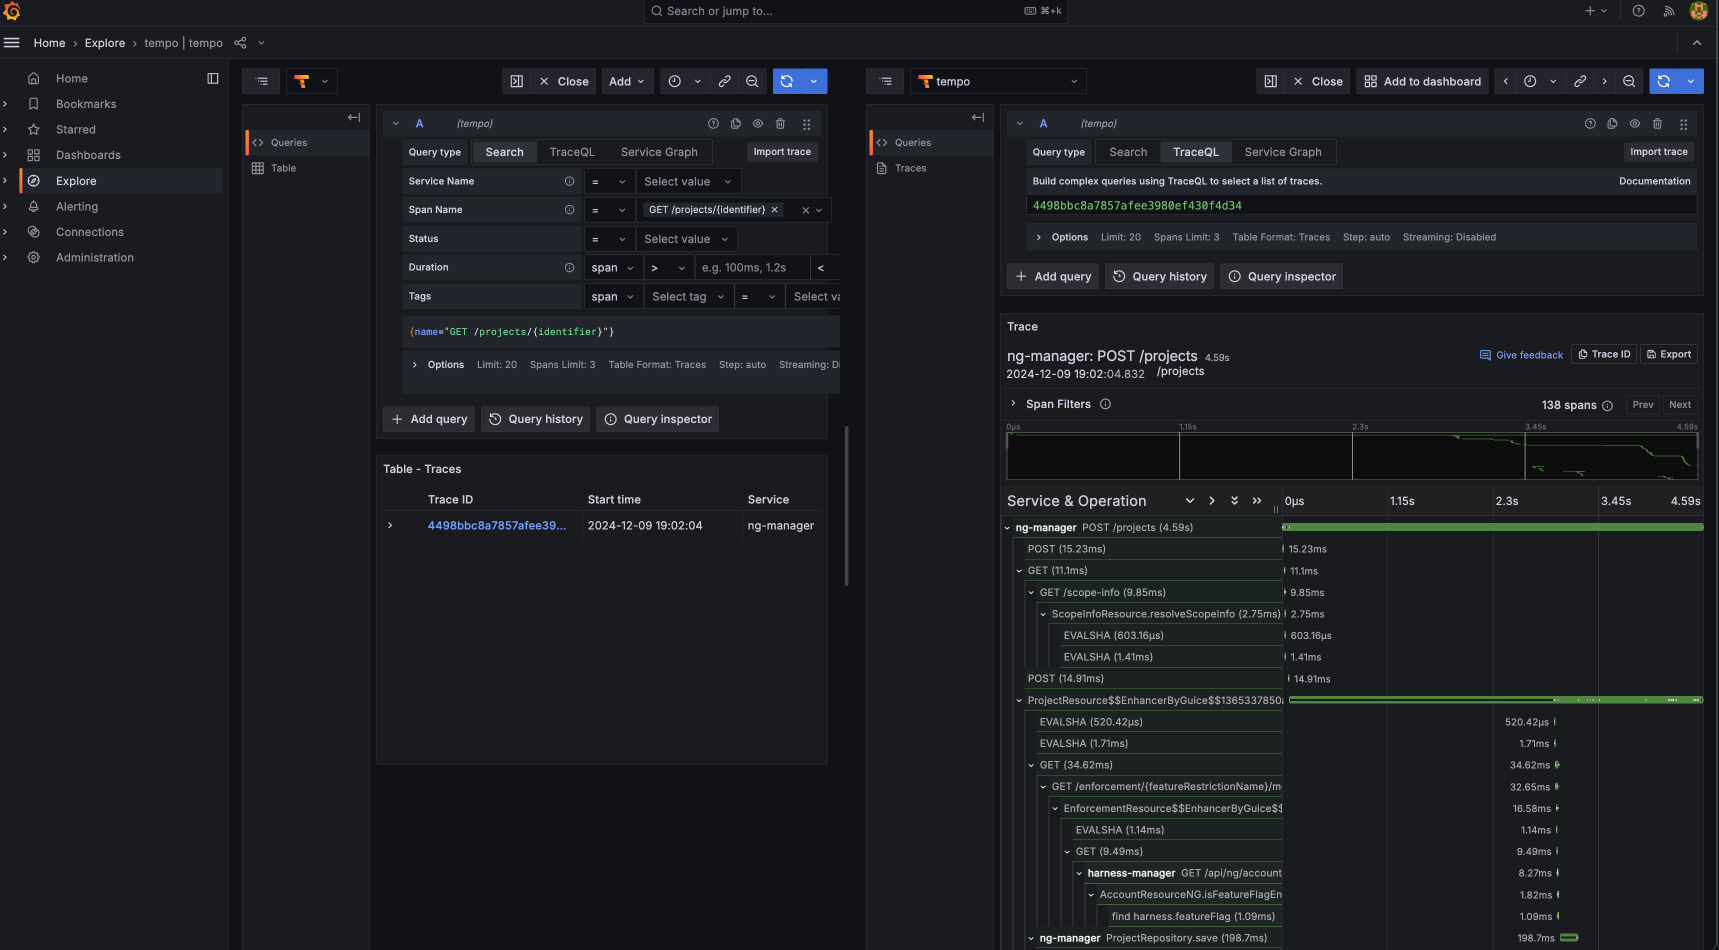
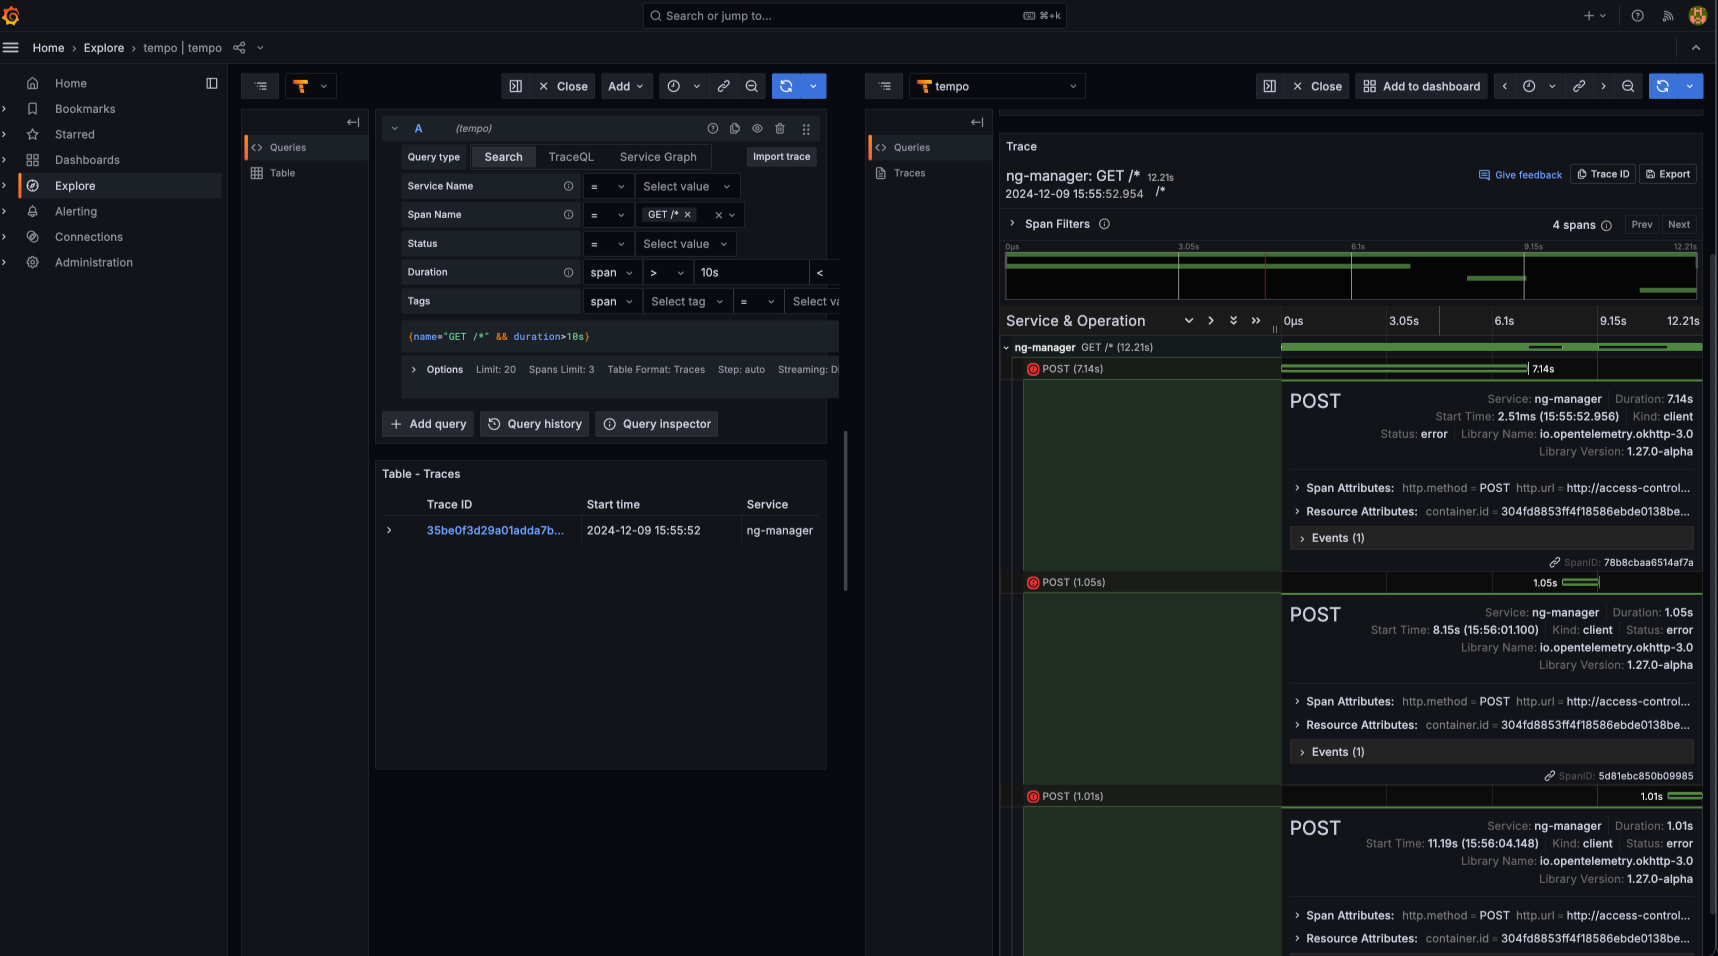
Once traces flow from Harness services through the OTel Collector and are stored in Tempo, you can use the **Traces** tab in Grafana to:
* Query traces by service name
* Explore duration, calls, and trace sizes
* Debug performance bottlenecks and error spikes
Example of browsing traces
Example of browsing traces
### Summary
This setup provides end-to-end distributed tracing visibility into Harness using:
* OpenTelemetry for instrumentation
* Tempo for trace storage and query
* Grafana for visualization
With minimal effort, you now gain deep insight into request flows across services, aiding performance debugging and reliability engineering.
{% @harness-feedback/feedback %}