> For the complete documentation index, see [llms.txt](https://developer.harness.io/llms.txt). Markdown versions of documentation pages are available by appending `.md` to page URLs; this page is available as [Markdown](https://developer.harness.io/self-managed-enterprise-edition/troubleshooting-and-resources/monitoring/overview-and-enabling-metrics.md).
# Monitoring Options
Monitor the infrastructure of your on-prem Harness Self-Managed Enterprise Edition installation.
You can monitor the infrastructure components of your Harness Self-Managed Enterprise Edition installation by bringing your own open-source monitoring system, such as Prometheus, and integrating with observability tools like Grafana.
Harness monitoring options enable you to collect and view system and service metrics, visualize them using dashboards, and configure alerts to proactively detect issues in your deployment.
***
## Requirements
Before getting started, ensure that the following requirements are met:
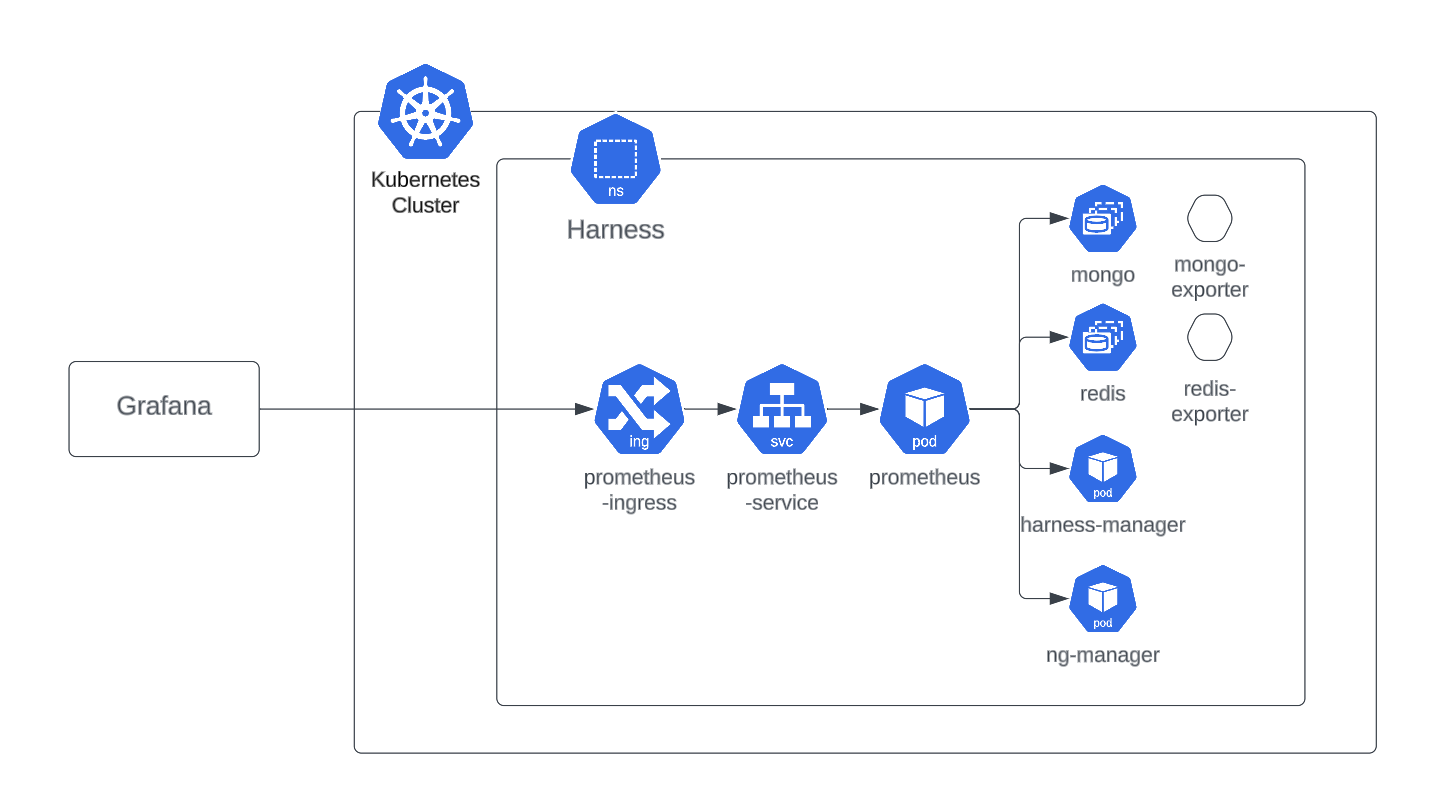
* Your services expose a `/metrics` endpoint, for example: `ng-manager:8889/metrics`.
* Prometheus is installed in the same Kubernetes cluster as your Harness services.
* You have access to configure Prometheus either internally or via an ingress-based endpoint for external tools like Grafana.
Figure 1: Example of a monitoring setup for Harness Self-Managed Enterprise Edition.
***
## Enabling Prometheus Metrics in Harness Services
To make your Harness components and databases export metrics to Prometheus, add the following values to your Helm release using a `monitoring.yaml` override file. You can find the base example in the [Harness Helm charts repository](https://github.com/harness/helm-charts/blob/main/src/harness/monitoring.yaml).
{% hint style="info" %}
This example uses the Bitnami-packaged Prometheus operator as the metrics collection engine.
{% endhint %}
```yaml
bootstrap:
database:
mongodb:
metrics:
enabled: true
podAnnotations:
prometheus.io/path: /metrics
prometheus.io/port: '9216'
prometheus.io/scrape: 'true'
redis:
metrics:
enabled: true
podAnnotations:
prometheus.io/path: /metrics
prometheus.io/port: '9121'
prometheus.io/scrape: 'true'
timescaledb:
prometheus:
enabled: true
podAnnotations:
prometheus.io/path: /metrics
prometheus.io/port: '9187'
prometheus.io/scrape: 'true'
postgresql:
metrics:
enabled: true
primary:
podAnnotations:
prometheus.io/path: /metrics
prometheus.io/port: '9187'
prometheus.io/scrape: 'true'
global:
monitoring:
enabled: true
port: 8889
path: /metrics
managedPlatform: "oss"
```
Once these values are applied and Prometheus is set up using the [Install Prometheus](/self-managed-enterprise-edition/troubleshooting-and-resources/monitoring/install-prometheus.md) guide, metrics will be automatically scraped and visualized using your chosen observability tools.
***
## Optional: Redis Stream Monitoring
For advanced monitoring of Redis stream utilization and event framework activity, you can optionally deploy the **Redis Stream Monitor**. This provides detailed metrics about stream length, memory usage, consumer lag, and dead letter queue sizes across all Harness event streams.
This is particularly useful for monitoring entire events activity under Harness and troubleshooting event processing issues. See [Enable Redis Stream Monitors](/self-managed-enterprise-edition/troubleshooting-and-resources/monitoring/enable-redis-stream-monitors.md) for detailed setup instructions.
{% @harness-feedback/feedback %}