> For the complete documentation index, see [llms.txt](https://developer.harness.io/llms.txt). Markdown versions of documentation pages are available by appending `.md` to page URLs; this page is available as [Markdown](https://developer.harness.io/service-reliability-management/use-srm/srm-dashboards/srm-dashboard-slo-health.md).
# SLO Health
Understand the SLO Health dashboard.
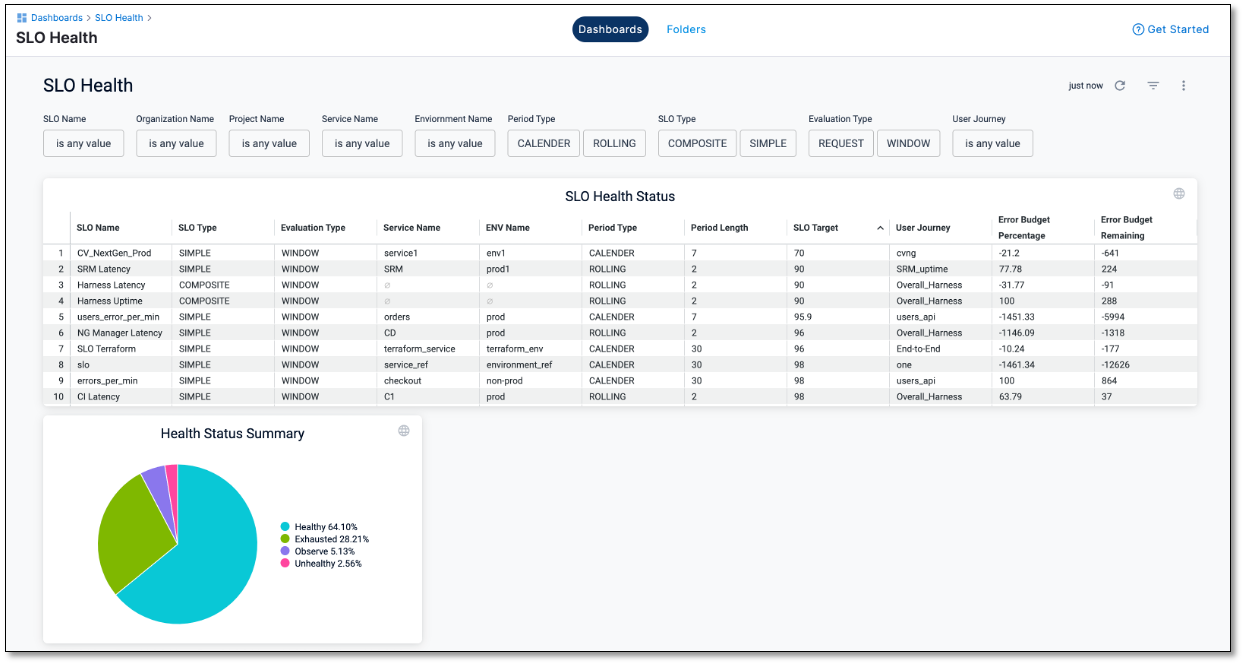
The SLO Health dashboard, in its default configuration, provides comprehensive insights into all the SLOs within your Harness organization.
## View SLO Health dashboard
To access the SLO Health dashboard, do the following:
1. Within your Harness project, navigate to **Dashboards**. On the Dashboards page, select **Service Reliability**.
The dashboard list is displayed, which includes the default SLO Health and SLO History dashboards.
2. Select the **SLO Health** dashboard.
The SLO Health dashboard is displayed.
## Explore SLO Health dashboard
SLO Health dashboard consists of the following key components:
* [SLO Health Status tile](#slo-health-status-tile)
* [Health Status Summary tile](#health-status-summary-tile)
### SLO Health Status tile
The SLO Health Status tile displays the following information:
* **SLO name**: The name of the SLO.
* **SLO type**: The type or category of the SLO. For example, simple or composite.
* **Evaluation type**: The method used for evaluating the SLO. For example, window or request based.
* **Environment name**: The environment where the SLO is applied. For example, production, Terraform, and so on.
* **Service name**: The name of the service associated with the SLO.
* **Period length**: The duration over which the SLO is measured.
* **Period type**: The type of time period for measurement. For example, calendar or rolling.
* **SLO Target**: Your set SLO target percentage.
* **SLI percentage**: The percentage of Service Level Indicators (SLIs) achieved for the corresponding SLOs. SLIs are specific metrics used to evaluate SLOs.
* **User journey**: The specific user journey associated with the SLO.
* **Error budget percentage**: The percentage of error budget consumed.
* **Remaining error budget percentage**: The remaining portion of the error budget.
{% hint style="info" %}
**NOTE**
You can customize the data displayed in the SLO Health Status tile using filters to focus on specific aspects of your SLO health metrics.
{% endhint %}
### Health Status Summary tile
The Health Status Summary tile provides a visual summary of the data presented in the SLO Health Status tile. It includes:
* **Percentage of SLOs that are healthy, unhealthy, and need attention**: This gives you an overall picture of the health status of your SLOs.
* **Percentage of SLOs whose error budgets are exhausted**: This is a summary of SLOs that have gone beyond their allocated error budgets.
* **Percentage of SLOs that need observation**: This indicates which SLOs require additional monitoring and analysis.
{% @harness-feedback/feedback %}