Create chaos experiment from a blank canvas
In this tutorial, you will create chaos experiments from scratch and execute them on the sample boutique application.
This experiment follows the same steps of your first chaos experiment by creating a chaos environment and infrastructure and using the same boutique application by targeting the pods of the cart microservice, except the way you create an experiment. Creating a chaos experiment involves the following steps:
- Create a project/receiving an invite for a project with relevant access;
- Create an environment;
- Create a chaos infrastructure;
- Create a chaos experiment.
In the last step, instead of choosing a pre-defined experiment, you will choose from a variety of experiments. This way of choosing a chaos experiment from a list will set the foundation for you to understand how to execute different experiments on different platforms with varied targets based on your requirements.
Before you begin
- What is chaos engineering?
- Prerequisites to execute chaos experiments
- Execute your first chaos experiment using a template
Step 1: Set up environment and infrastructure
- Follow the steps to set up your environment and chaos infrastructure.
Step 2: Construct a chaos experiment from a blank canvas
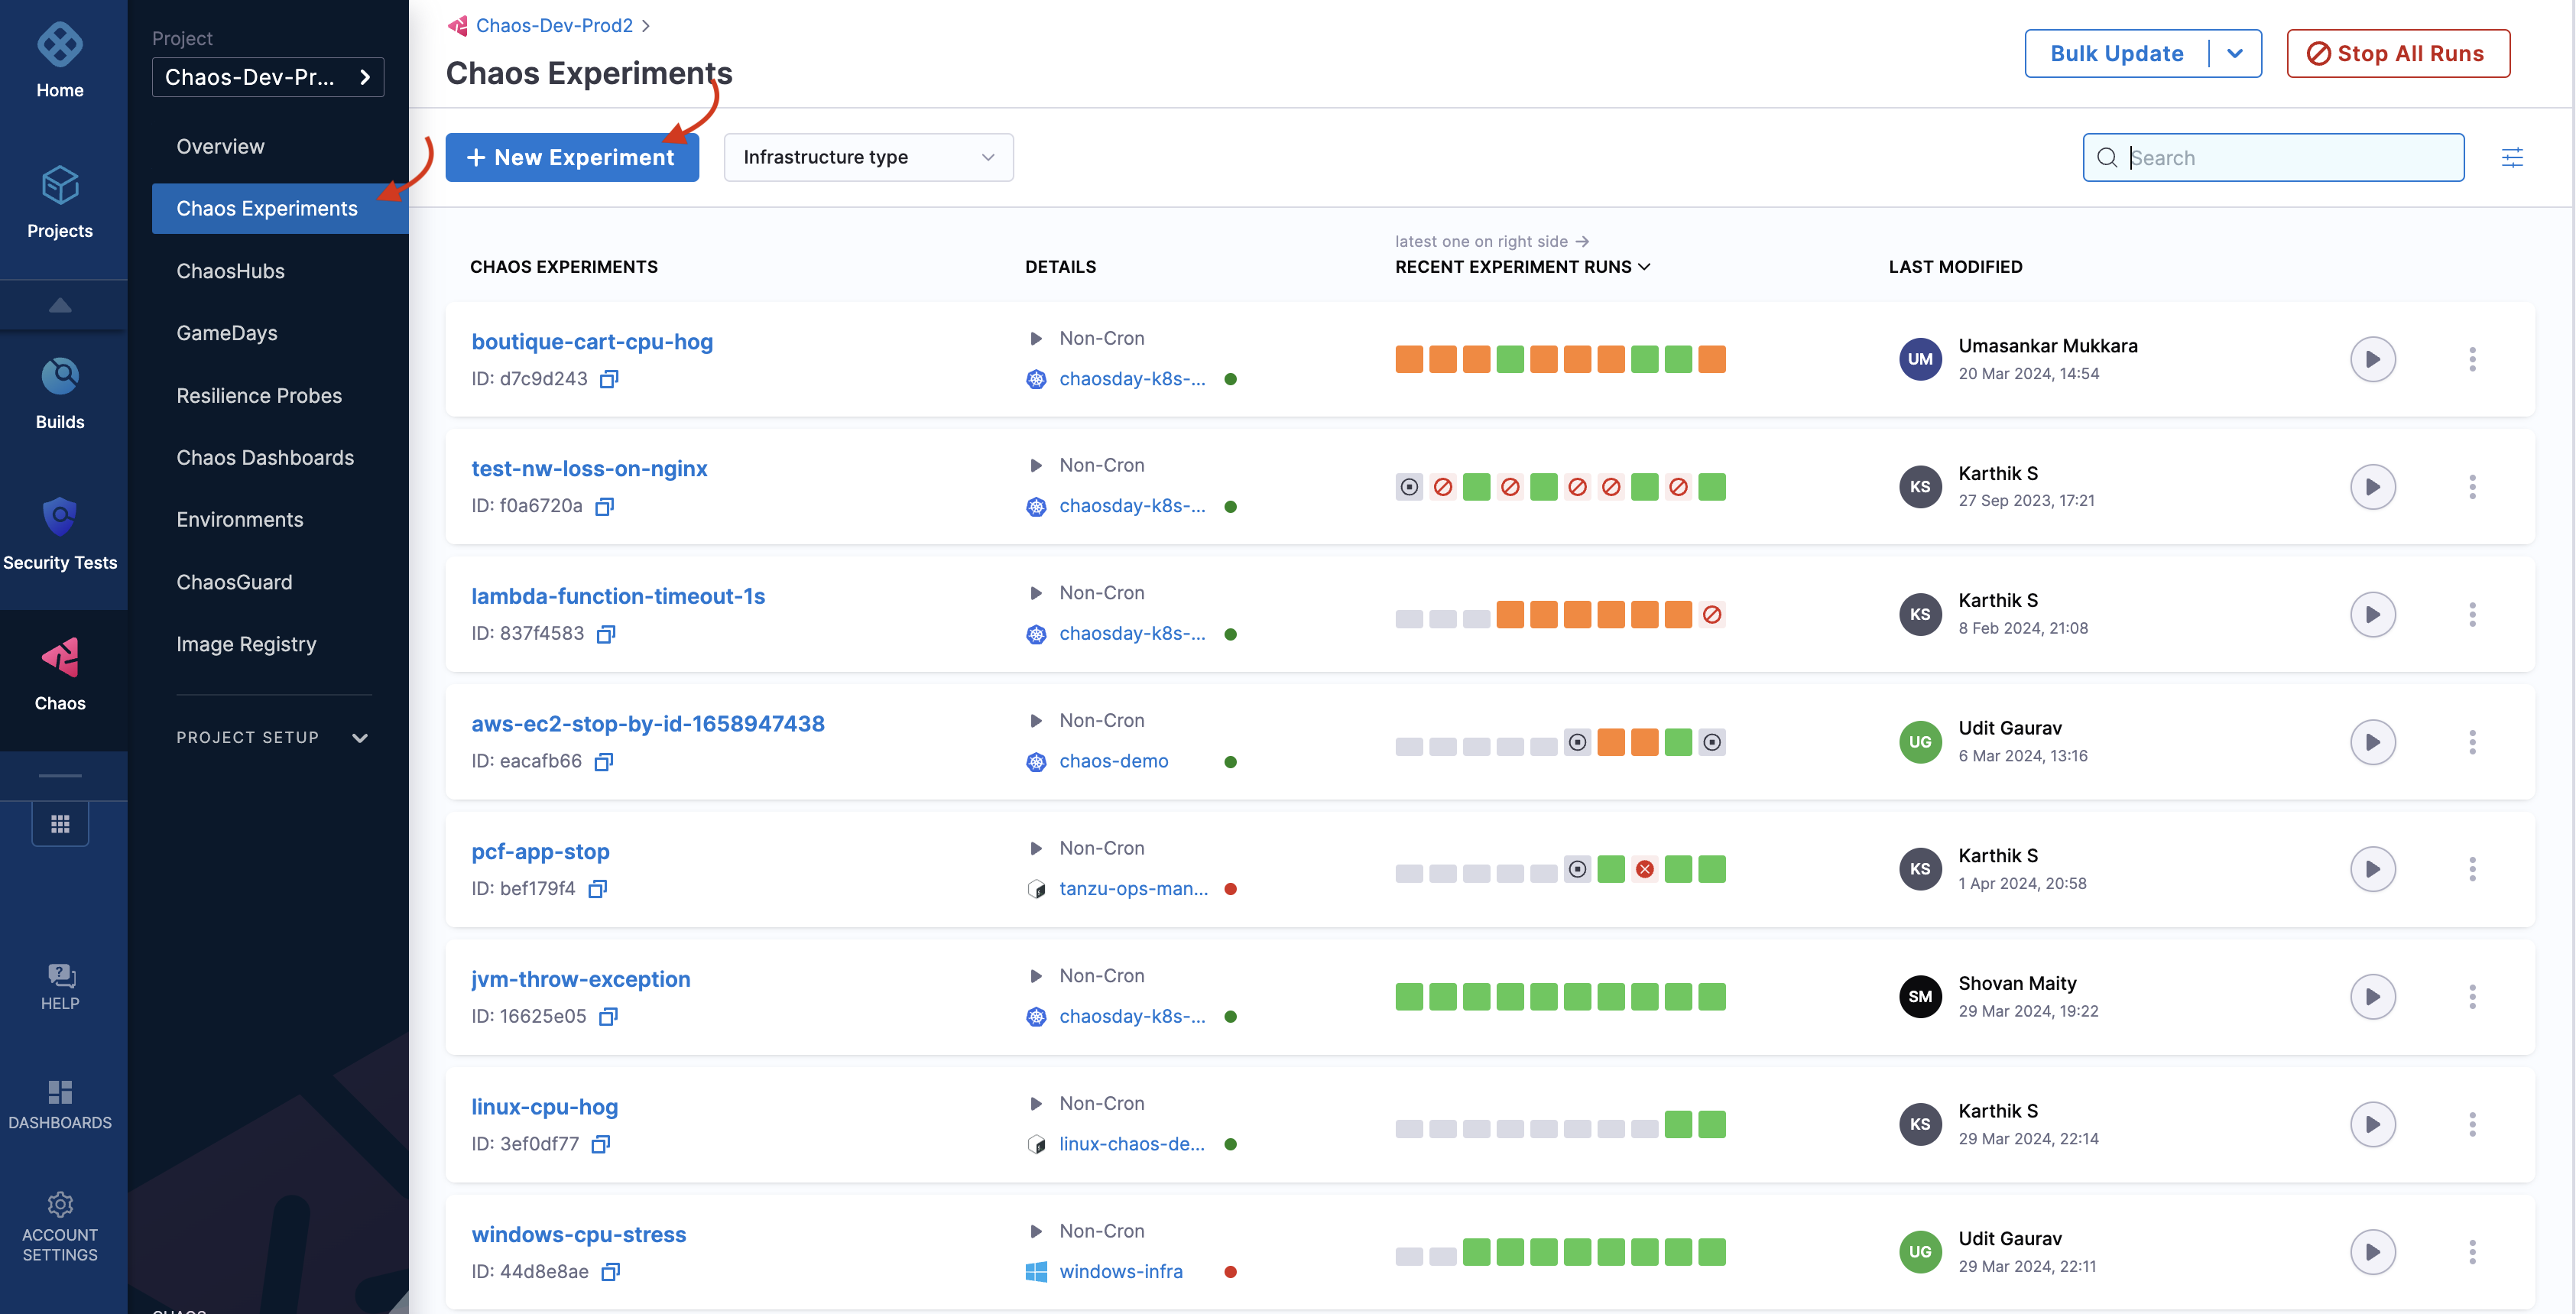
- Once you have your environment and chaos infrastructure in place, you can create a chaos experiment. To create an experiment, navigate to Chaos Experiments in the left nav, and then select New Experiment.
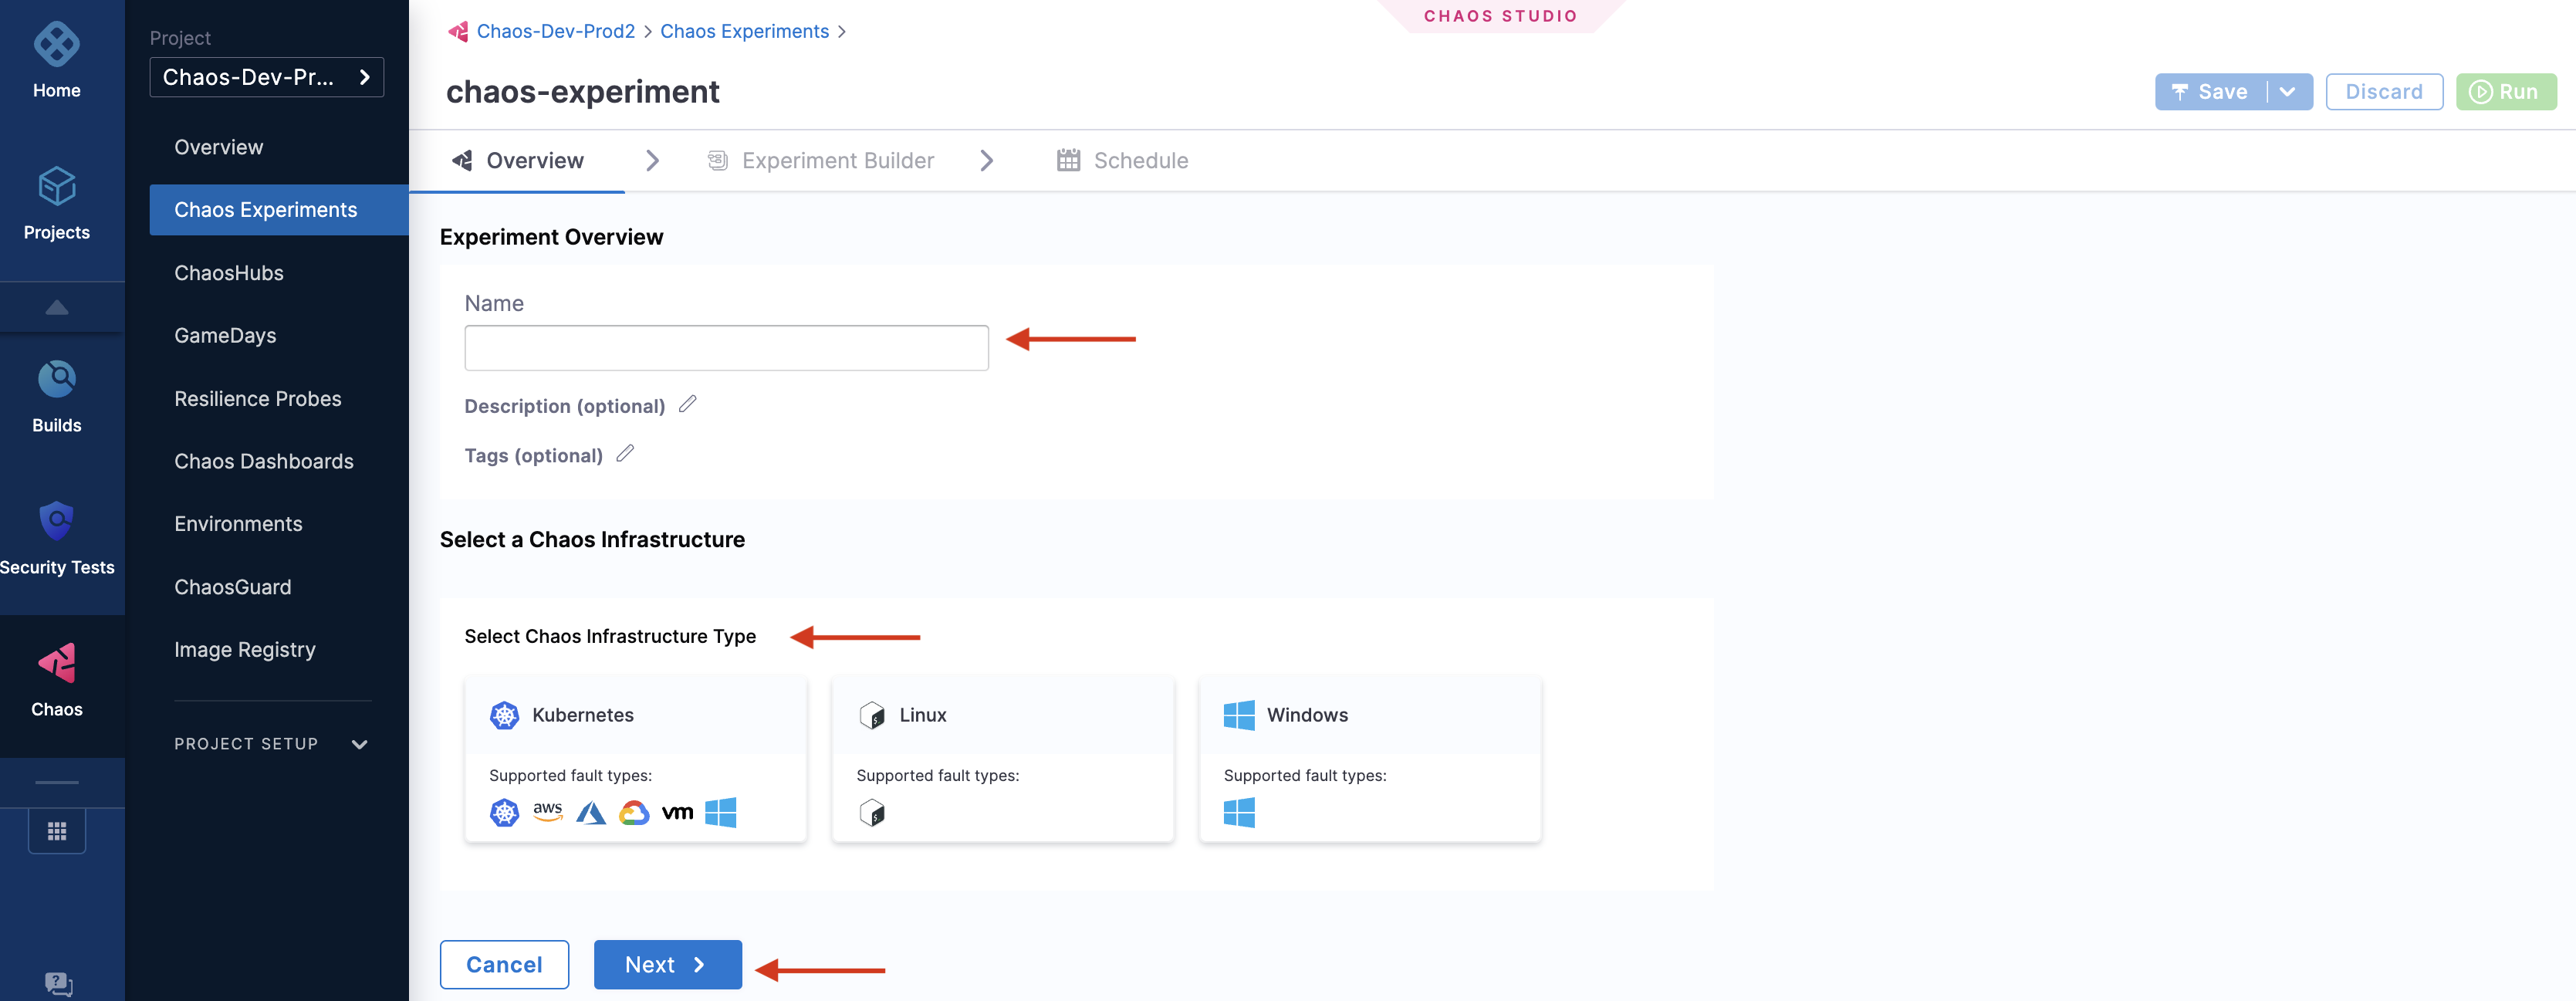
- Specify the experiment name, a description (optional), and tags (optional). Choose the target infrastructure, click Apply, and click Next.
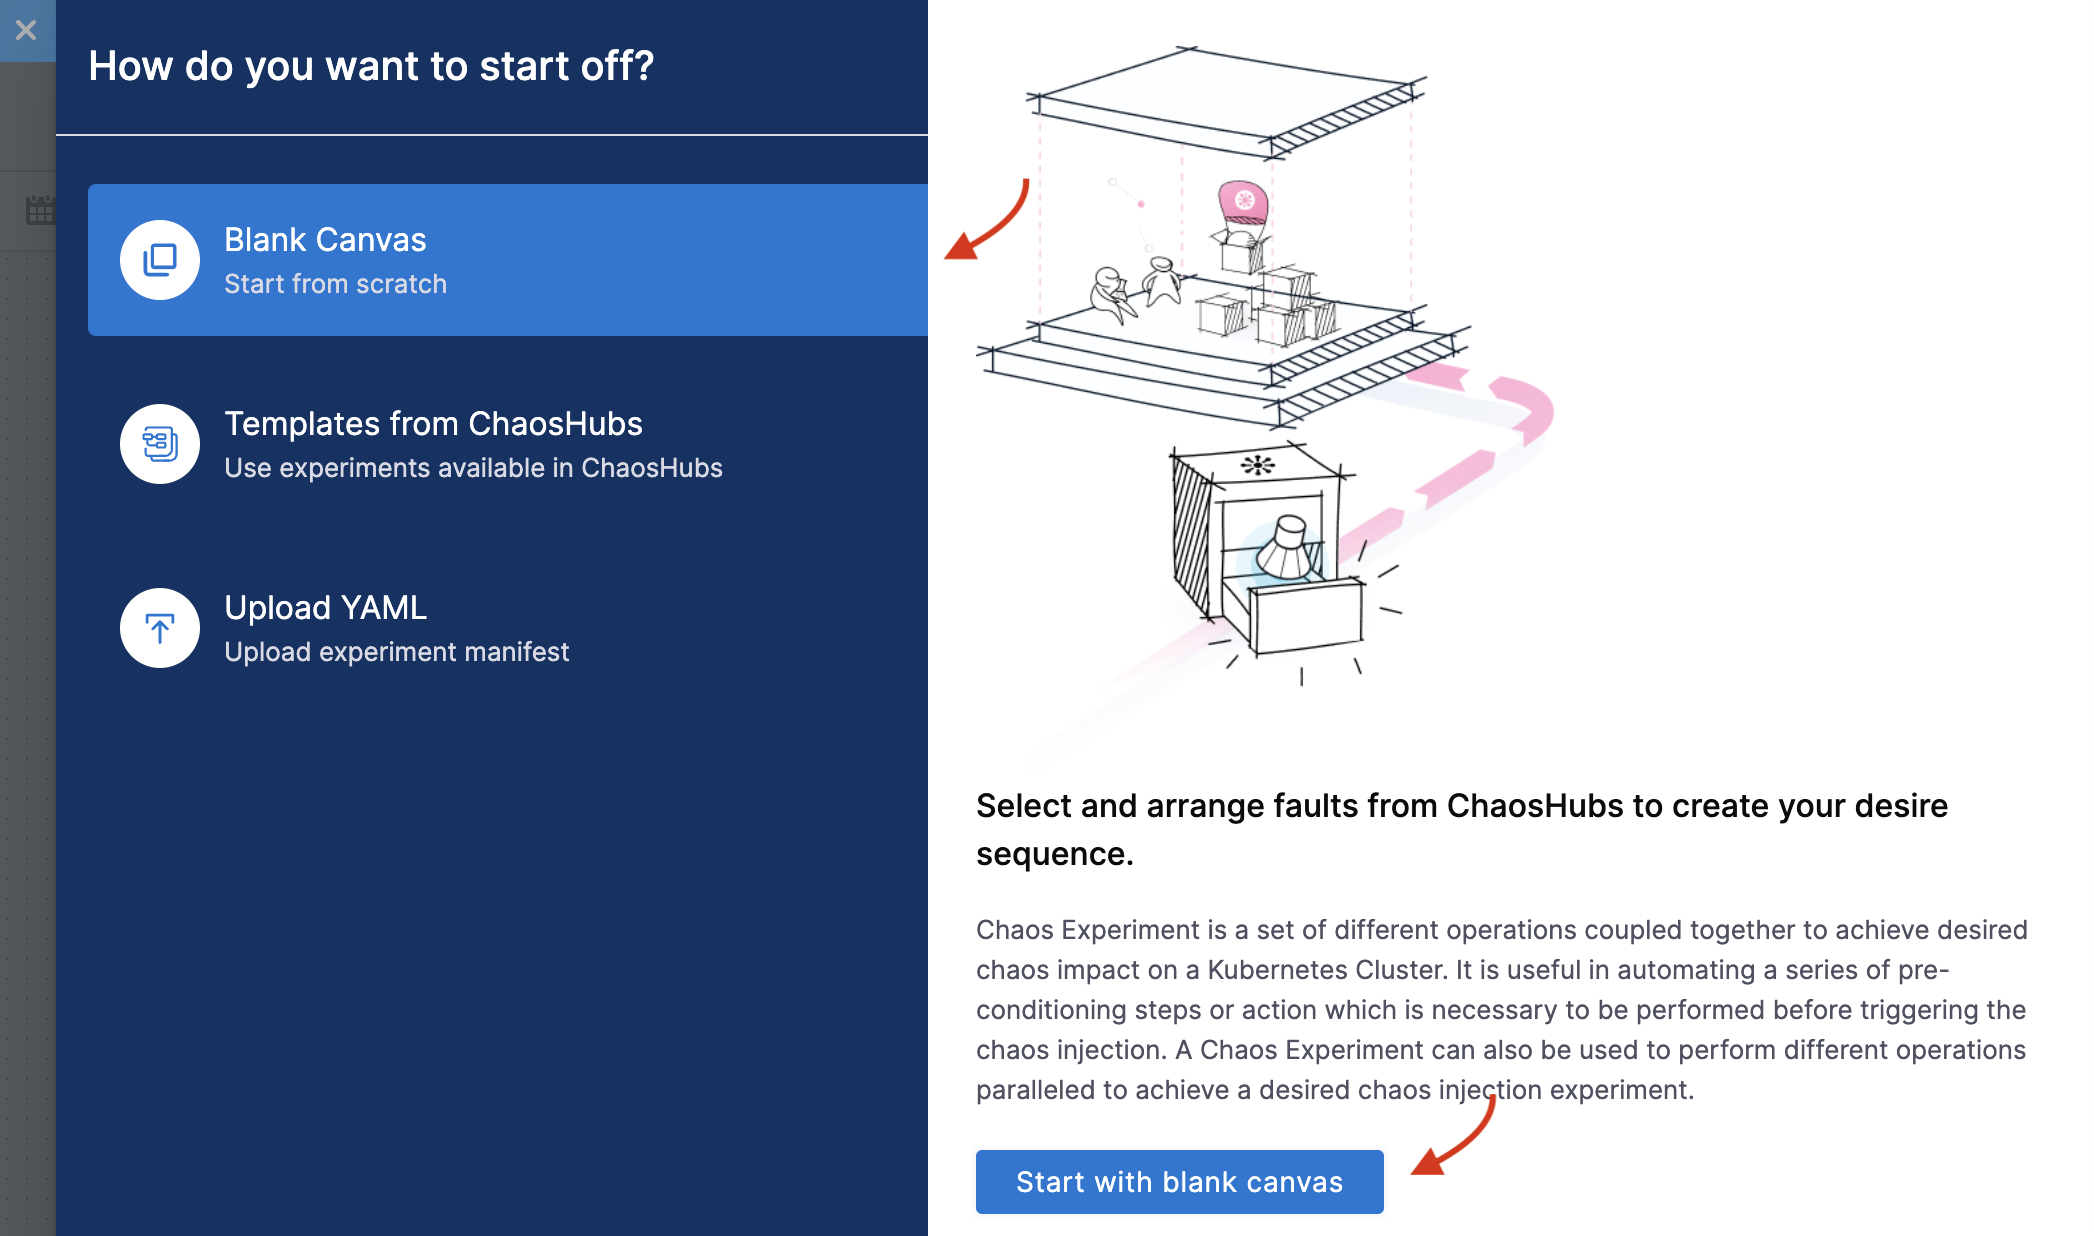
- In the Experiment Builder, select Blank Canvas and click Start with blank canvas.
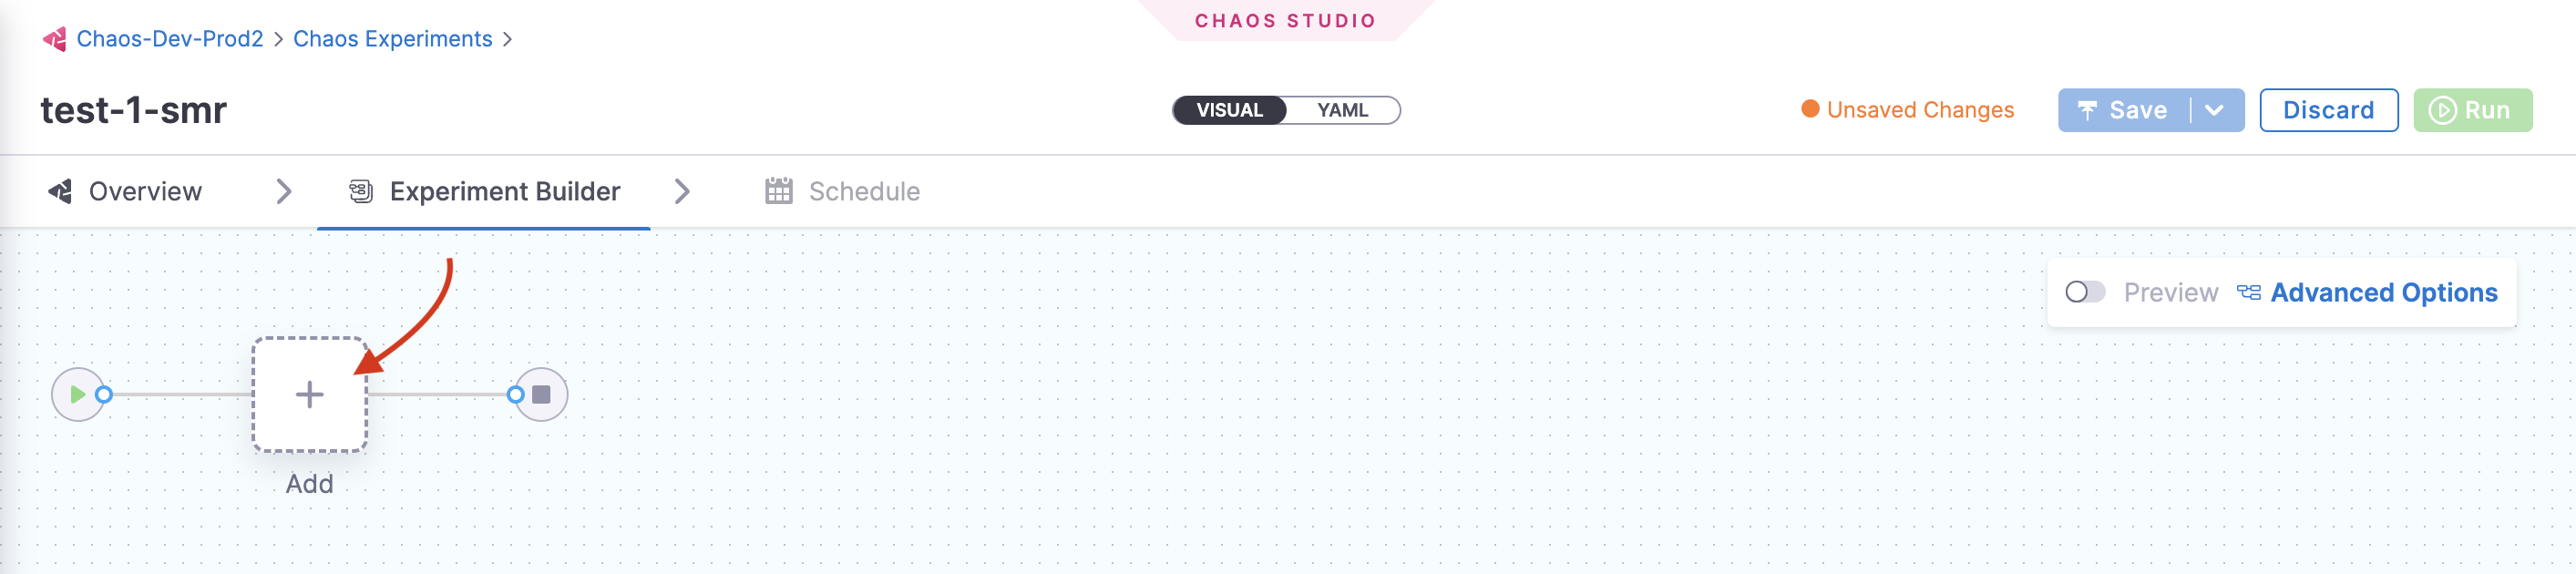
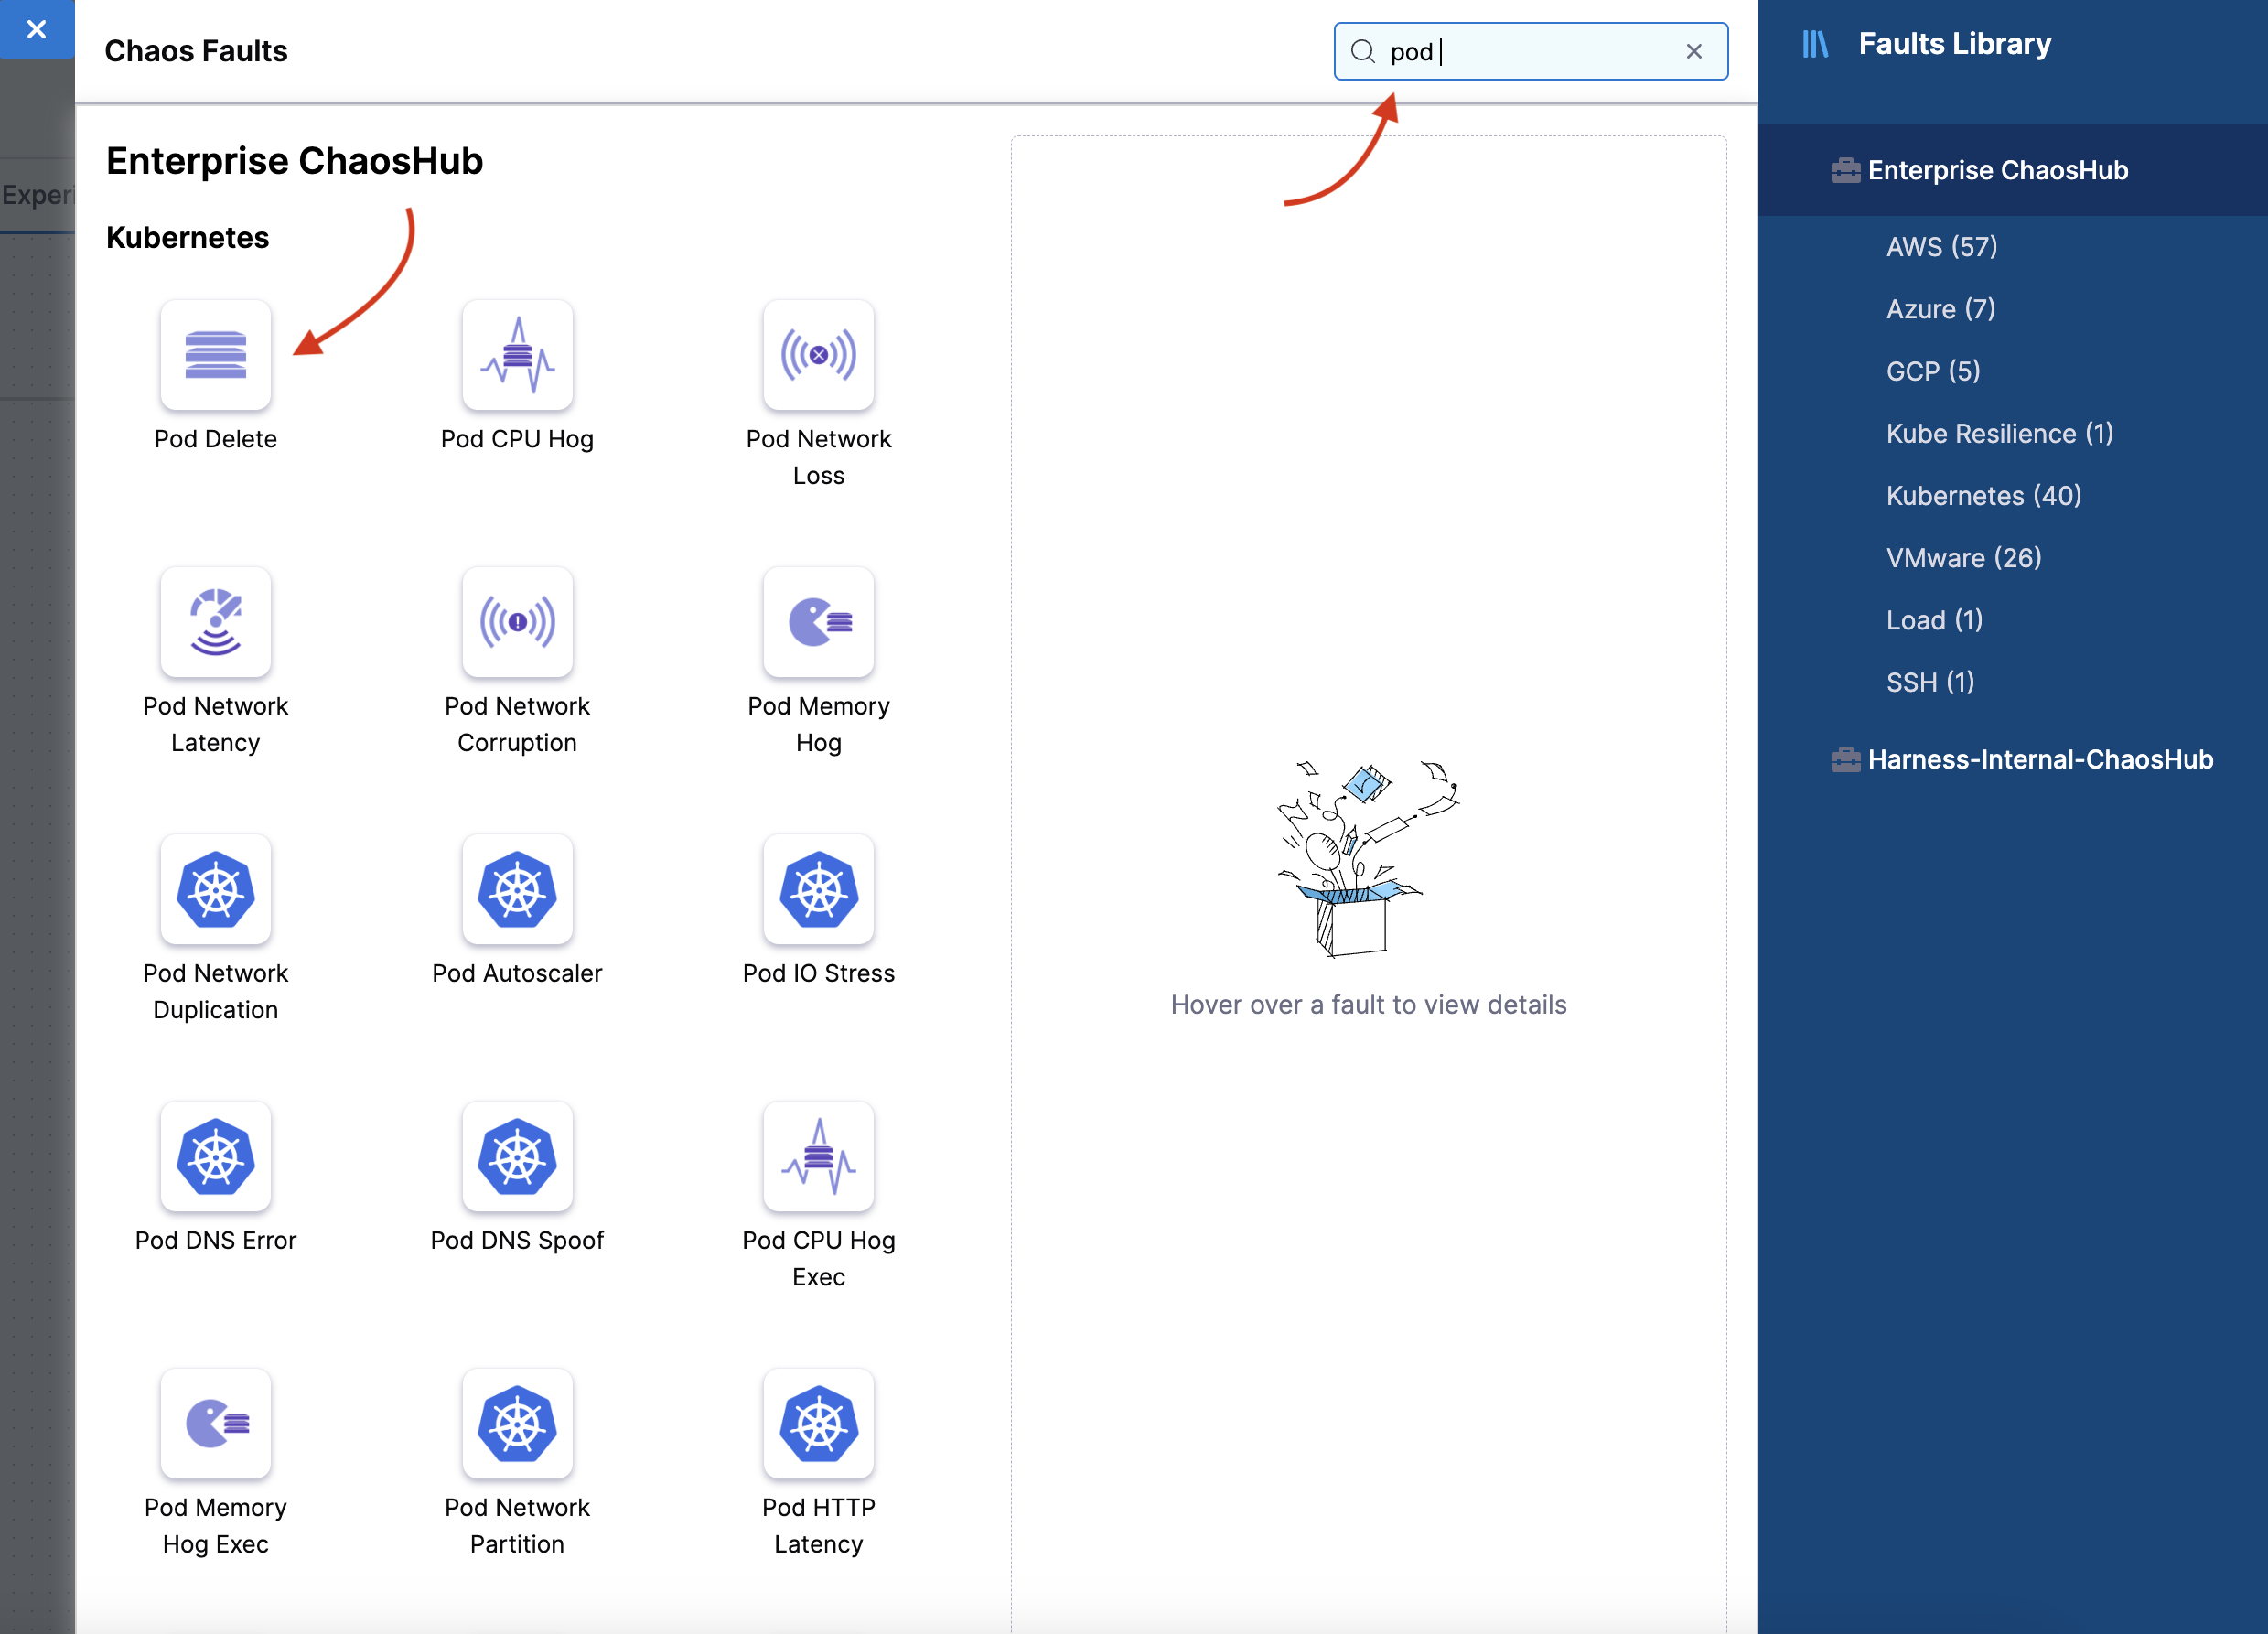
- This opens the page where you can add chaos faults to your experiment. Click Add.
- Search for "pod delete" in the search bar and select "Pod Delete" fault from the result of the search.
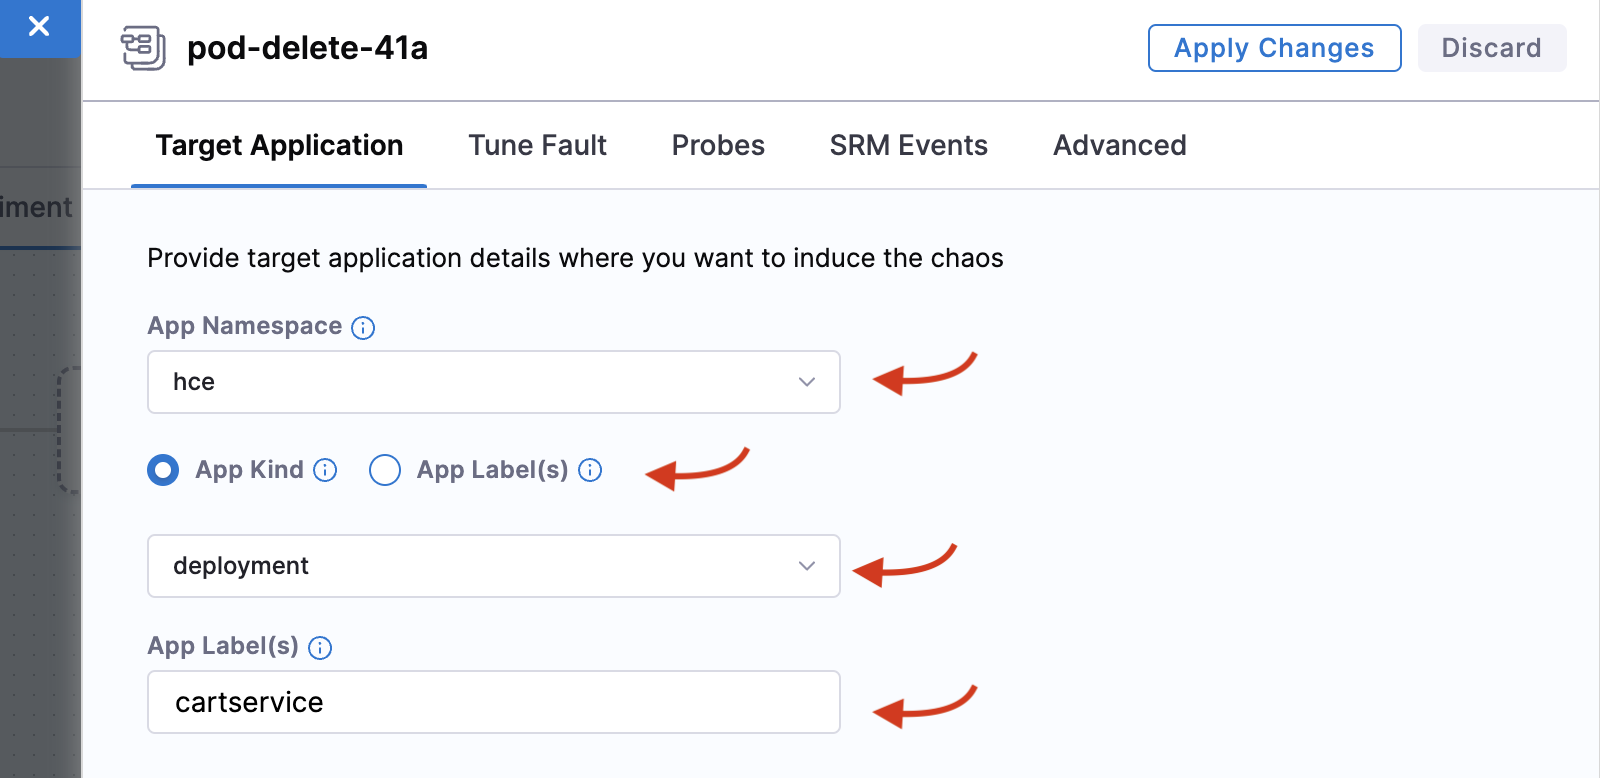
- Add details in the Target Application tab, such as the
hcenamespace,app=cartservicelabel, and application kinddeployment.
- In the Tune Fault tab, specify TOTAL CHAOS DURATION as 30, CHAOS INTERVAL as 5, PODS AFFECTED PERC as 50, and the default weight to 10.
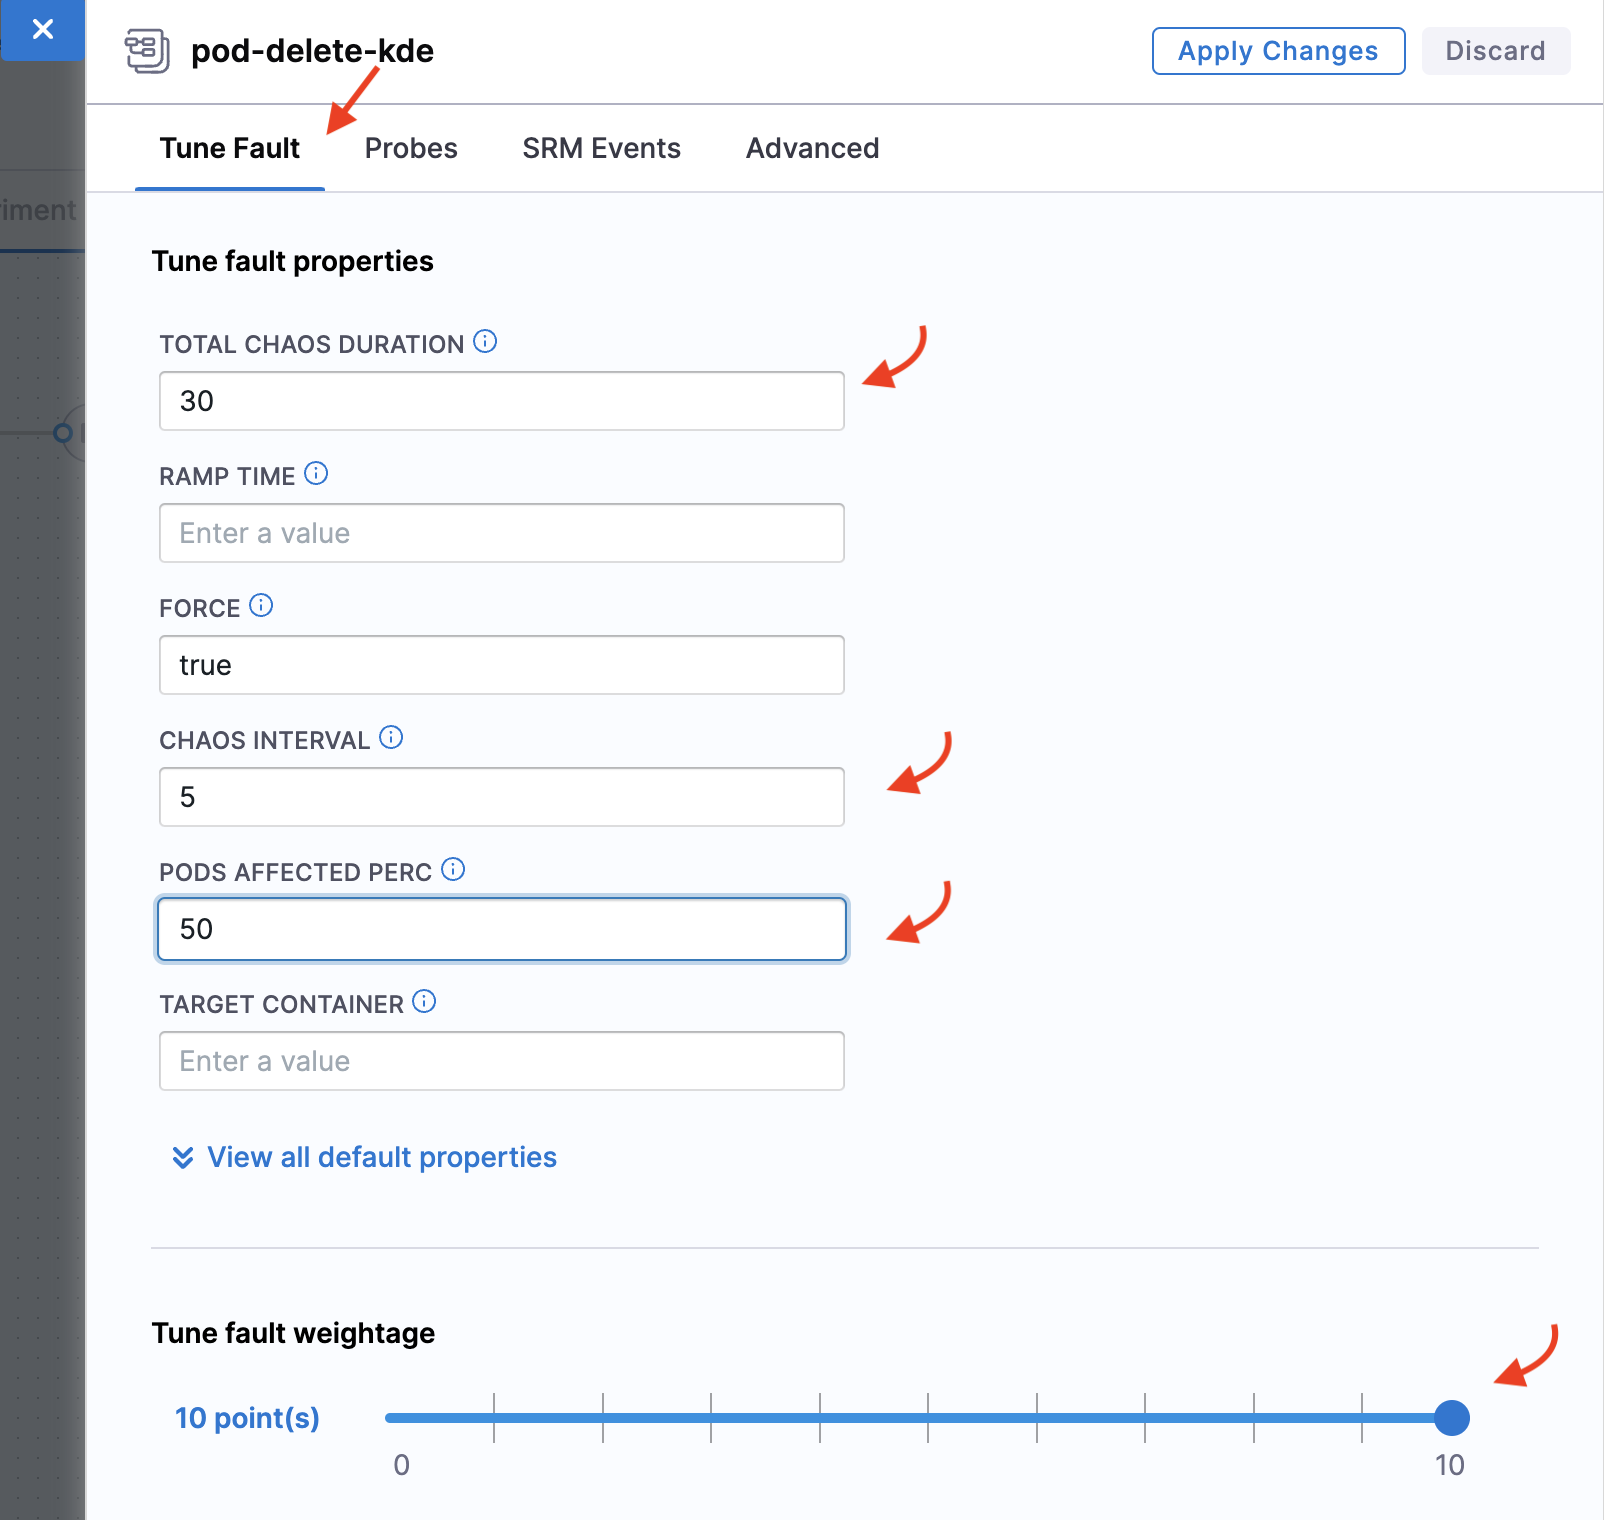
The PODS AFFECTED PERC describes the percentage of pods that are affected due to the unexpected pod deletion. A minimum of one pod is deleted.
Step 3: Create a new HTTP probe
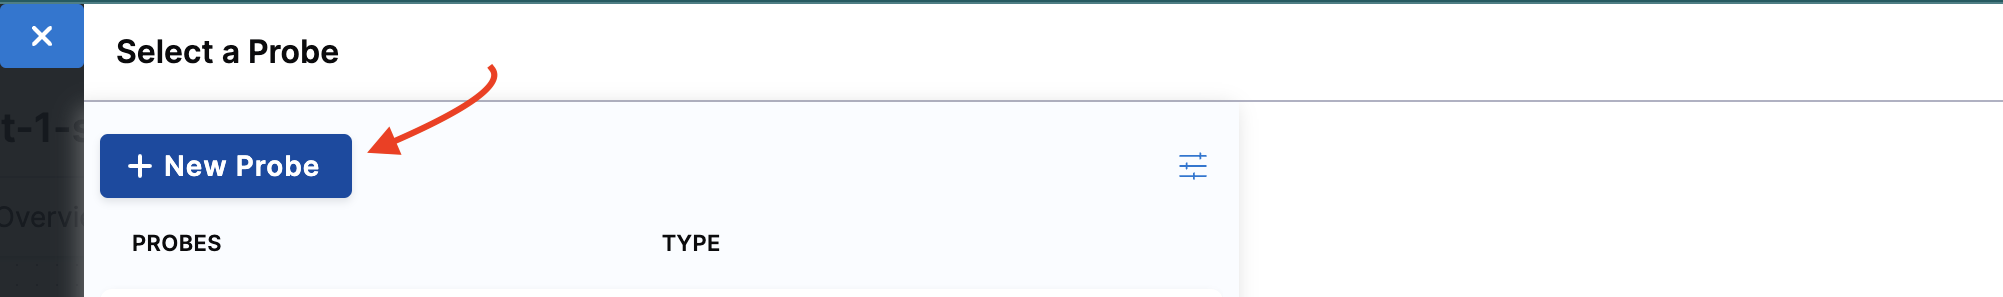
- In the Probes tab, you can create a new probe. For this, click Select or Add new probes.
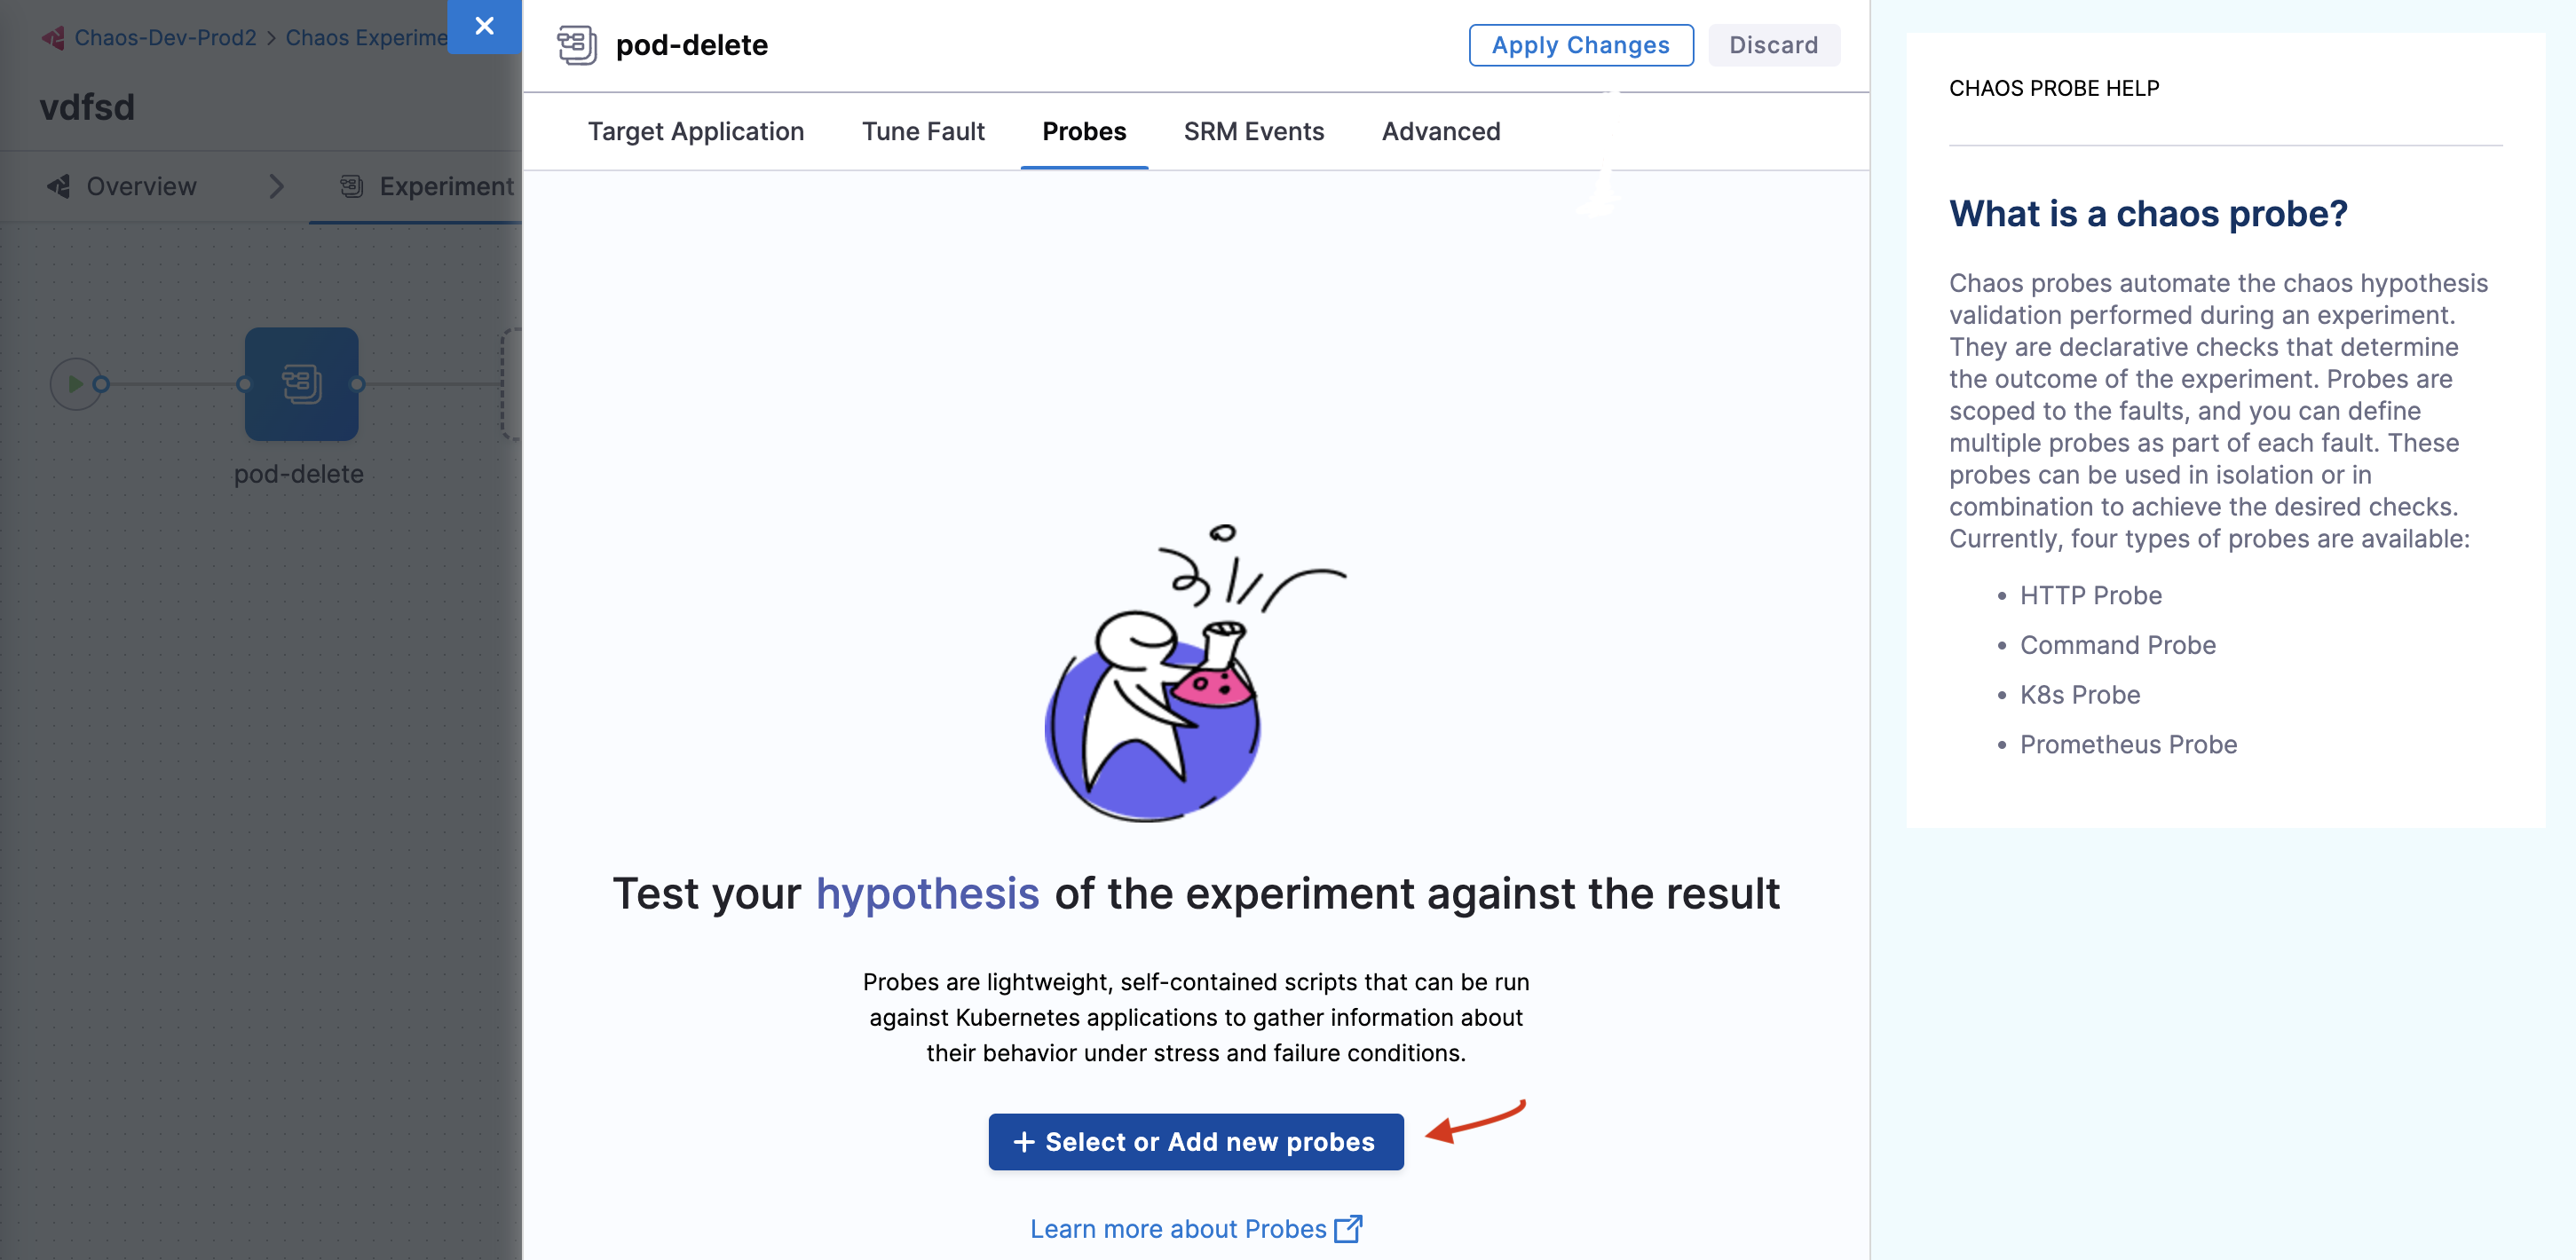
- Select New probe.
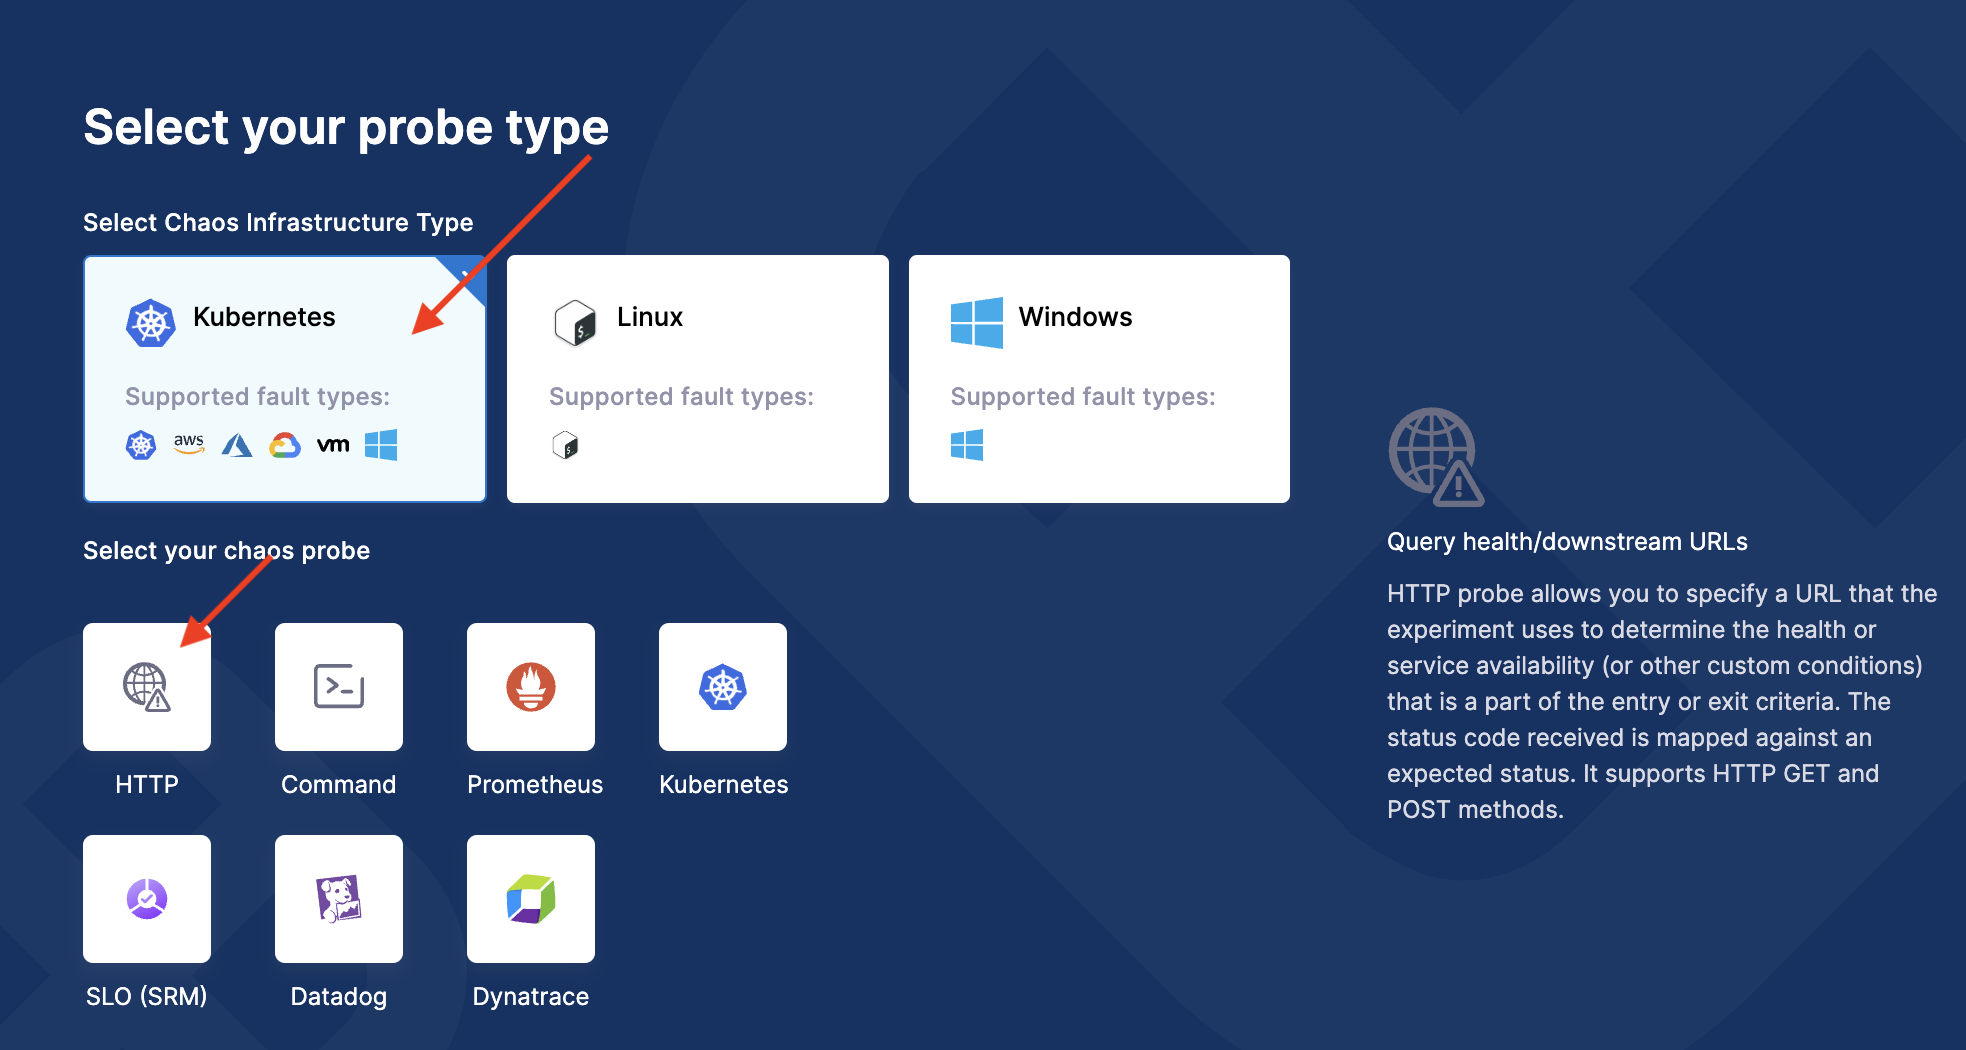
- Select Kubernetes as the infrastructure type, and HTTP as the probe type. This opens the probe configuration screen.
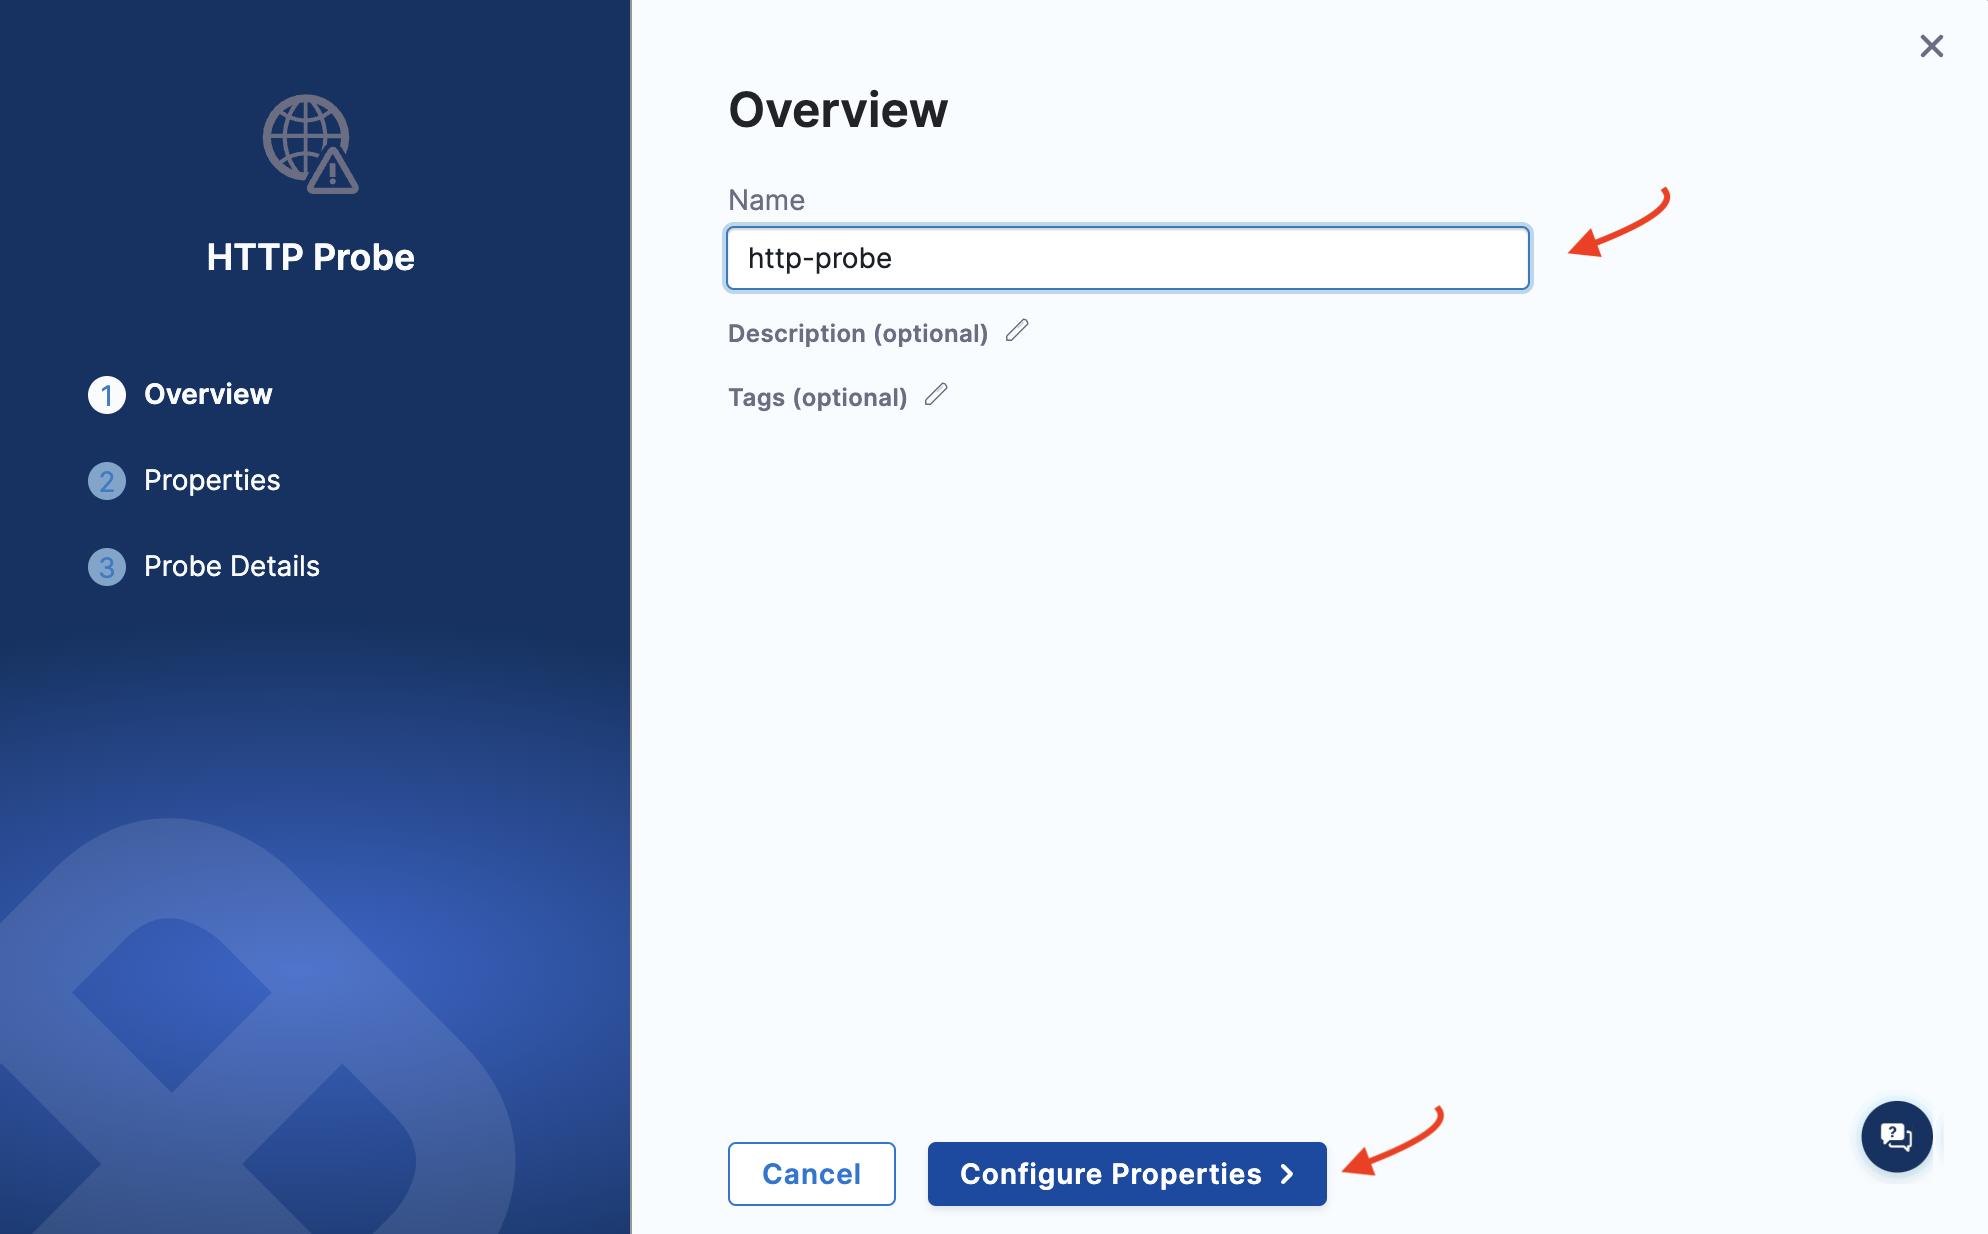
- Specify the name of the probe, description (optional), and tag (optional). Click Configure Properties.
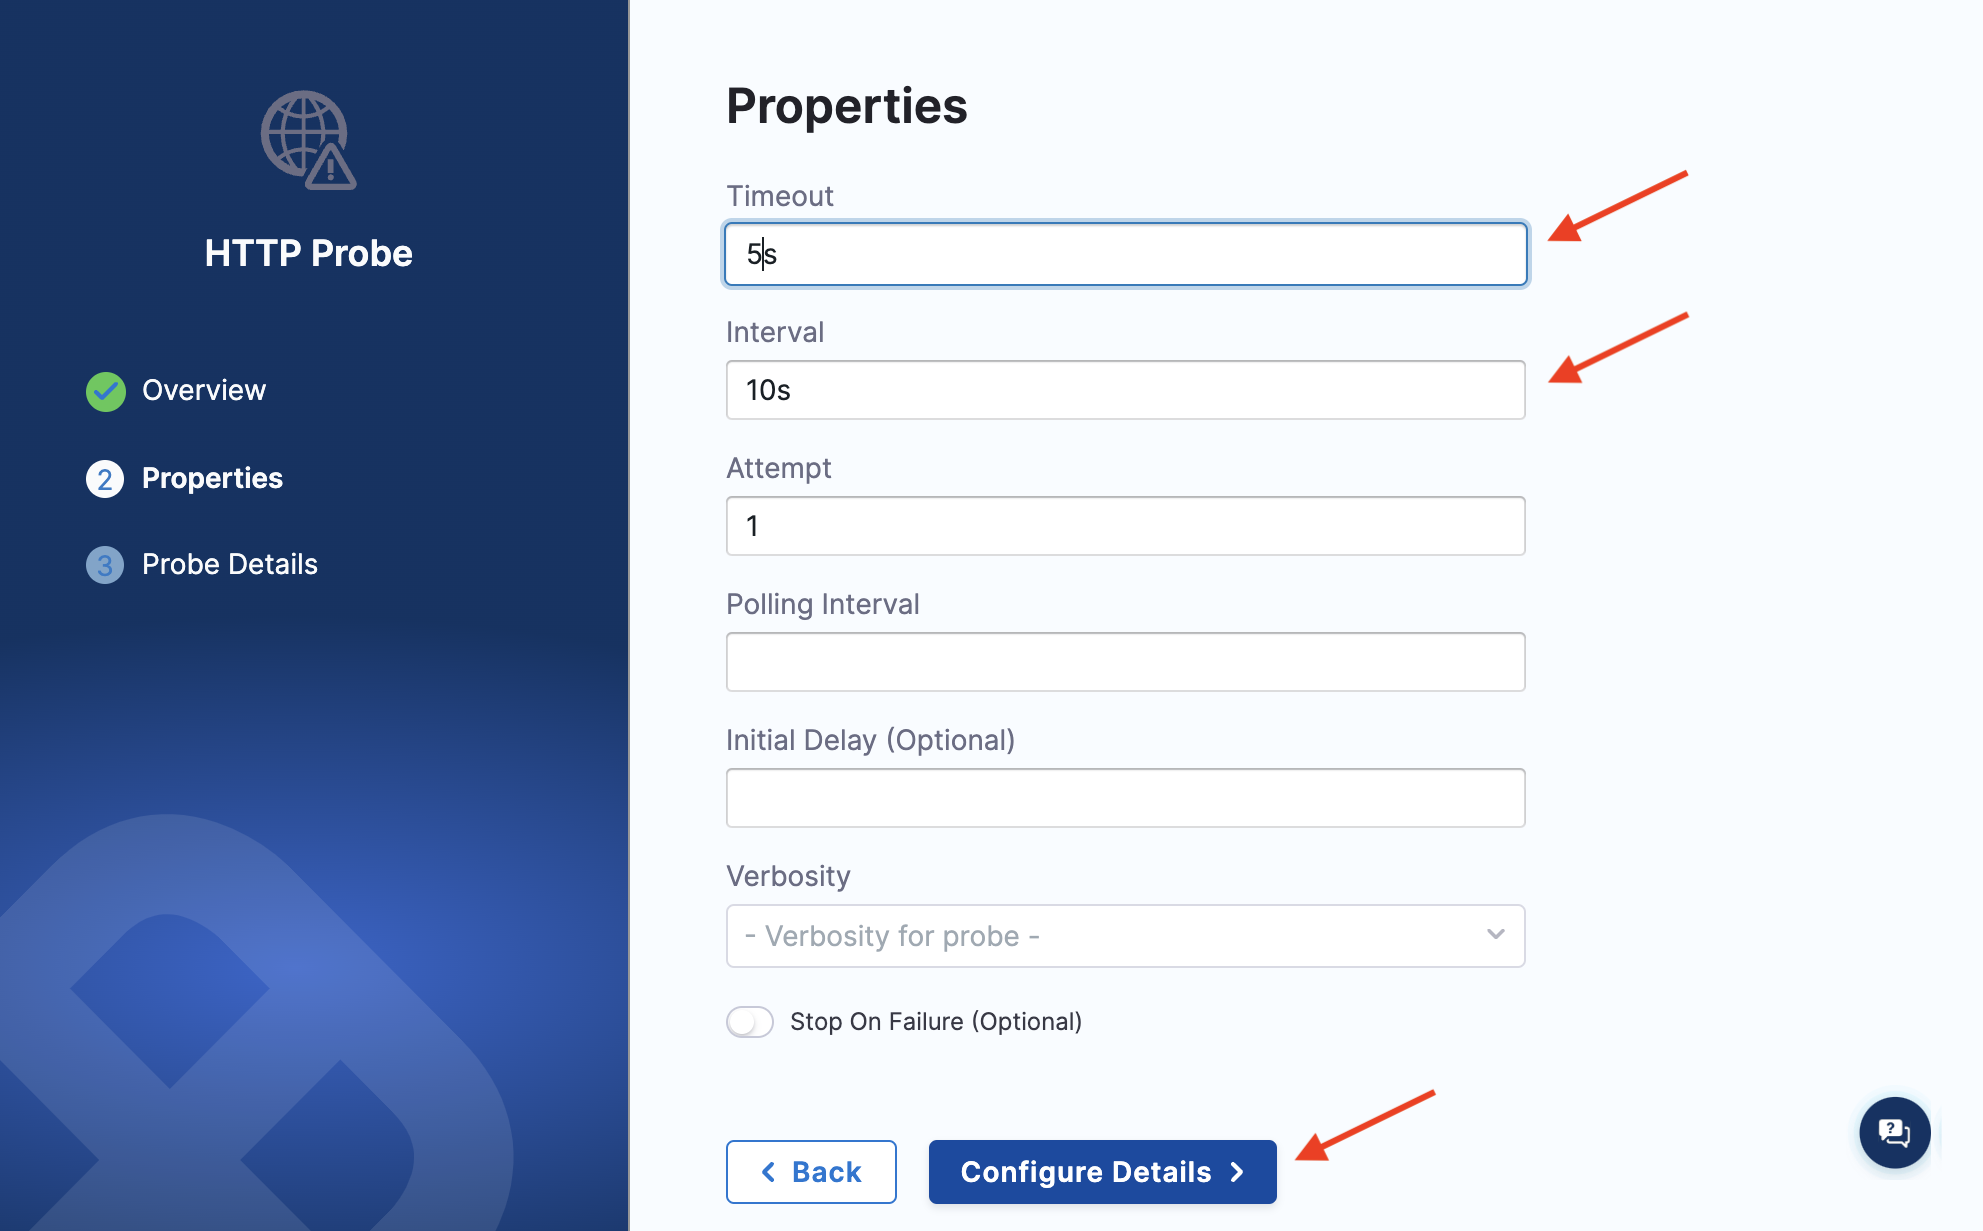
- Specify the timeout as 5s, attempt as 2, and interval as 10s. Click Configure Details.
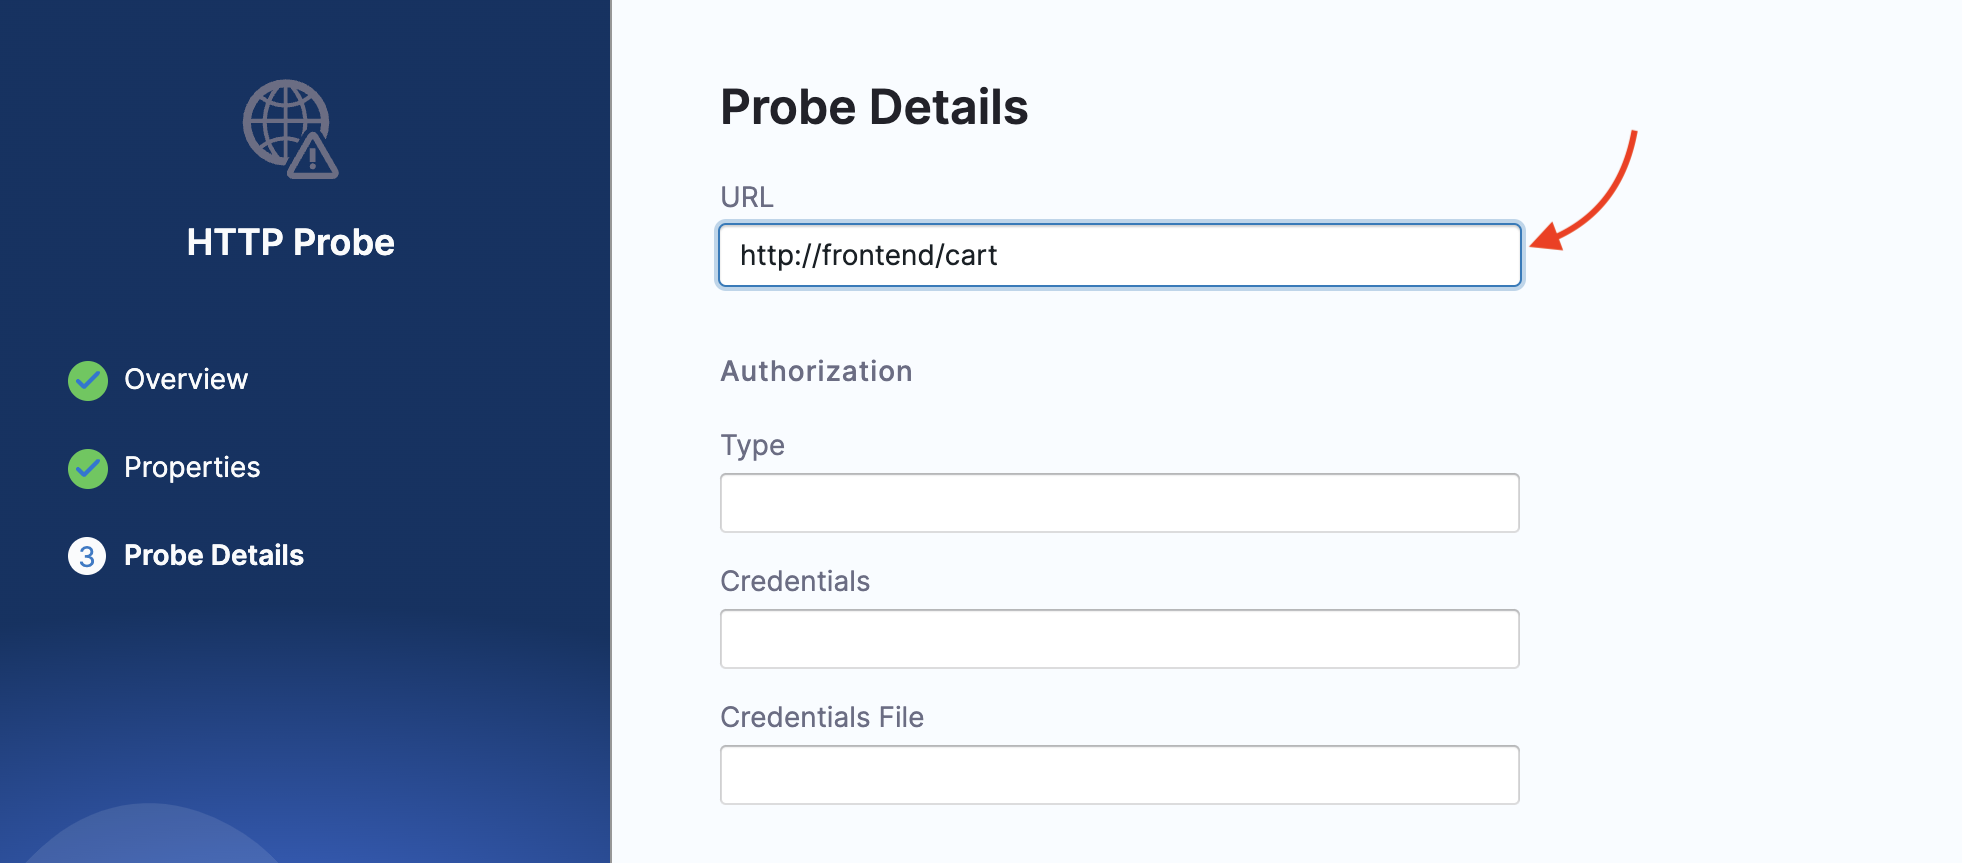
- Enter the URL as
http://frontend/cartwhich is the URL for the cart page.
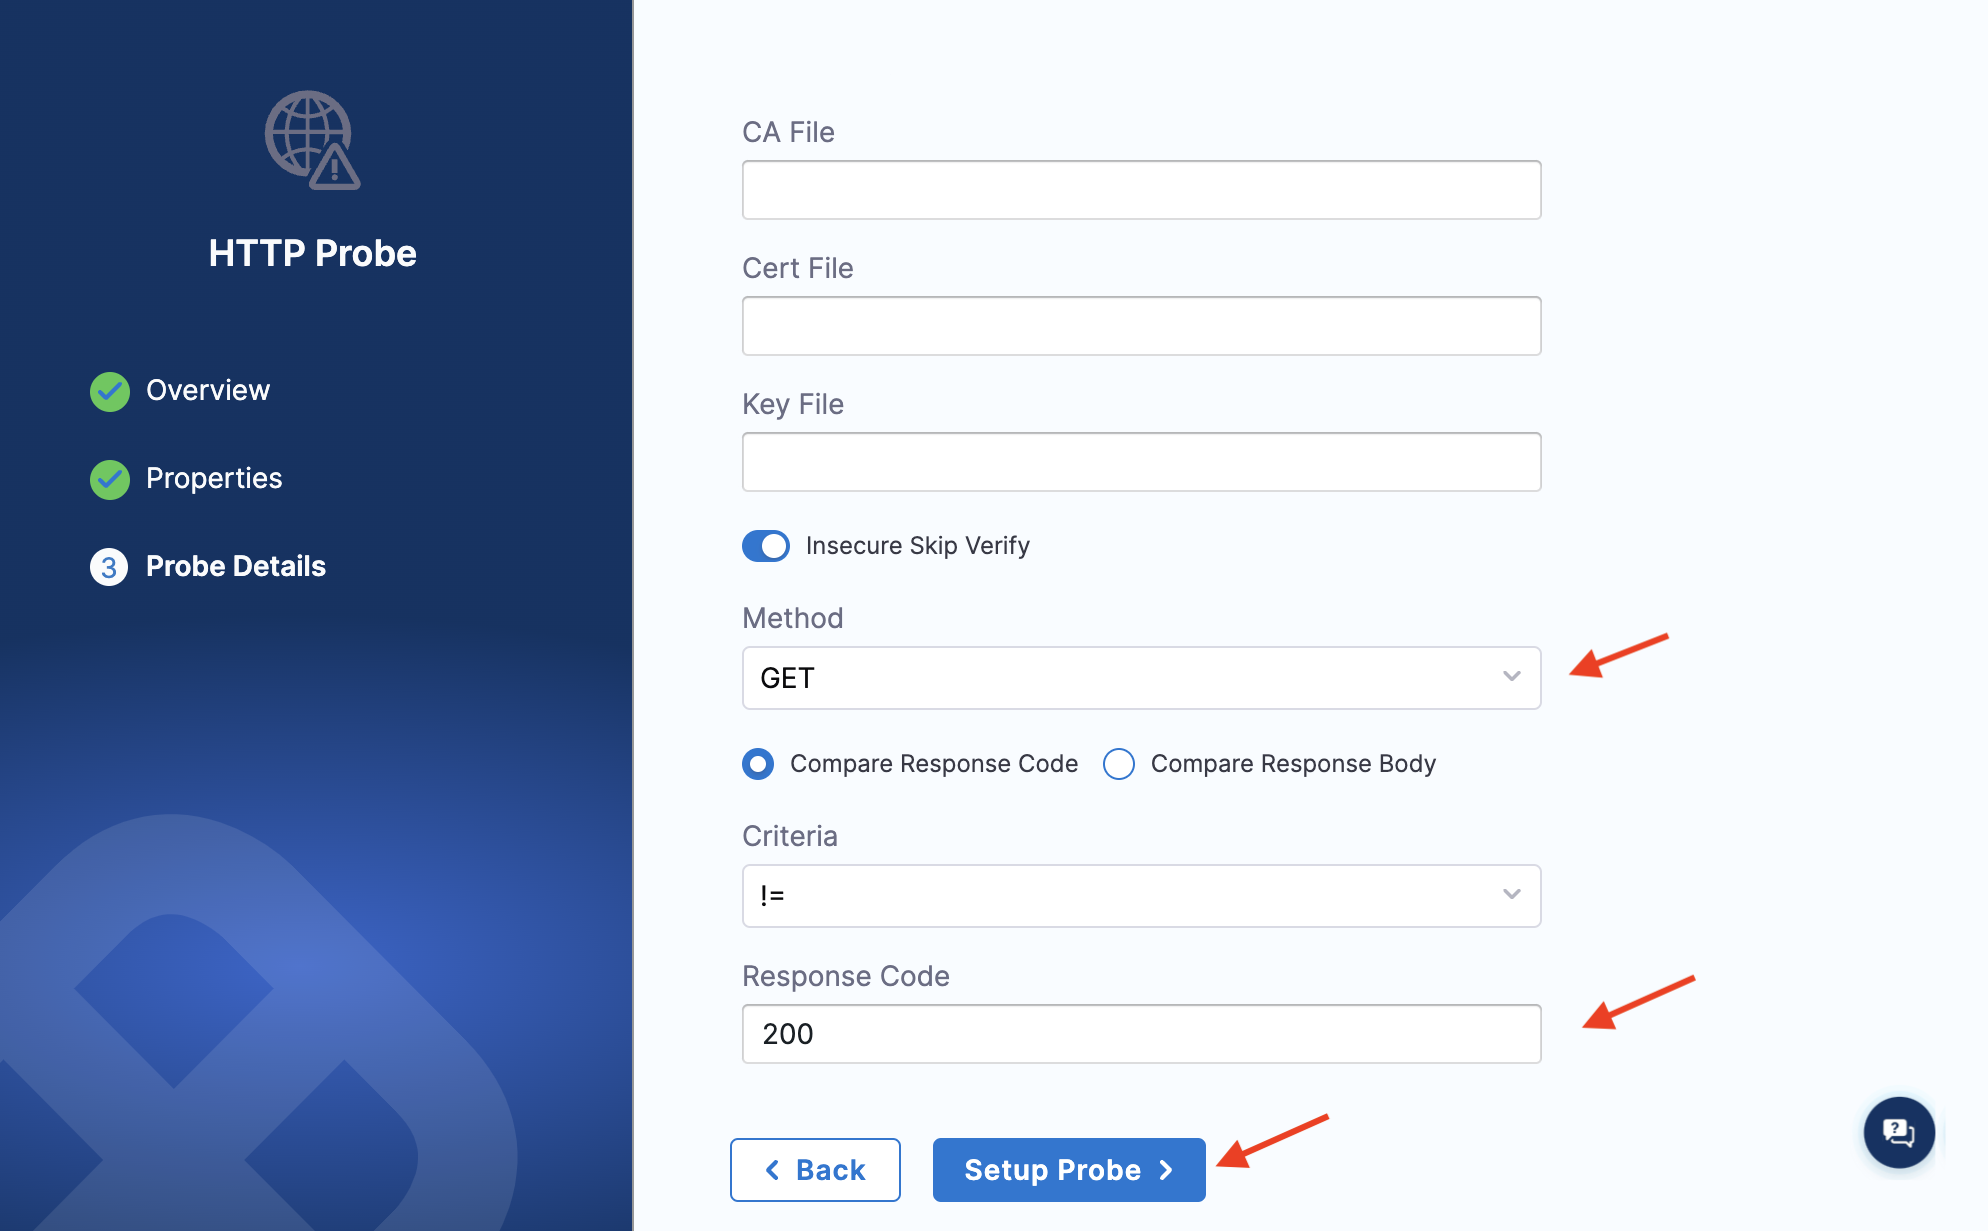
- Specify the method as
GETso that the probe can make GET requests at the URL specified earlier. Select Compare response code, criteria as ==, and response code as200for the successful validation of the probe. Click Setup Probe.
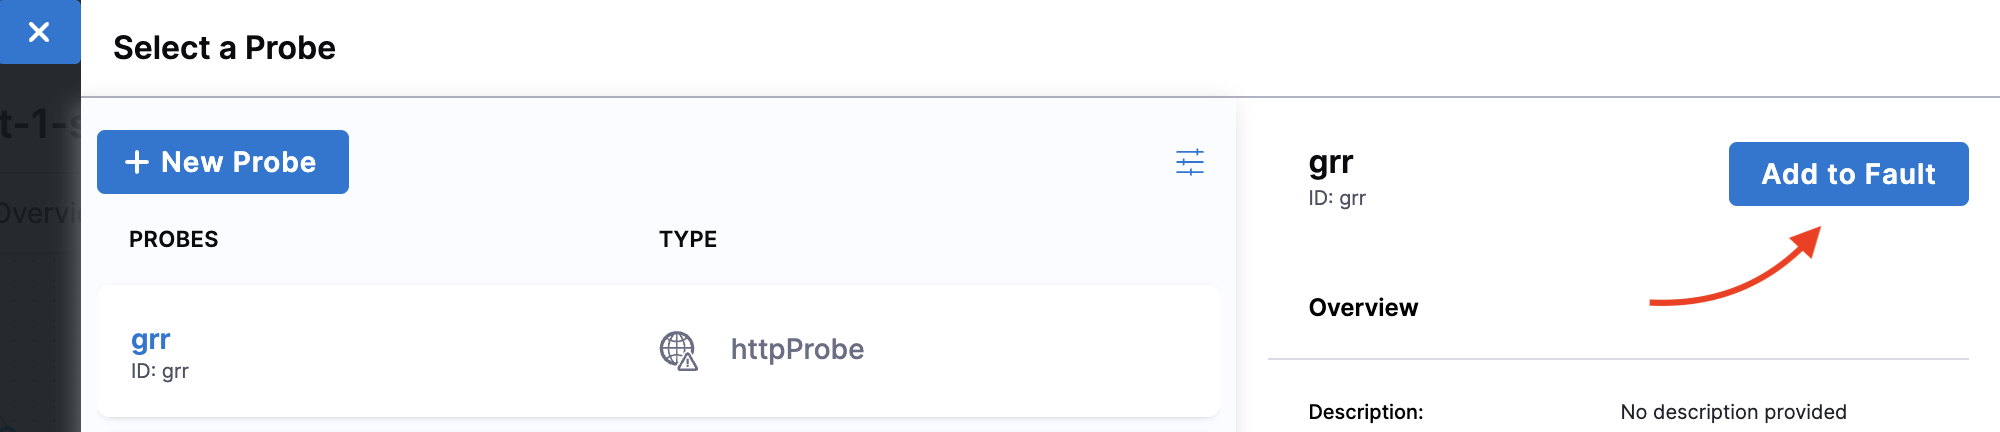
- Once you create a probe, click it, and select Add to Fault.
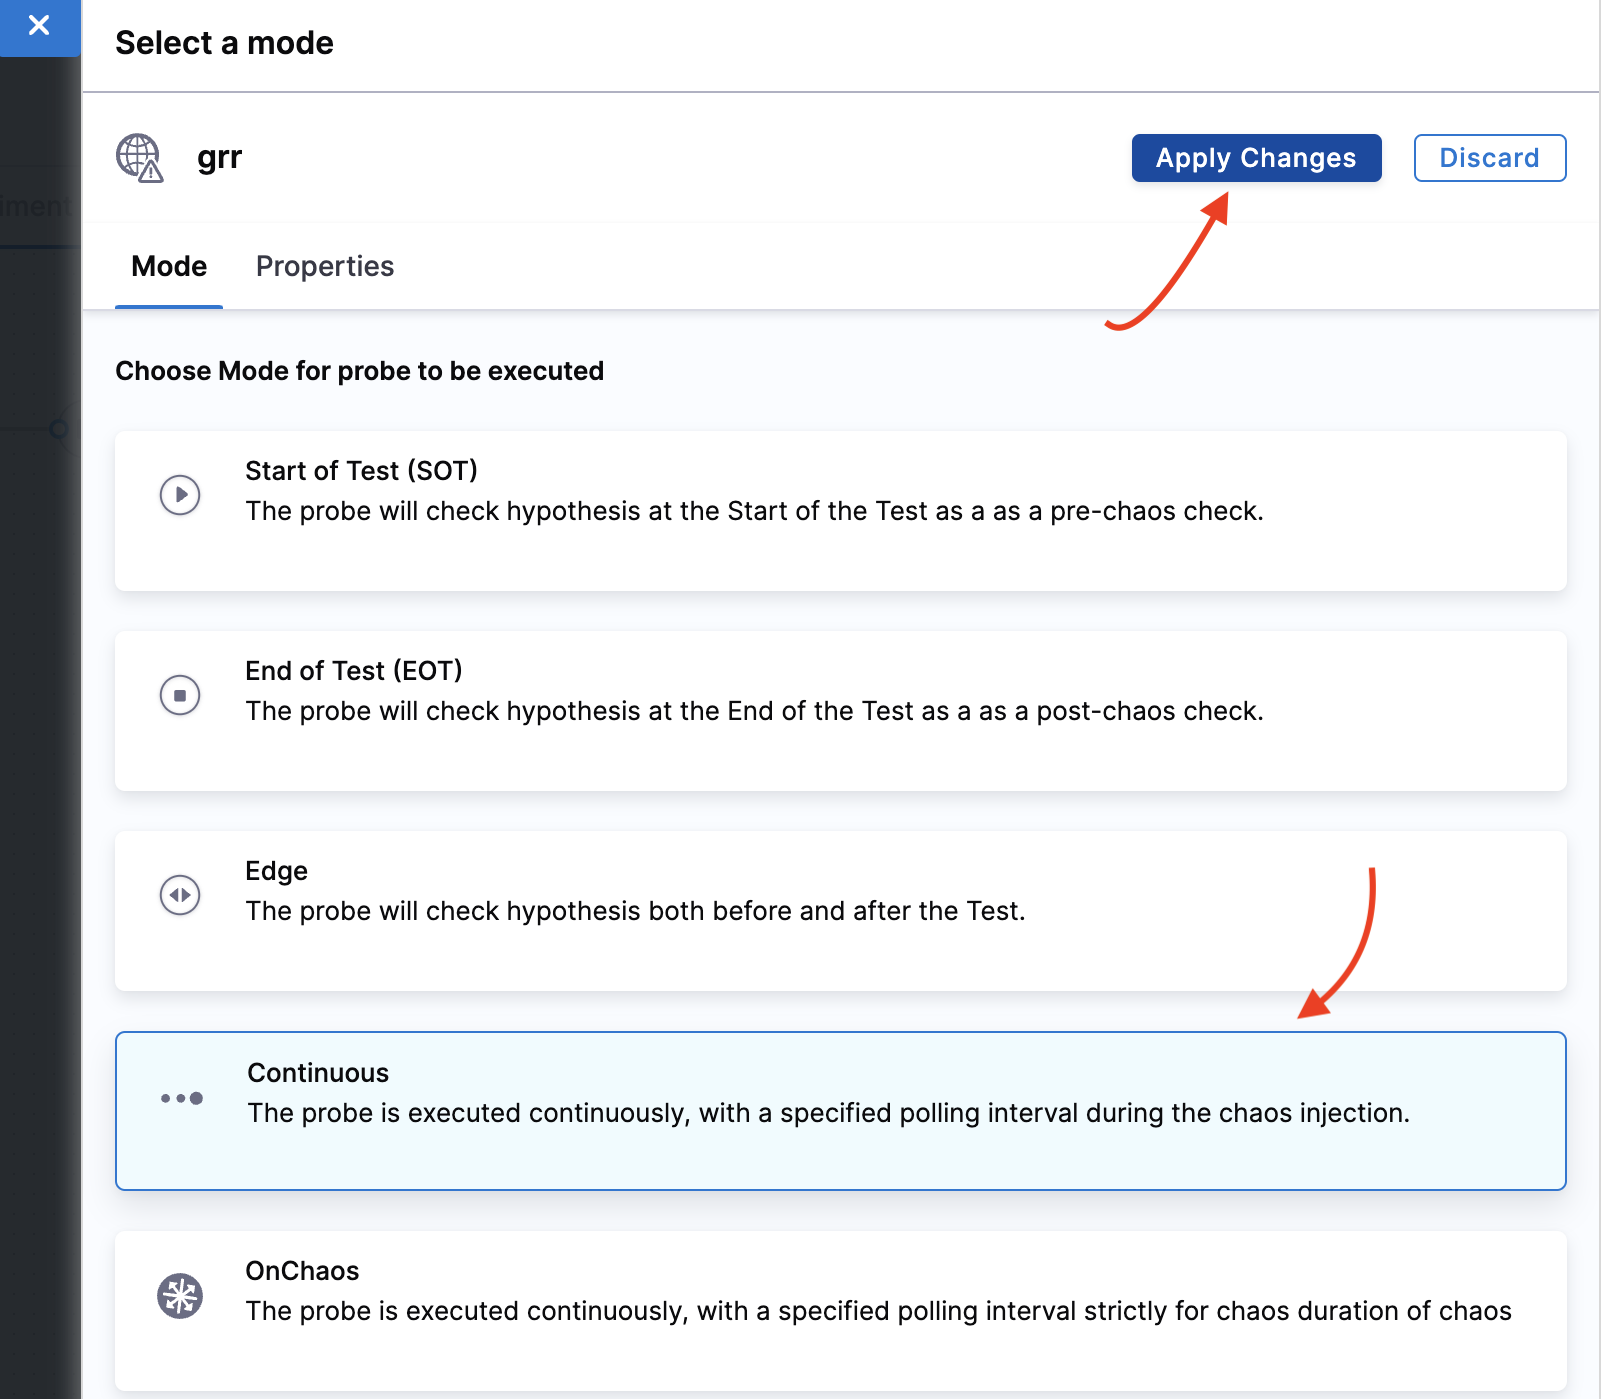
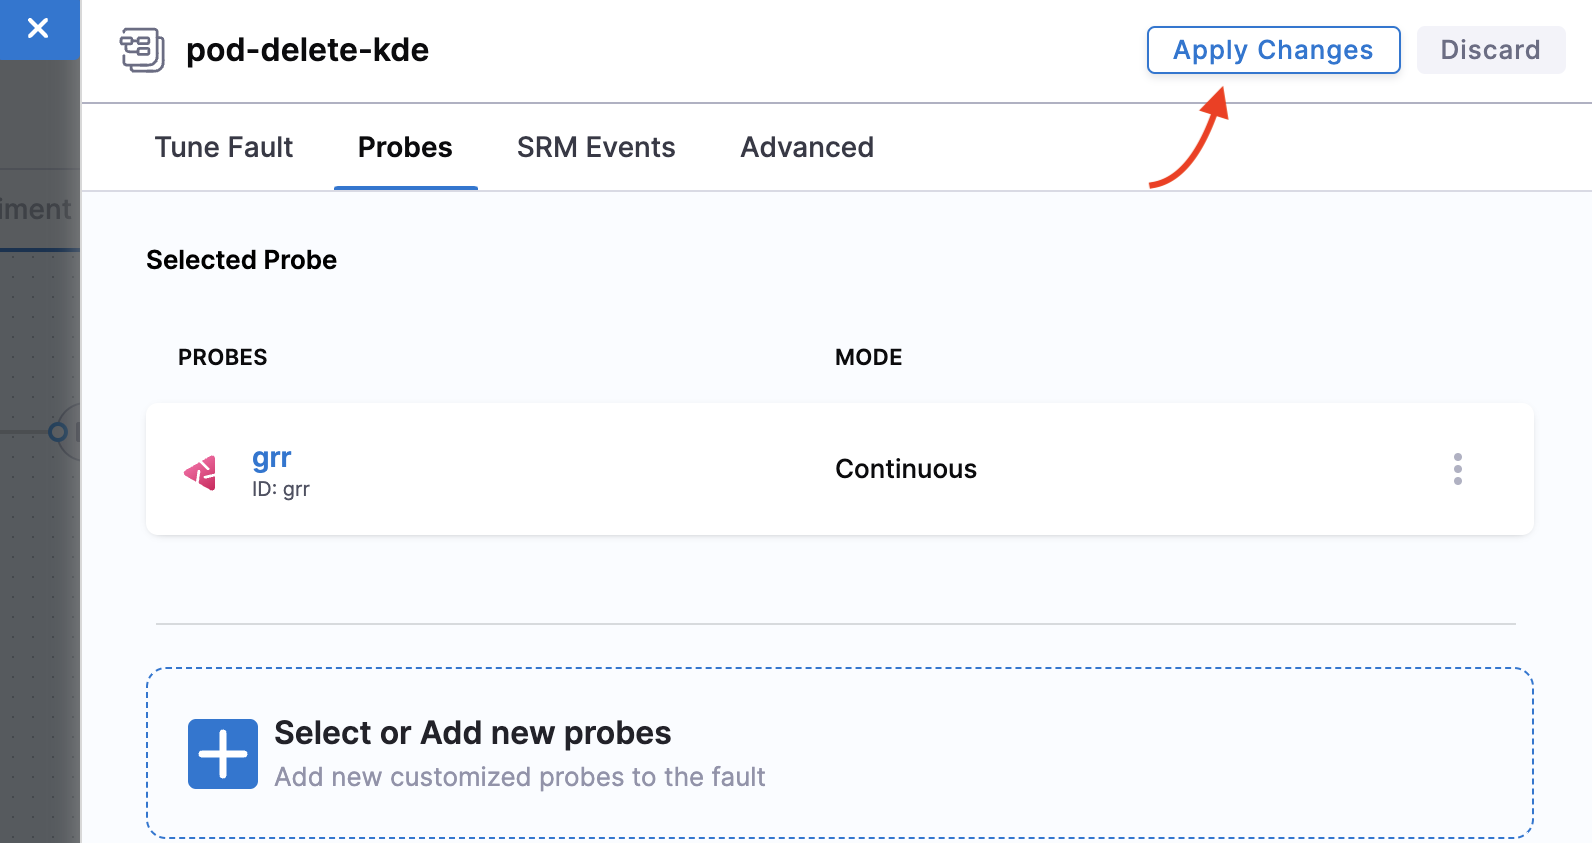
- Select mode as Continuous and click Apply changes.
- Click Apply changes again to confirm all parameters configuration. Click X to close the overlay modal. Click Apply changes again.
Step 4: Verify cart page health
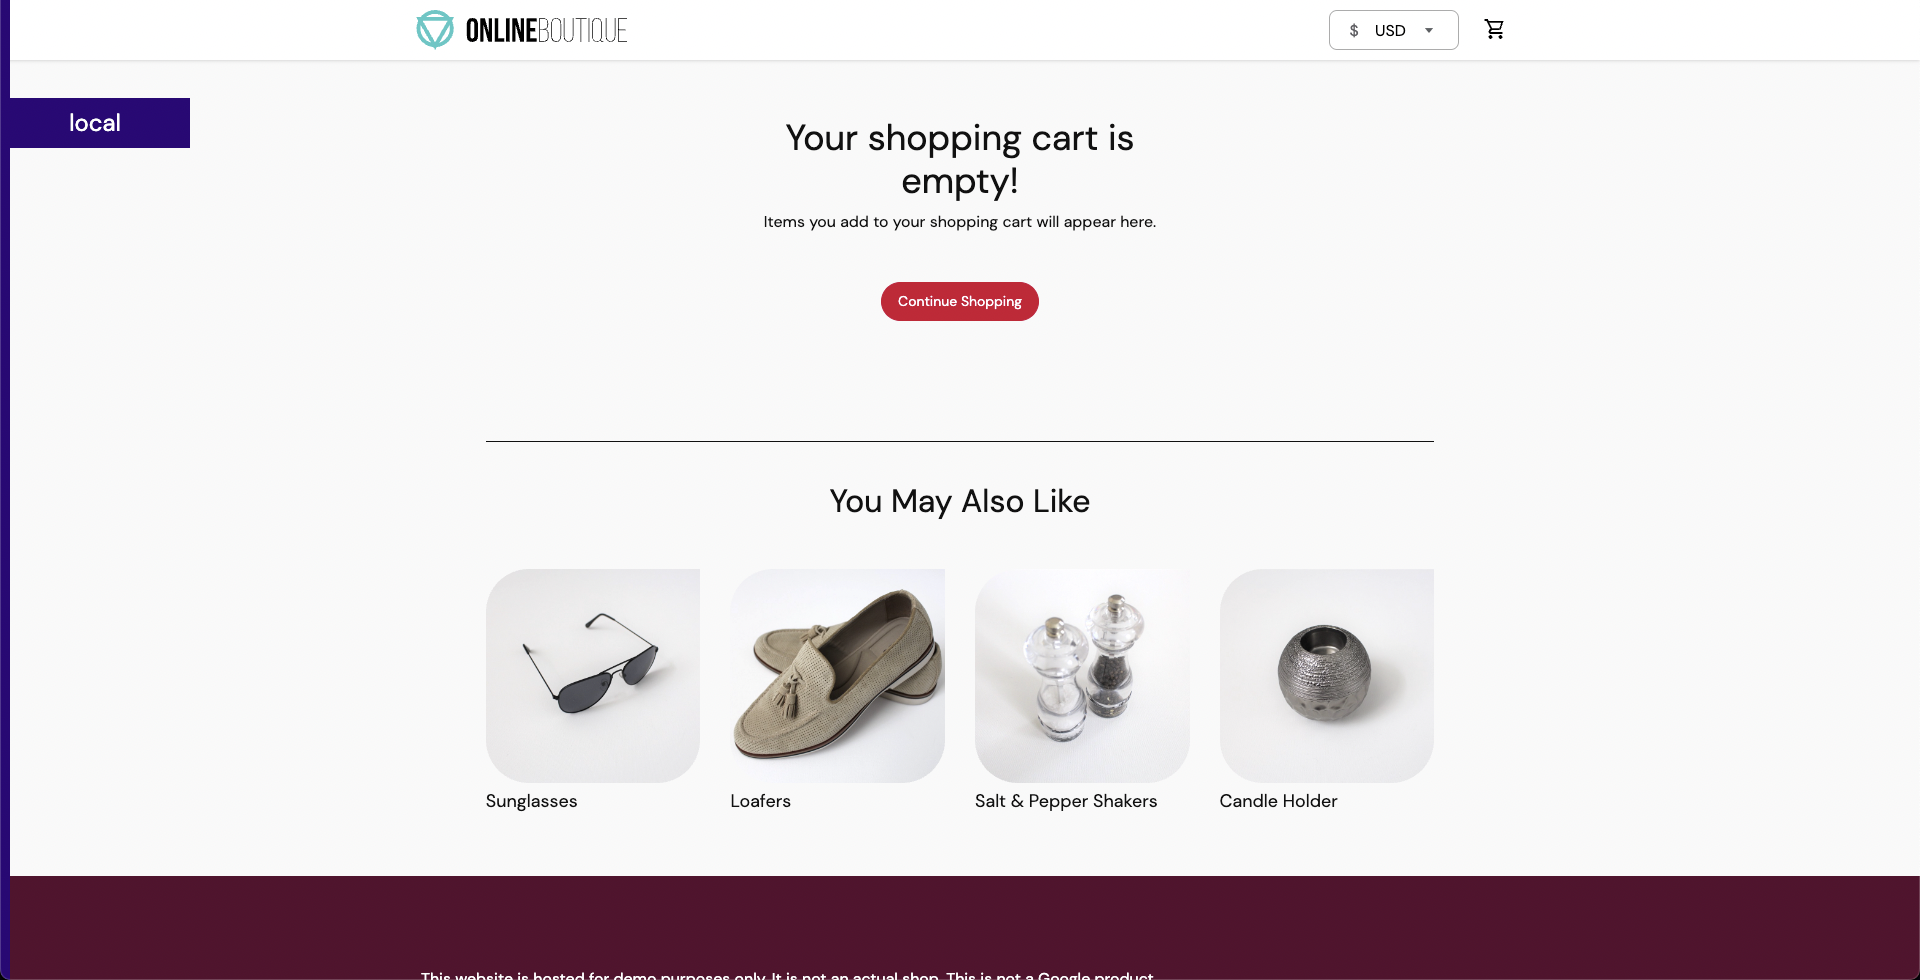
- Before executing the experiment, verify that the cart page is healthy and accessible from the front end, as seen at the
/cartroute.
Step 5: Observe chaos execution
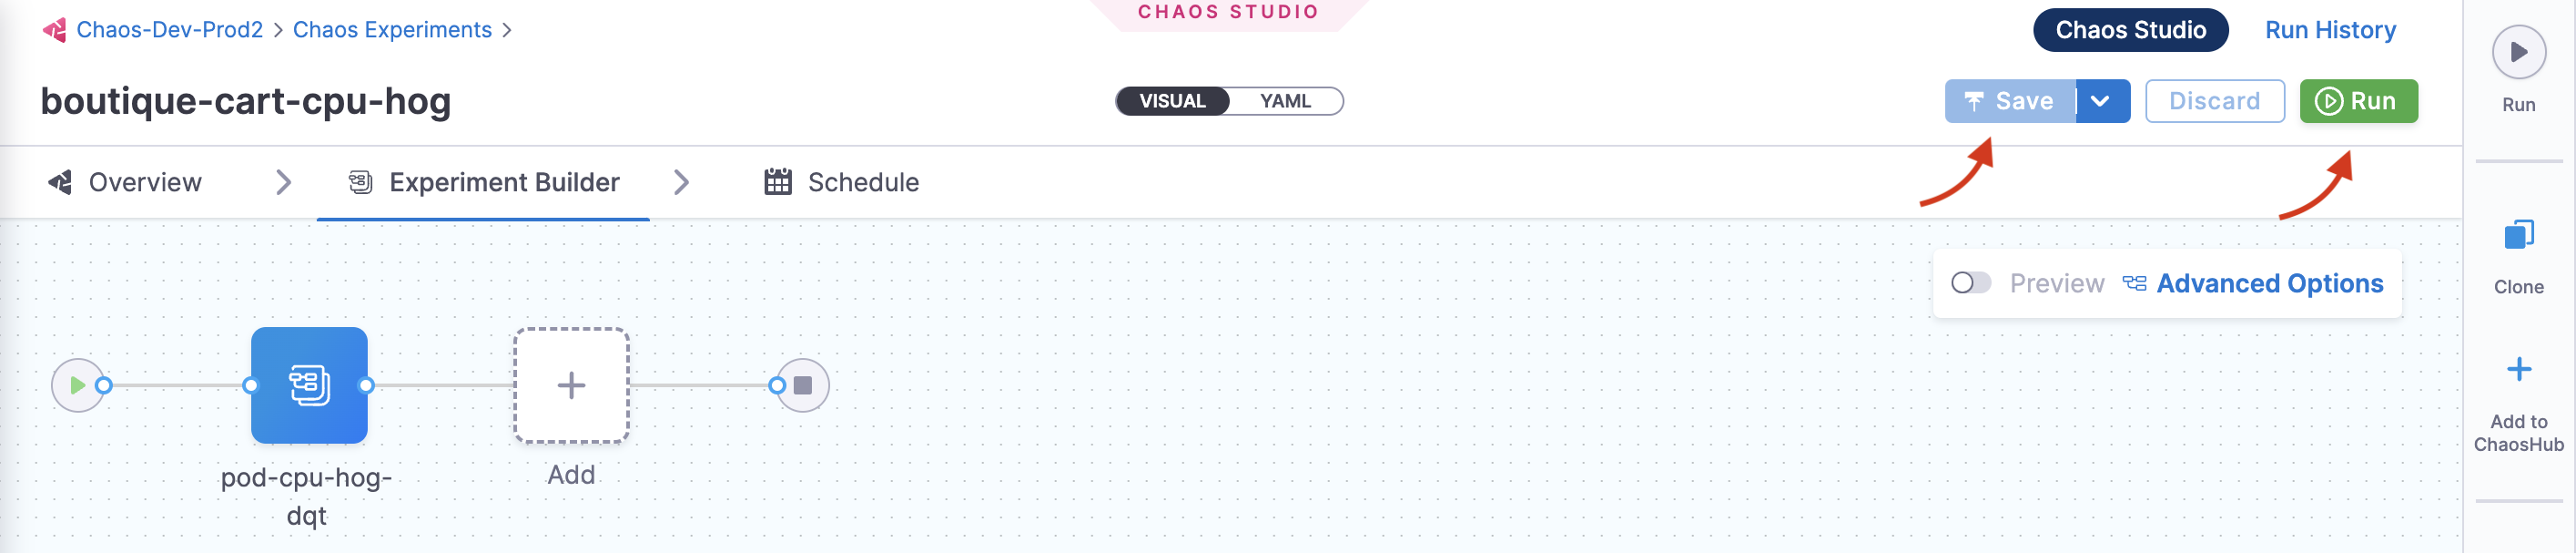
- When all the prerequisites are fulfilled and parameters are set, you can start the experiment execution by selecting Run.
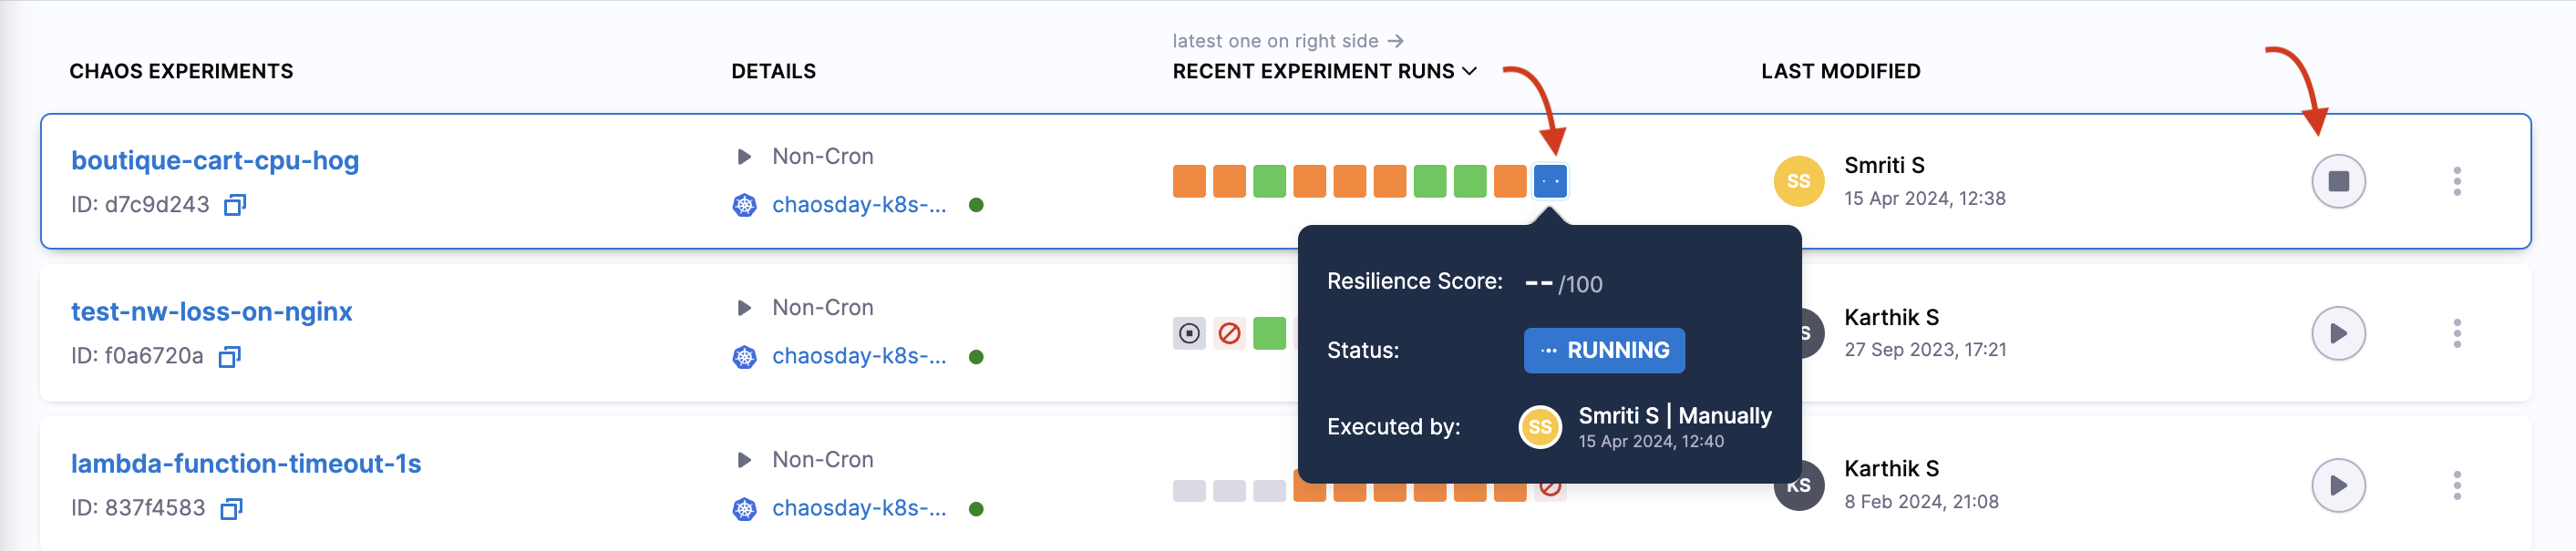
You can see that once you click Run, an experiment run is scheduled. You can see the status of every step in the tab.
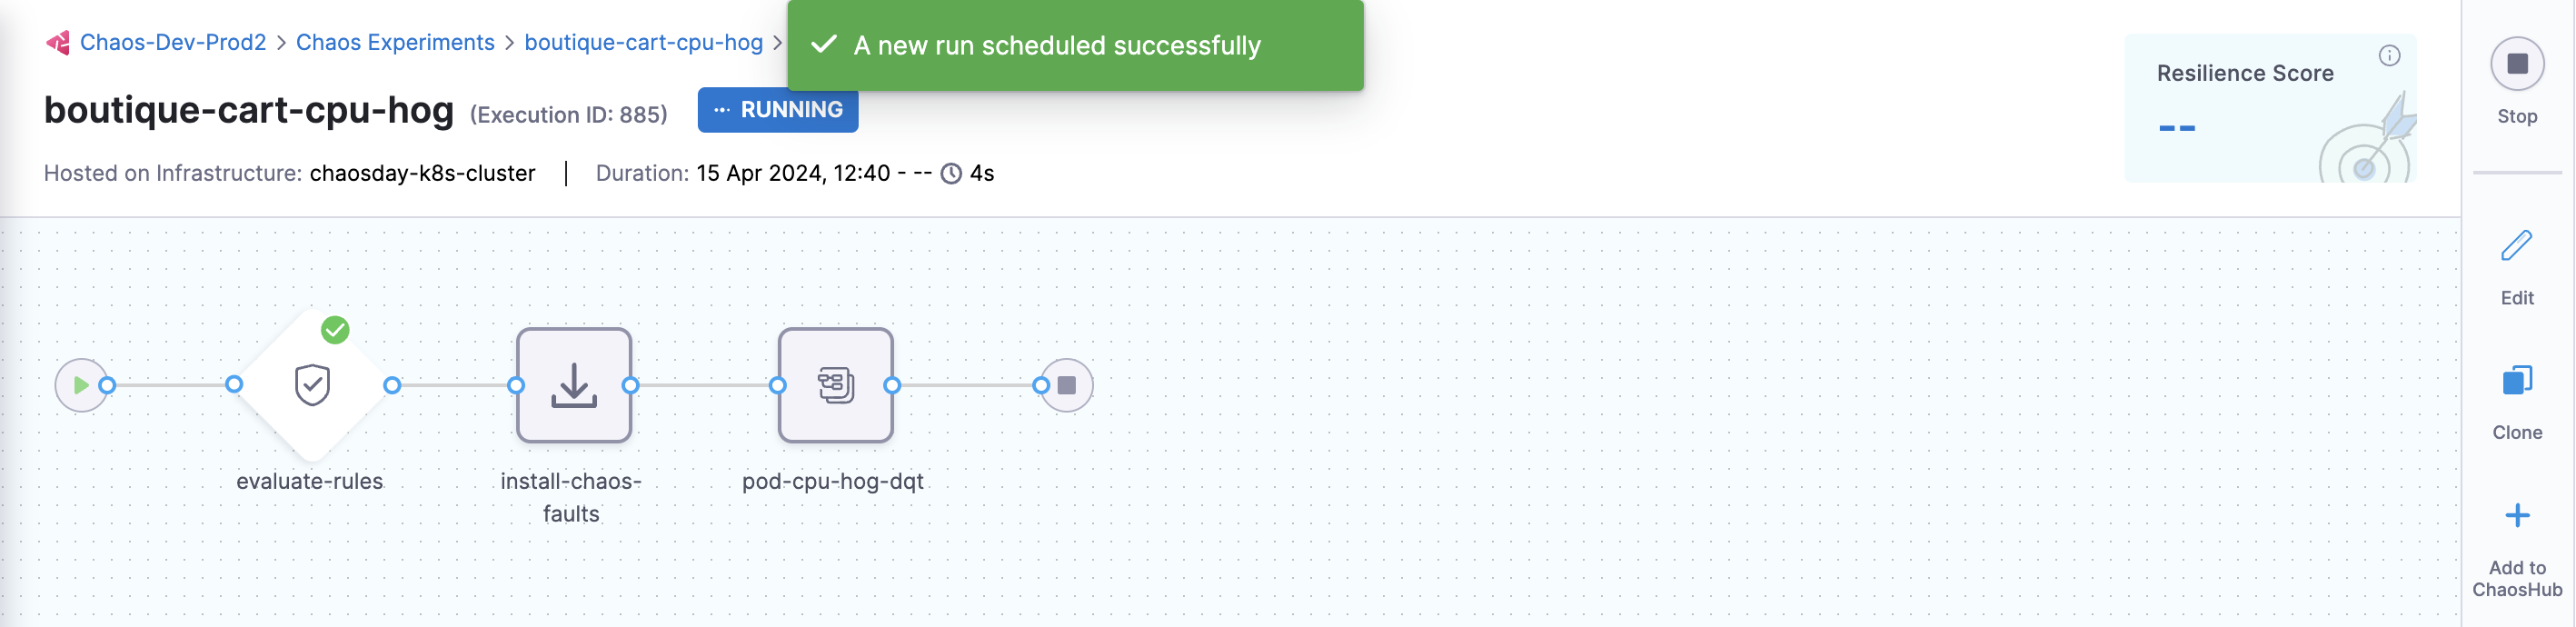
- Select Recent experiment runs to view the runs of an experiment. The latest experiment is displayed in the last bar with the status as
RUNNING.
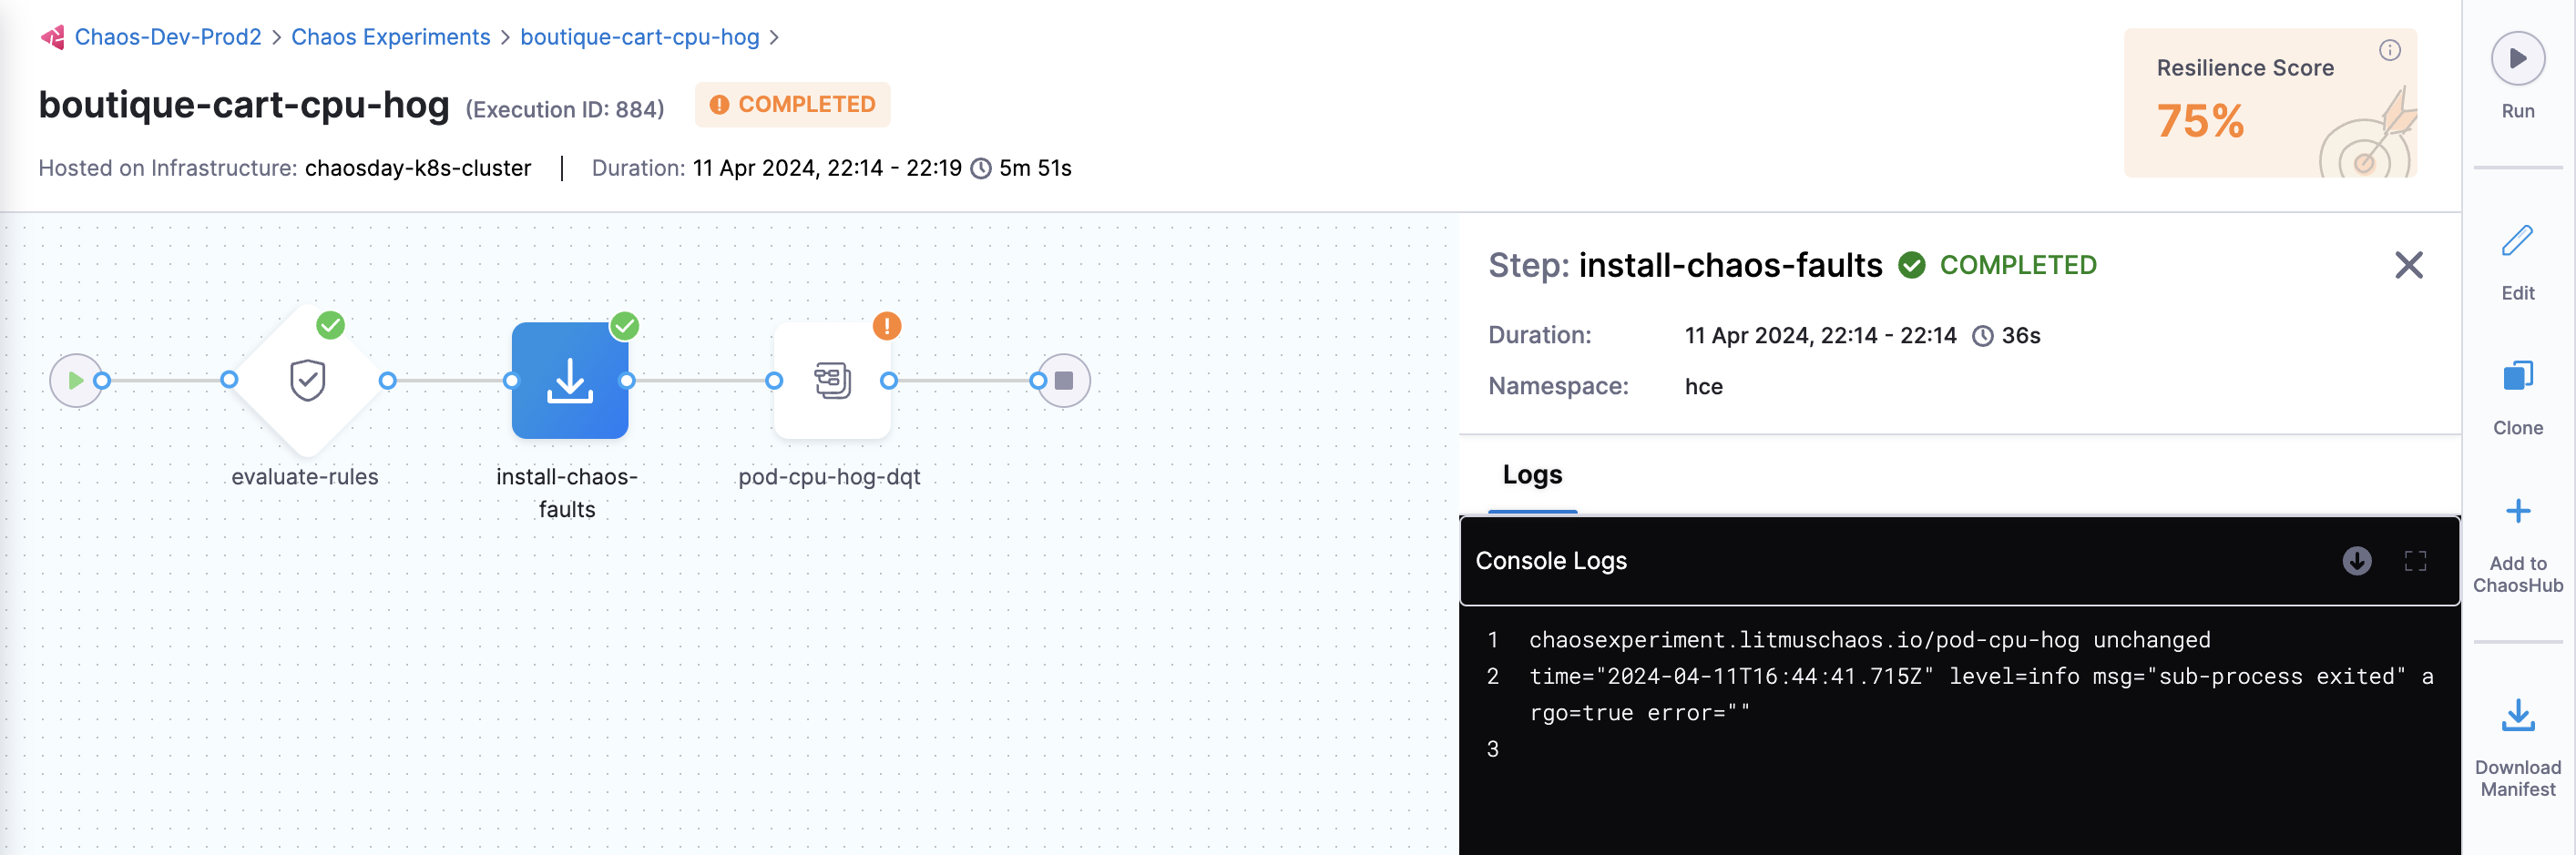
- You can view the detailed execution (that is, logs) of the experiment by navigating to the experiment run and then the Logs tab.
- You can check the status of the cart deployment pod by executing the following command on the terminal.
❯ k get pods -n hce

NAME                                           READY   STATUS    RESTARTS       AGE
adservice-68db567bb5-hd47j                     1/1     Running   0              5h41m
cartservice-6b8f46f64f-lkgs8                   0/1     Running   0              29s
chaos-exporter-765d6b6674-tkrpm                1/1     Running   0              5h41m
chaos-operator-ce-678b67c75-l68m5              1/1     Running   0              5h41m
checkoutservice-7545ff6849-rdl9f               1/1     Running   0              5h41m
currencyservice-5769b647d5-trx69               1/1     Running   0              5h41m
emailservice-55c84dcfdc-c9x9q                  1/1     Running   0              5h41m
frontend-74b7898dd9-x4bzr                      1/1     Running   0              5h41m
grafana-6f6fb469b7-bm9vh                       1/1     Running   0              5h41m
loadgenerator-5b875b84dd-pcjdr                 1/1     Running   0              5h41m
paymentservice-59d87f77bc-fkwjq                1/1     Running   0              5h41m
productcatalogservice-676d7d7dbc-nx75x         1/1     Running   0              5h41m
prometheus-blackbox-exporter-6d955c876-l7fdv   2/2     Running   0              5h41m
prometheus-deployment-779b88bf5d-zf8f9         1/1     Running   0              5h41m
recommendationservice-6fc8b4d9cf-4s96t         1/1     Running   0              5h41m
redis-cart-7cd9d8966d-mgbhx                    1/1     Running   0              5h41m
shippingservice-7b4945b5fc-cbmc9               1/1     Running   0              5h41m
subscriber-7774bd95d4-4rnwp                    1/1     Running   0              5h41m
workflow-controller-6d5d75dc7c-v9vqc           1/1     Running   0              5h41m
The output on the terminal indicates that the cart pod was terminated and a new pod replaced it (whose container is yet to be created).
- As a consequence, if you try to access the frontend cart page, you will see a
500error.
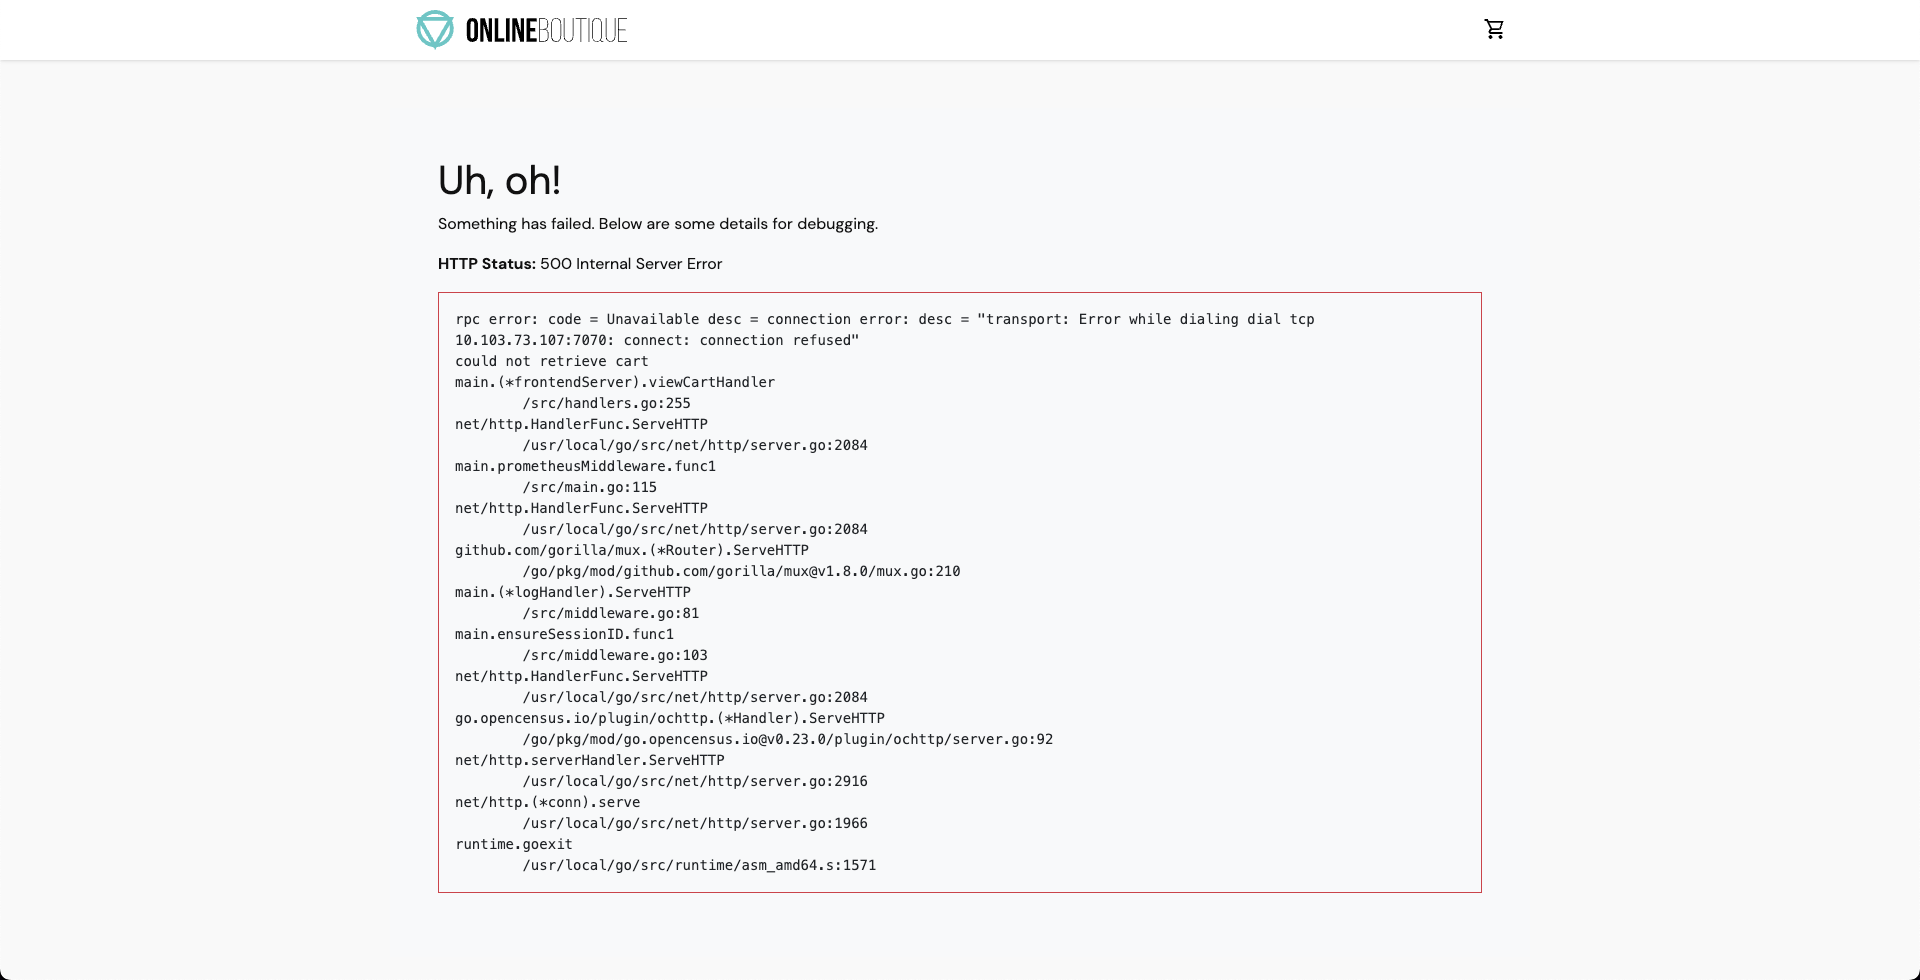
- You can validate the behavior of the application and evaluate the experiment run.
Conclusion
With that, you have successfully created and executed a chaos experiment from scratch! Your next step can be to execute a chaos experiment using API.