Run your first chaos experiment
In this tutorial, you will apply chaos on a sample boutique application on Kubernetes.
Before you begin
Step 1: Create a project
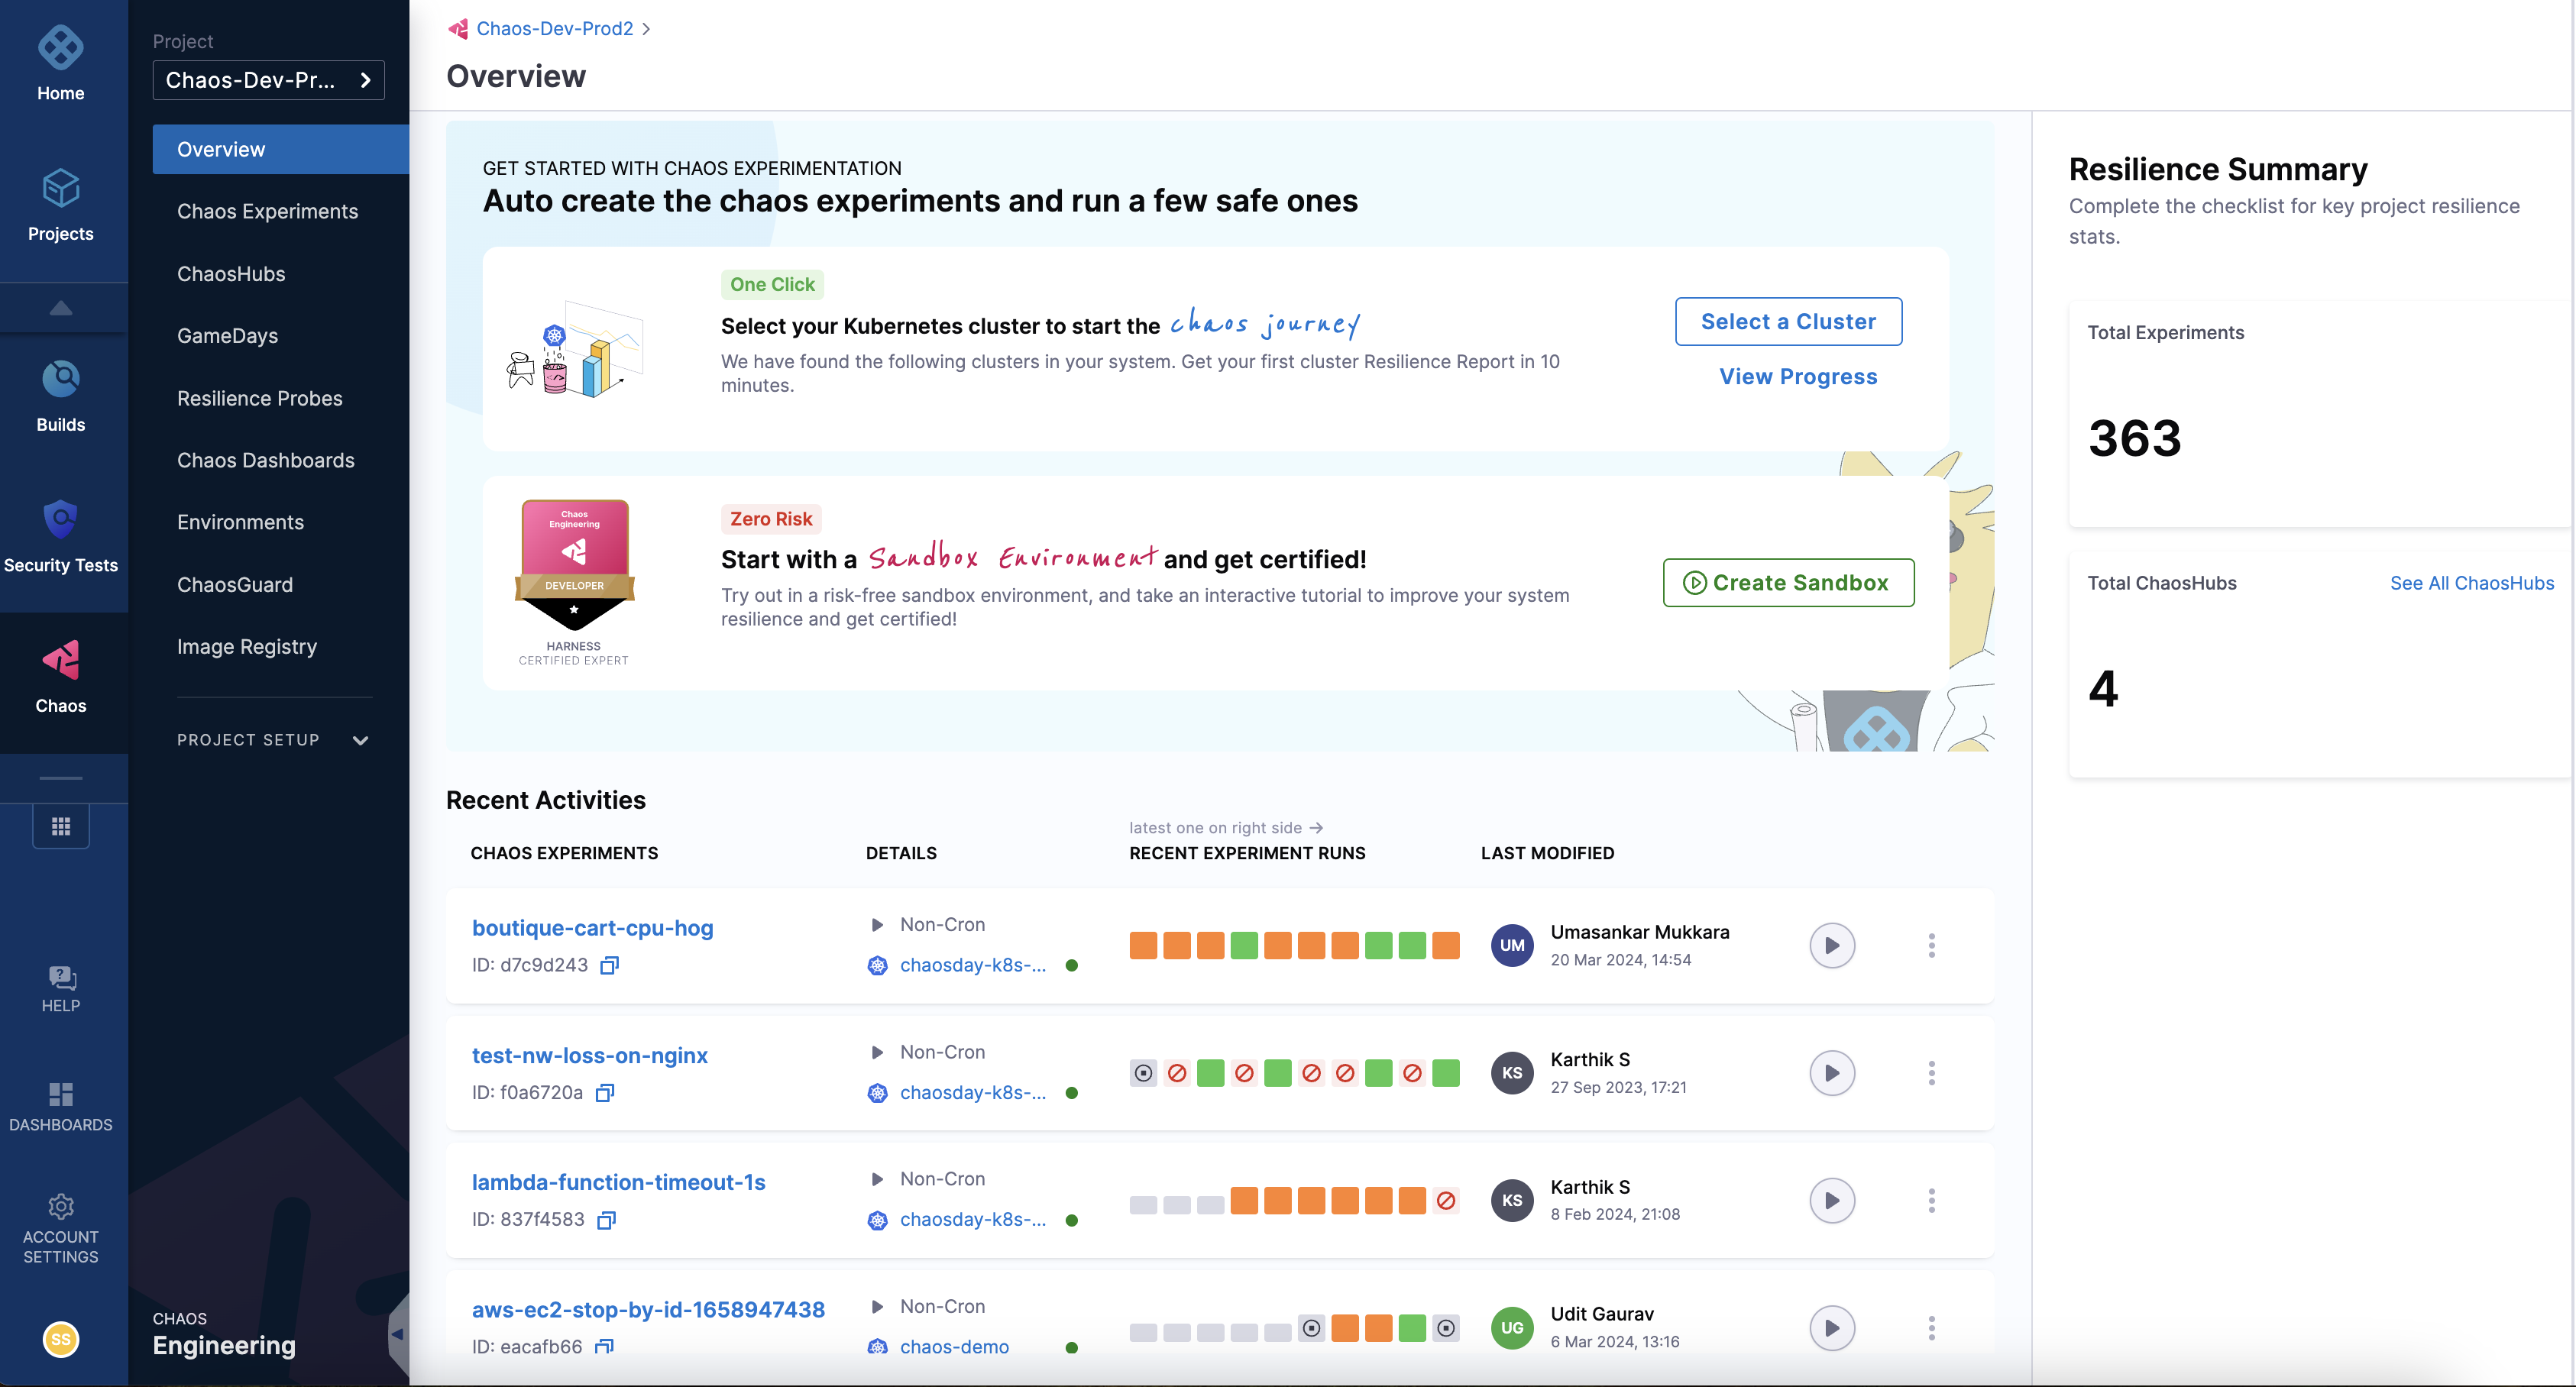
- Create a new project or ask your administrator to add you to an existing project. Once you sign up or log in to your account, you can access the Chaos tab on the extreme left, which displays the recent experiments that were executed.
Step 2: Add a chaos environment
- A chaos experiment is executed in a chaos infrastructure that is associated with an environment. To create a new environment, navigate to the Environments page, and choose a New Environment. Specify the environment name, a description (optional), and tags (optional). Select the environment type, Production or Non-Production. Finally, select Create to add the new environment.
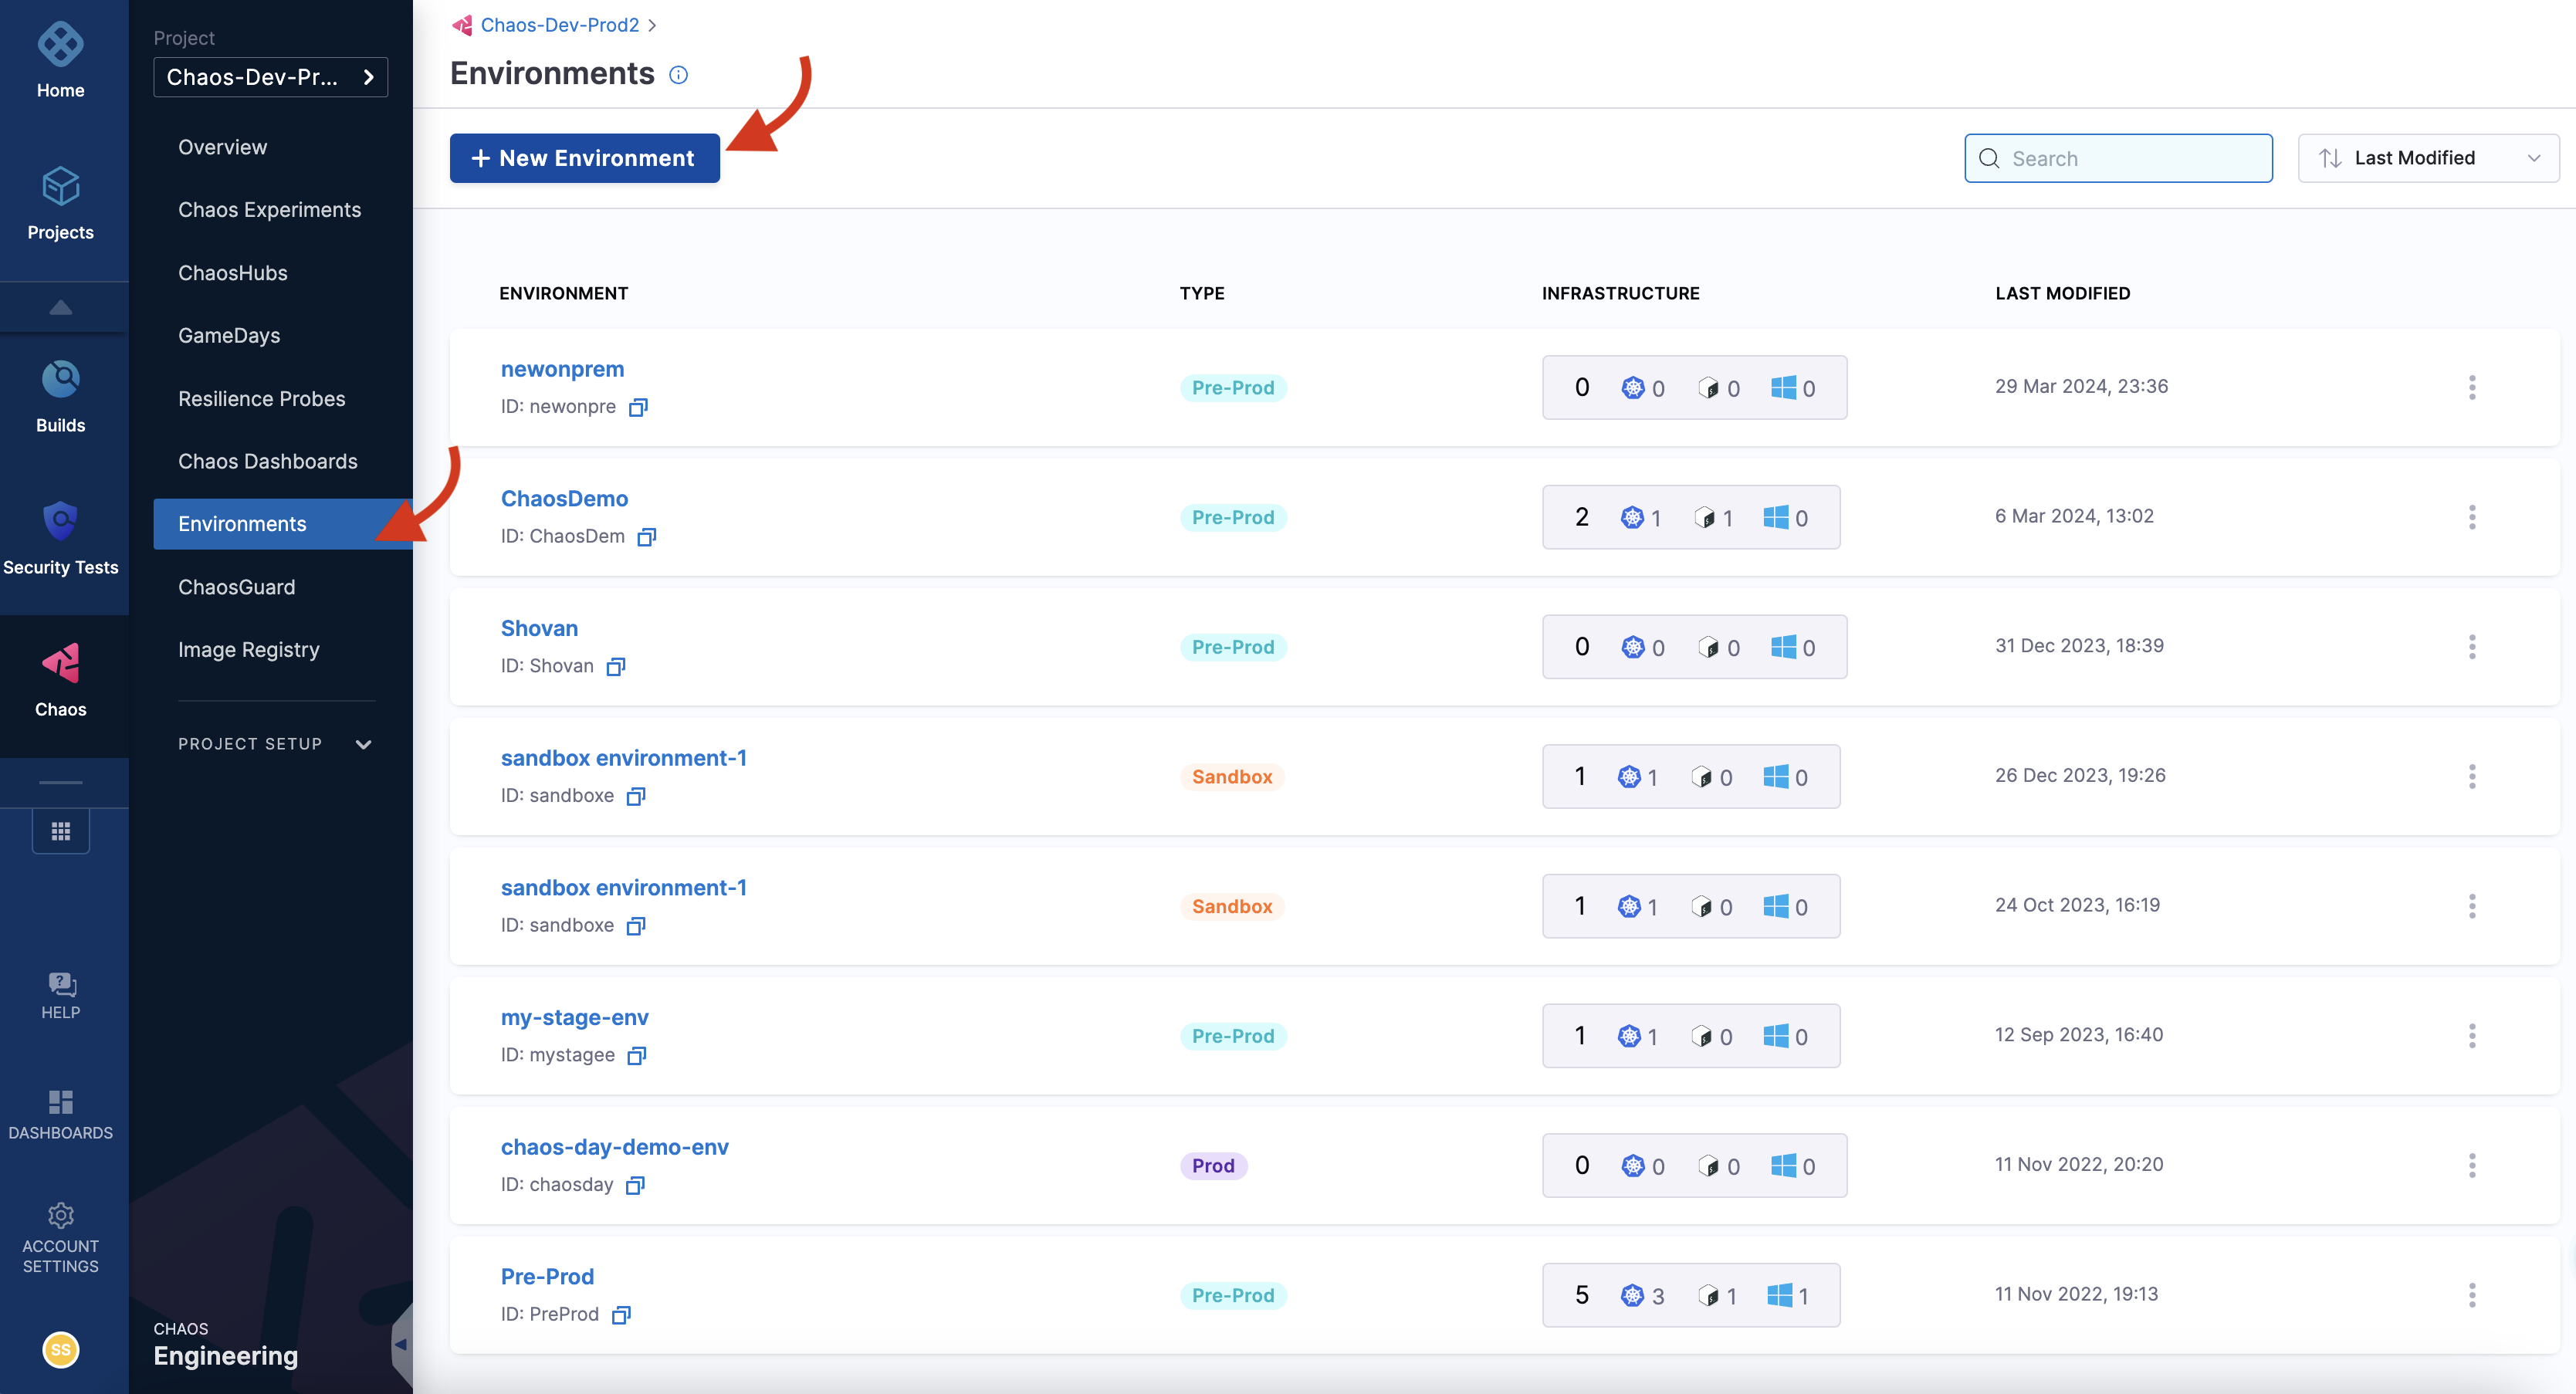
You can also select one of the environments from the list of environments if it is available instead of creating an environment.
Step 3: Add a chaos infrastructure
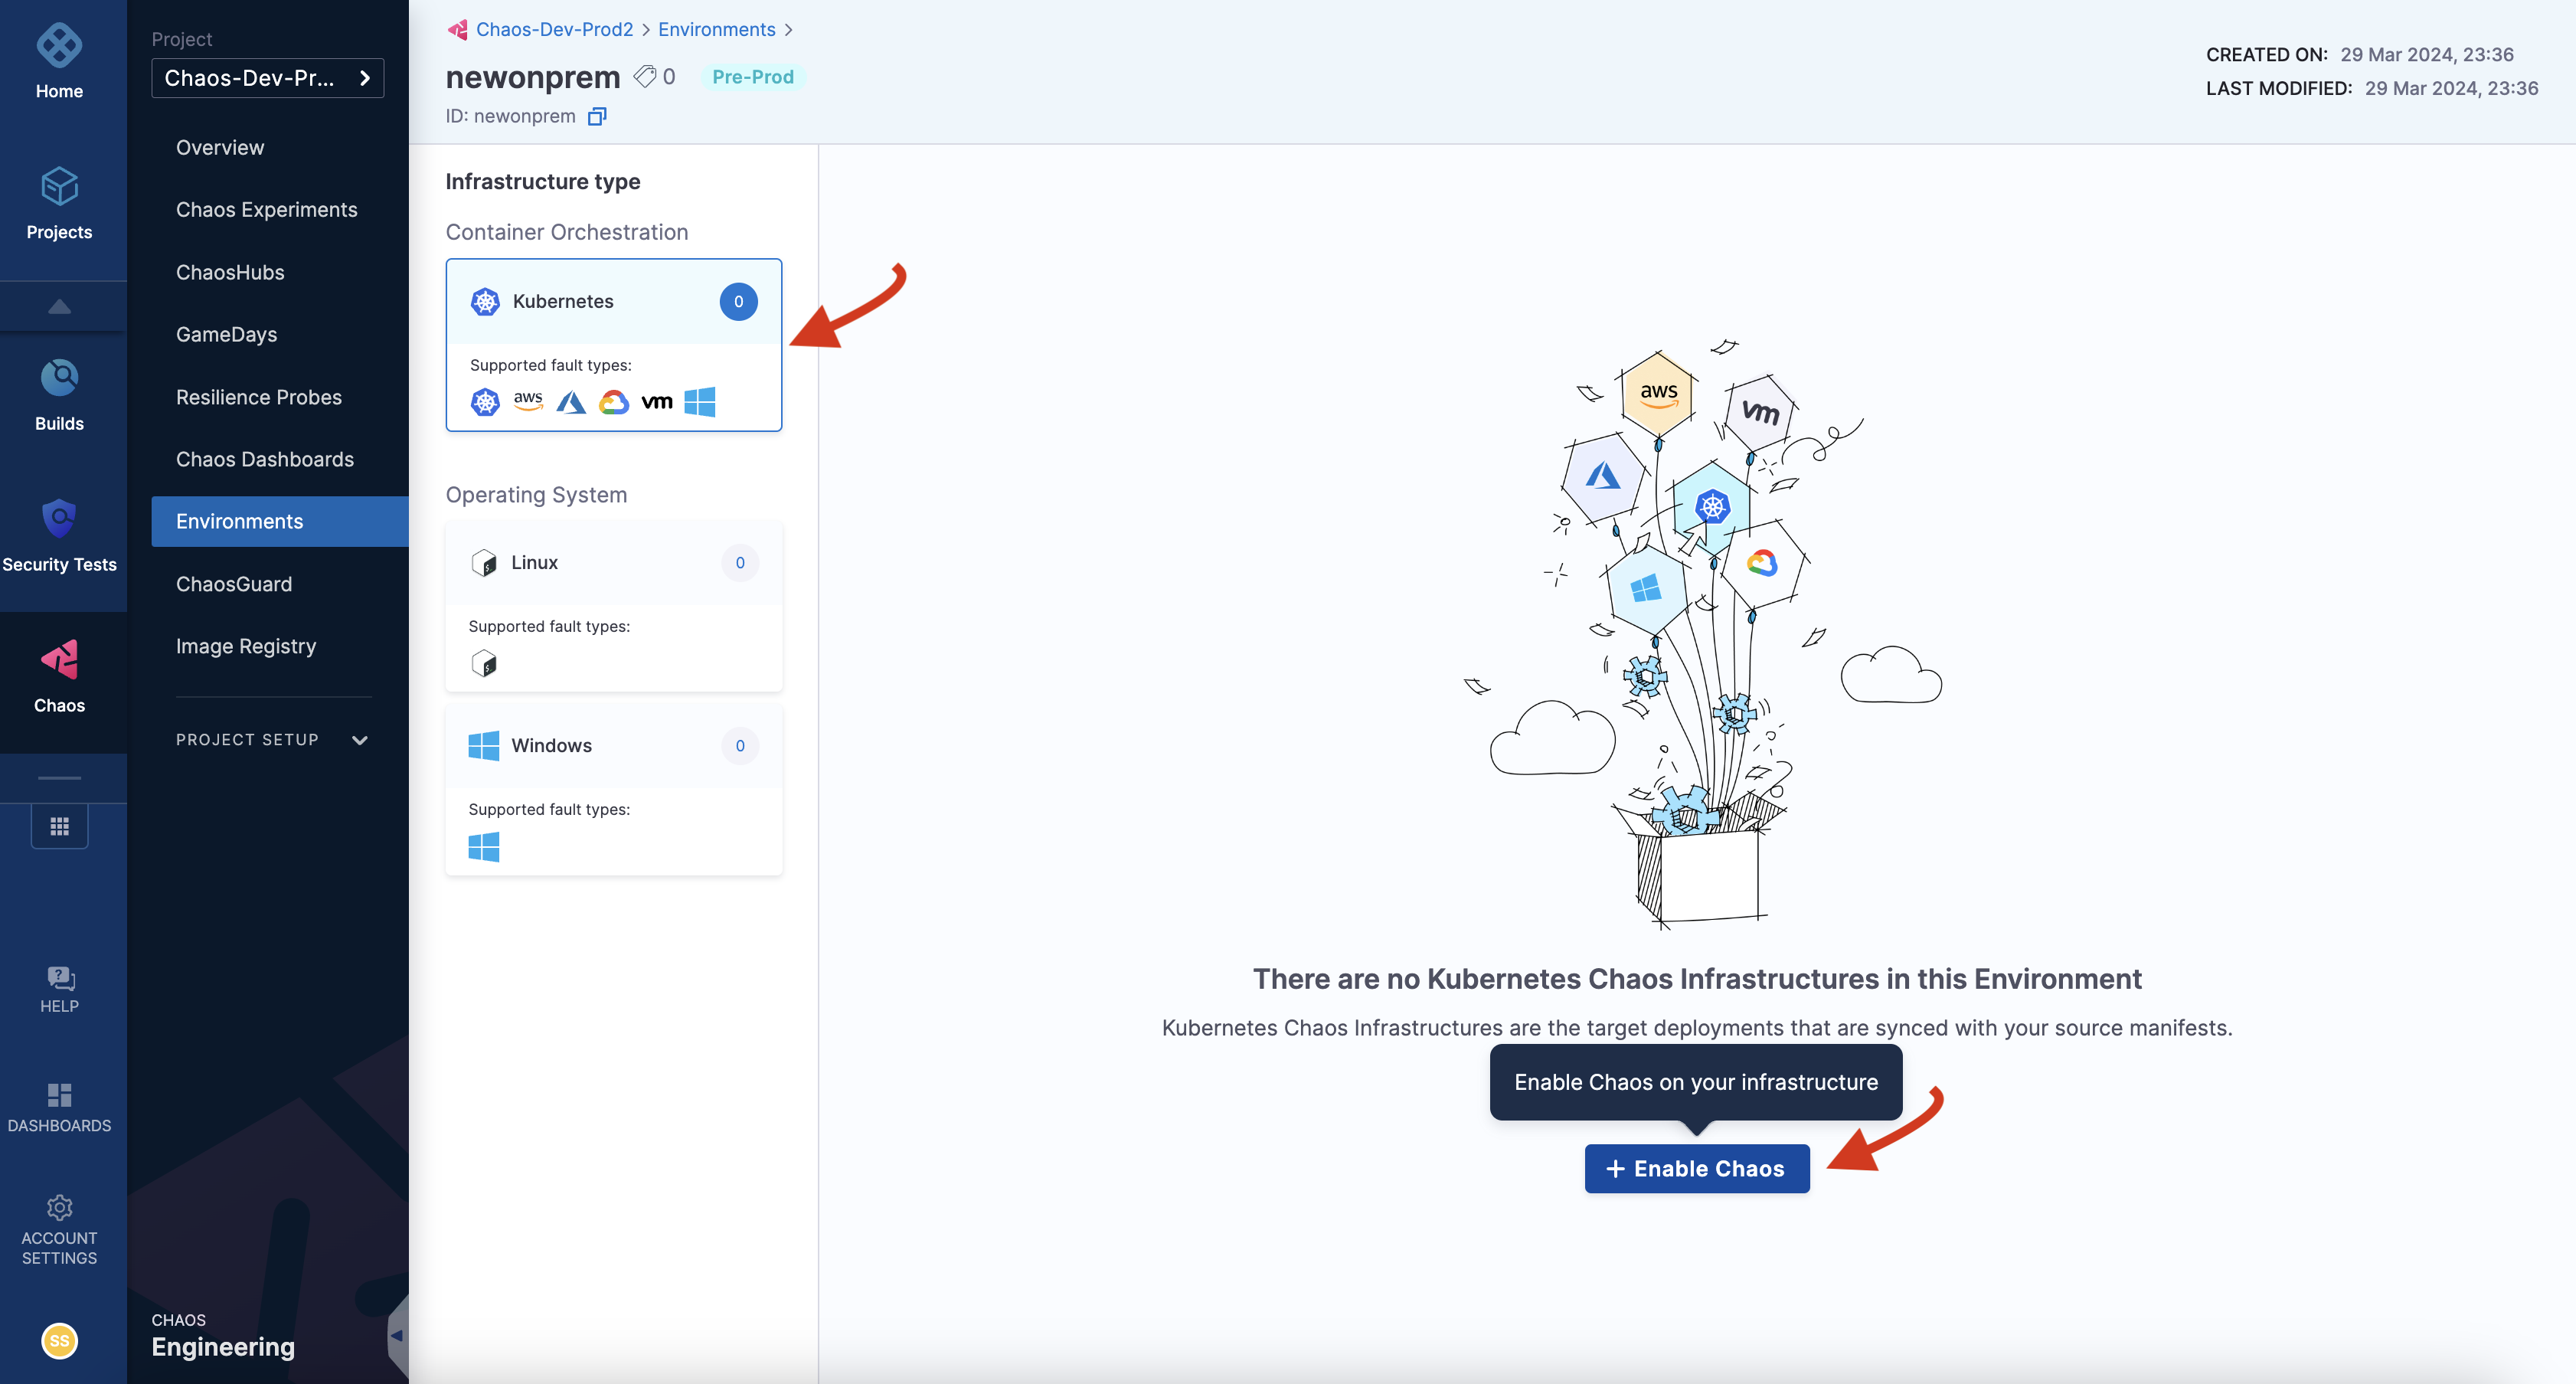
- Once you have created an environment, you can add chaos infrastructure to it. Depending on your application, you can select Kubernetes, Linux or Windows. In this tutorial, you can select a Kubernetes infrastructure, which you will use to inject faults into Kubernetes resources. You can use an existing infrastructure or create a new one. In this tutorial, you can create a new infrastructure. For this, select Enable chaos.
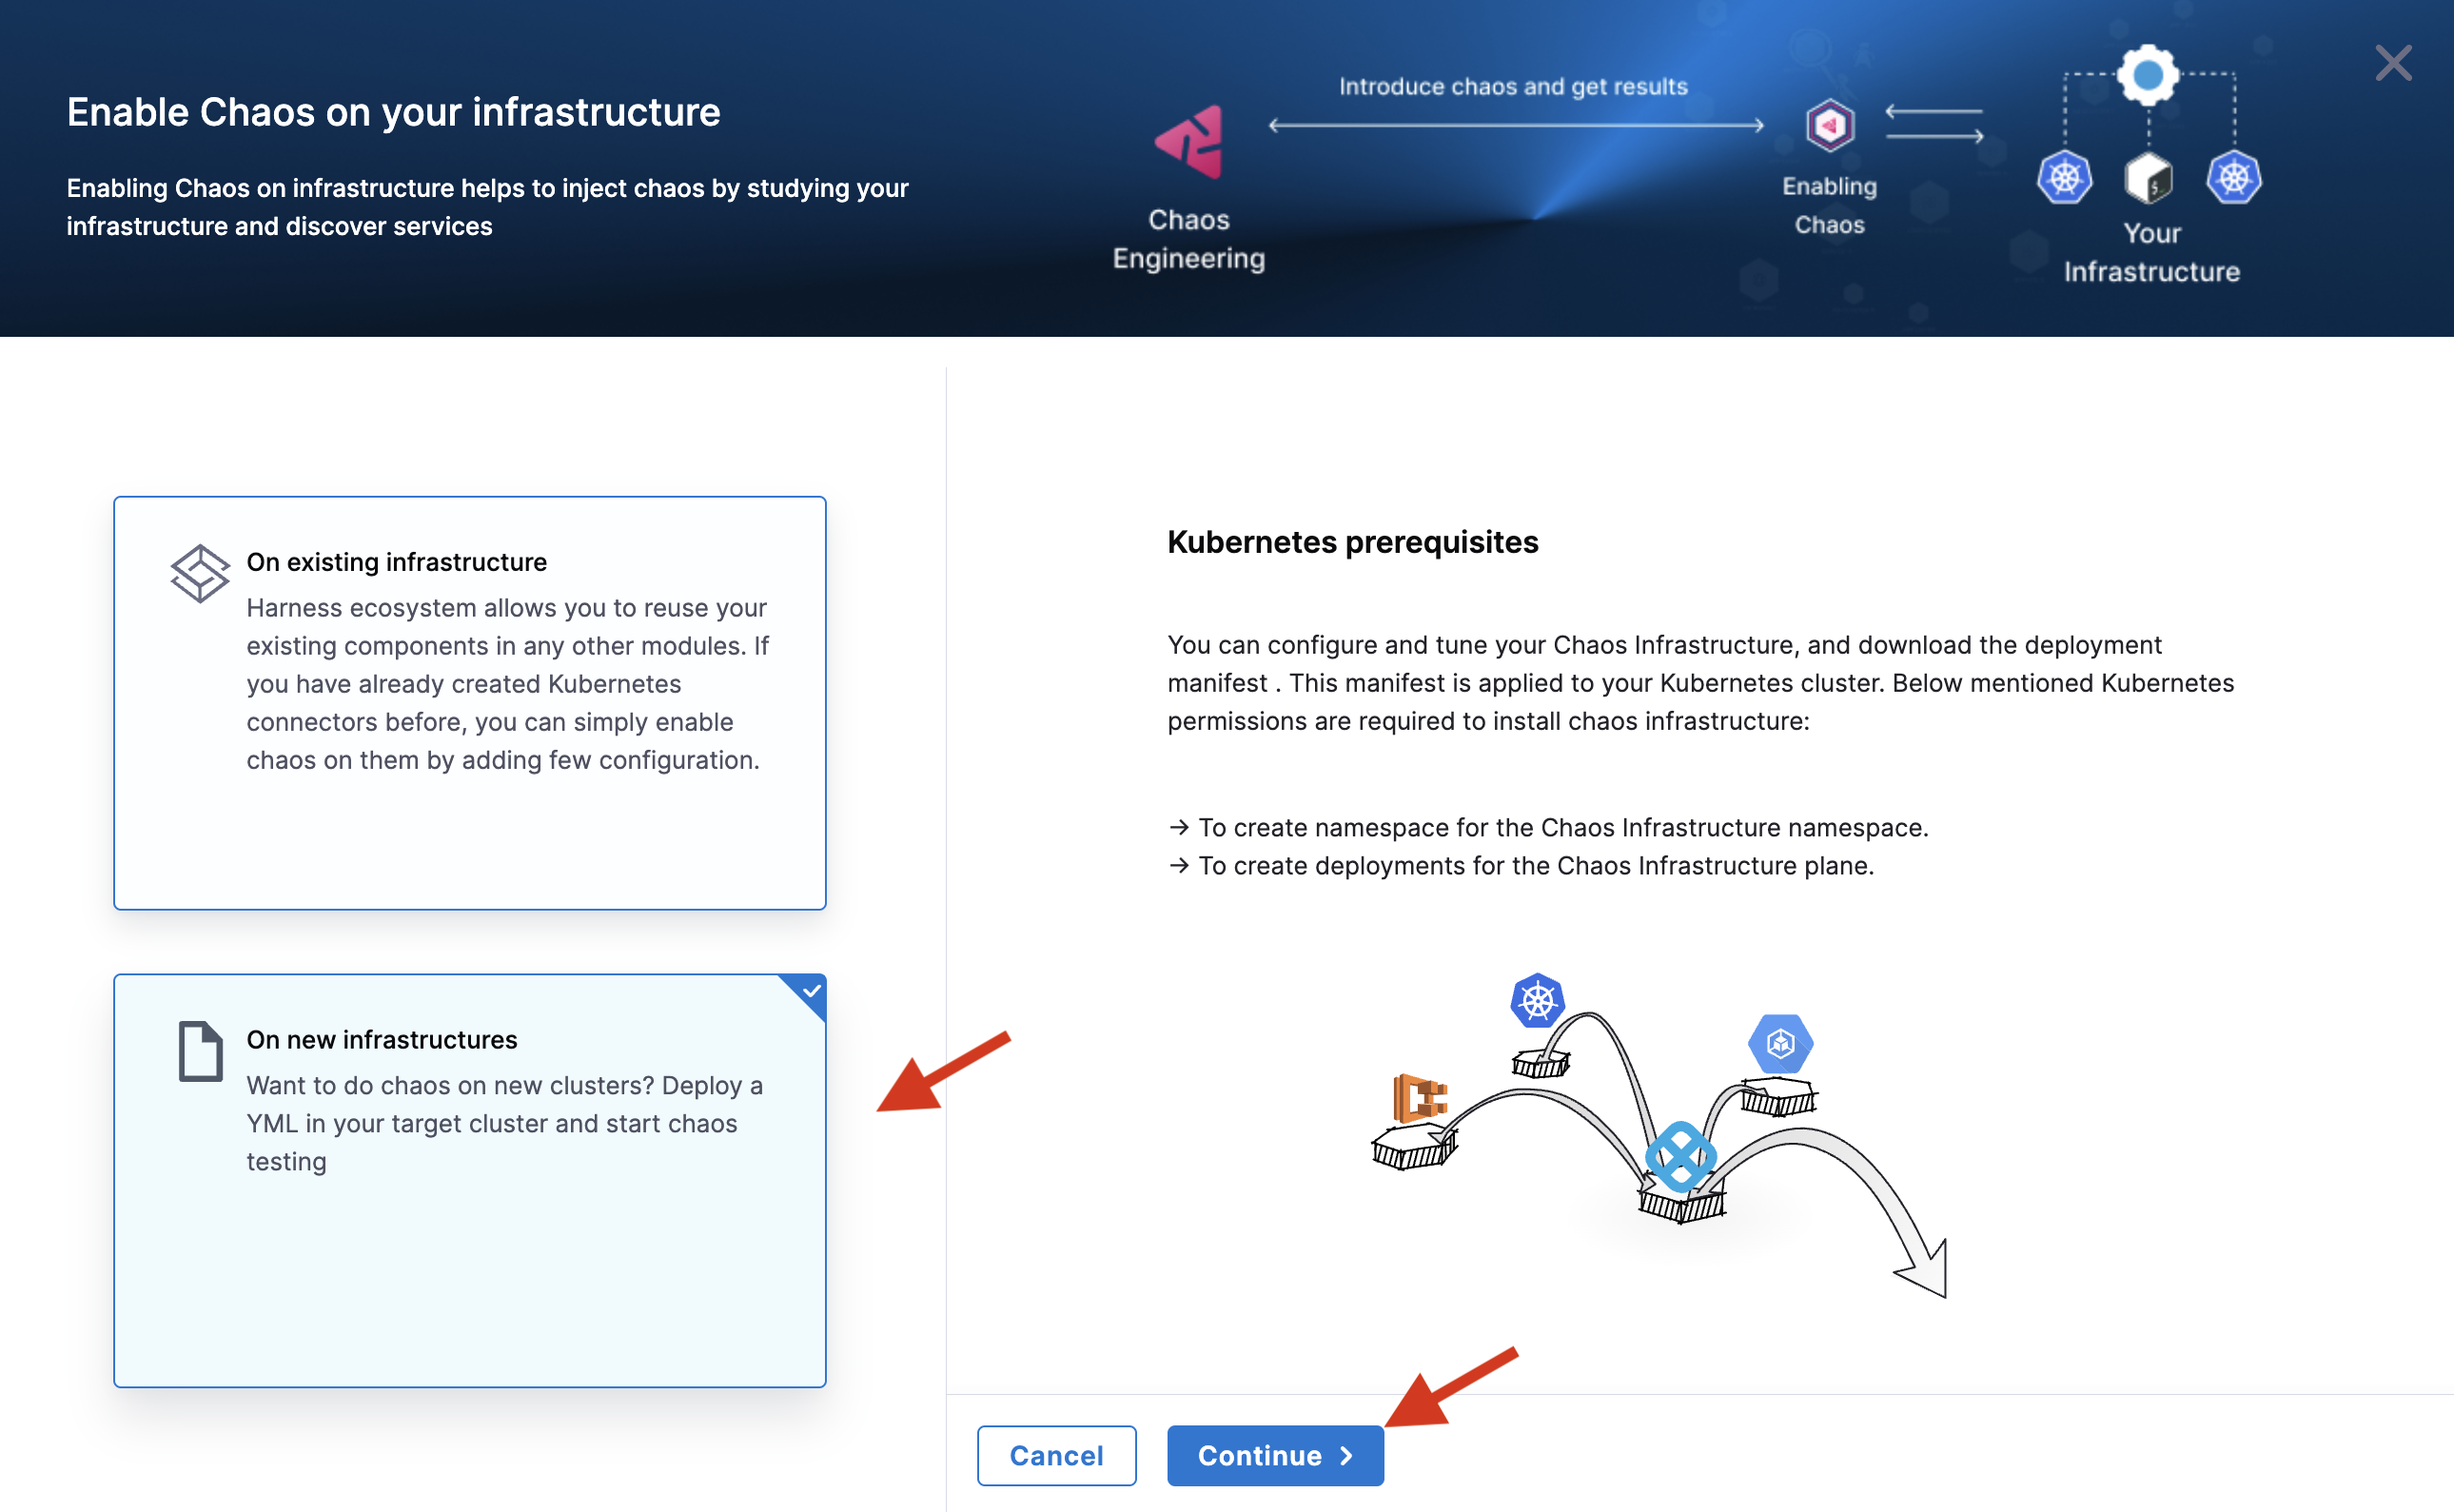
- This will lead you to a page where you can select an existing infrastructure or create a new infrastructure. Select On New Infrastructures and select Continue.
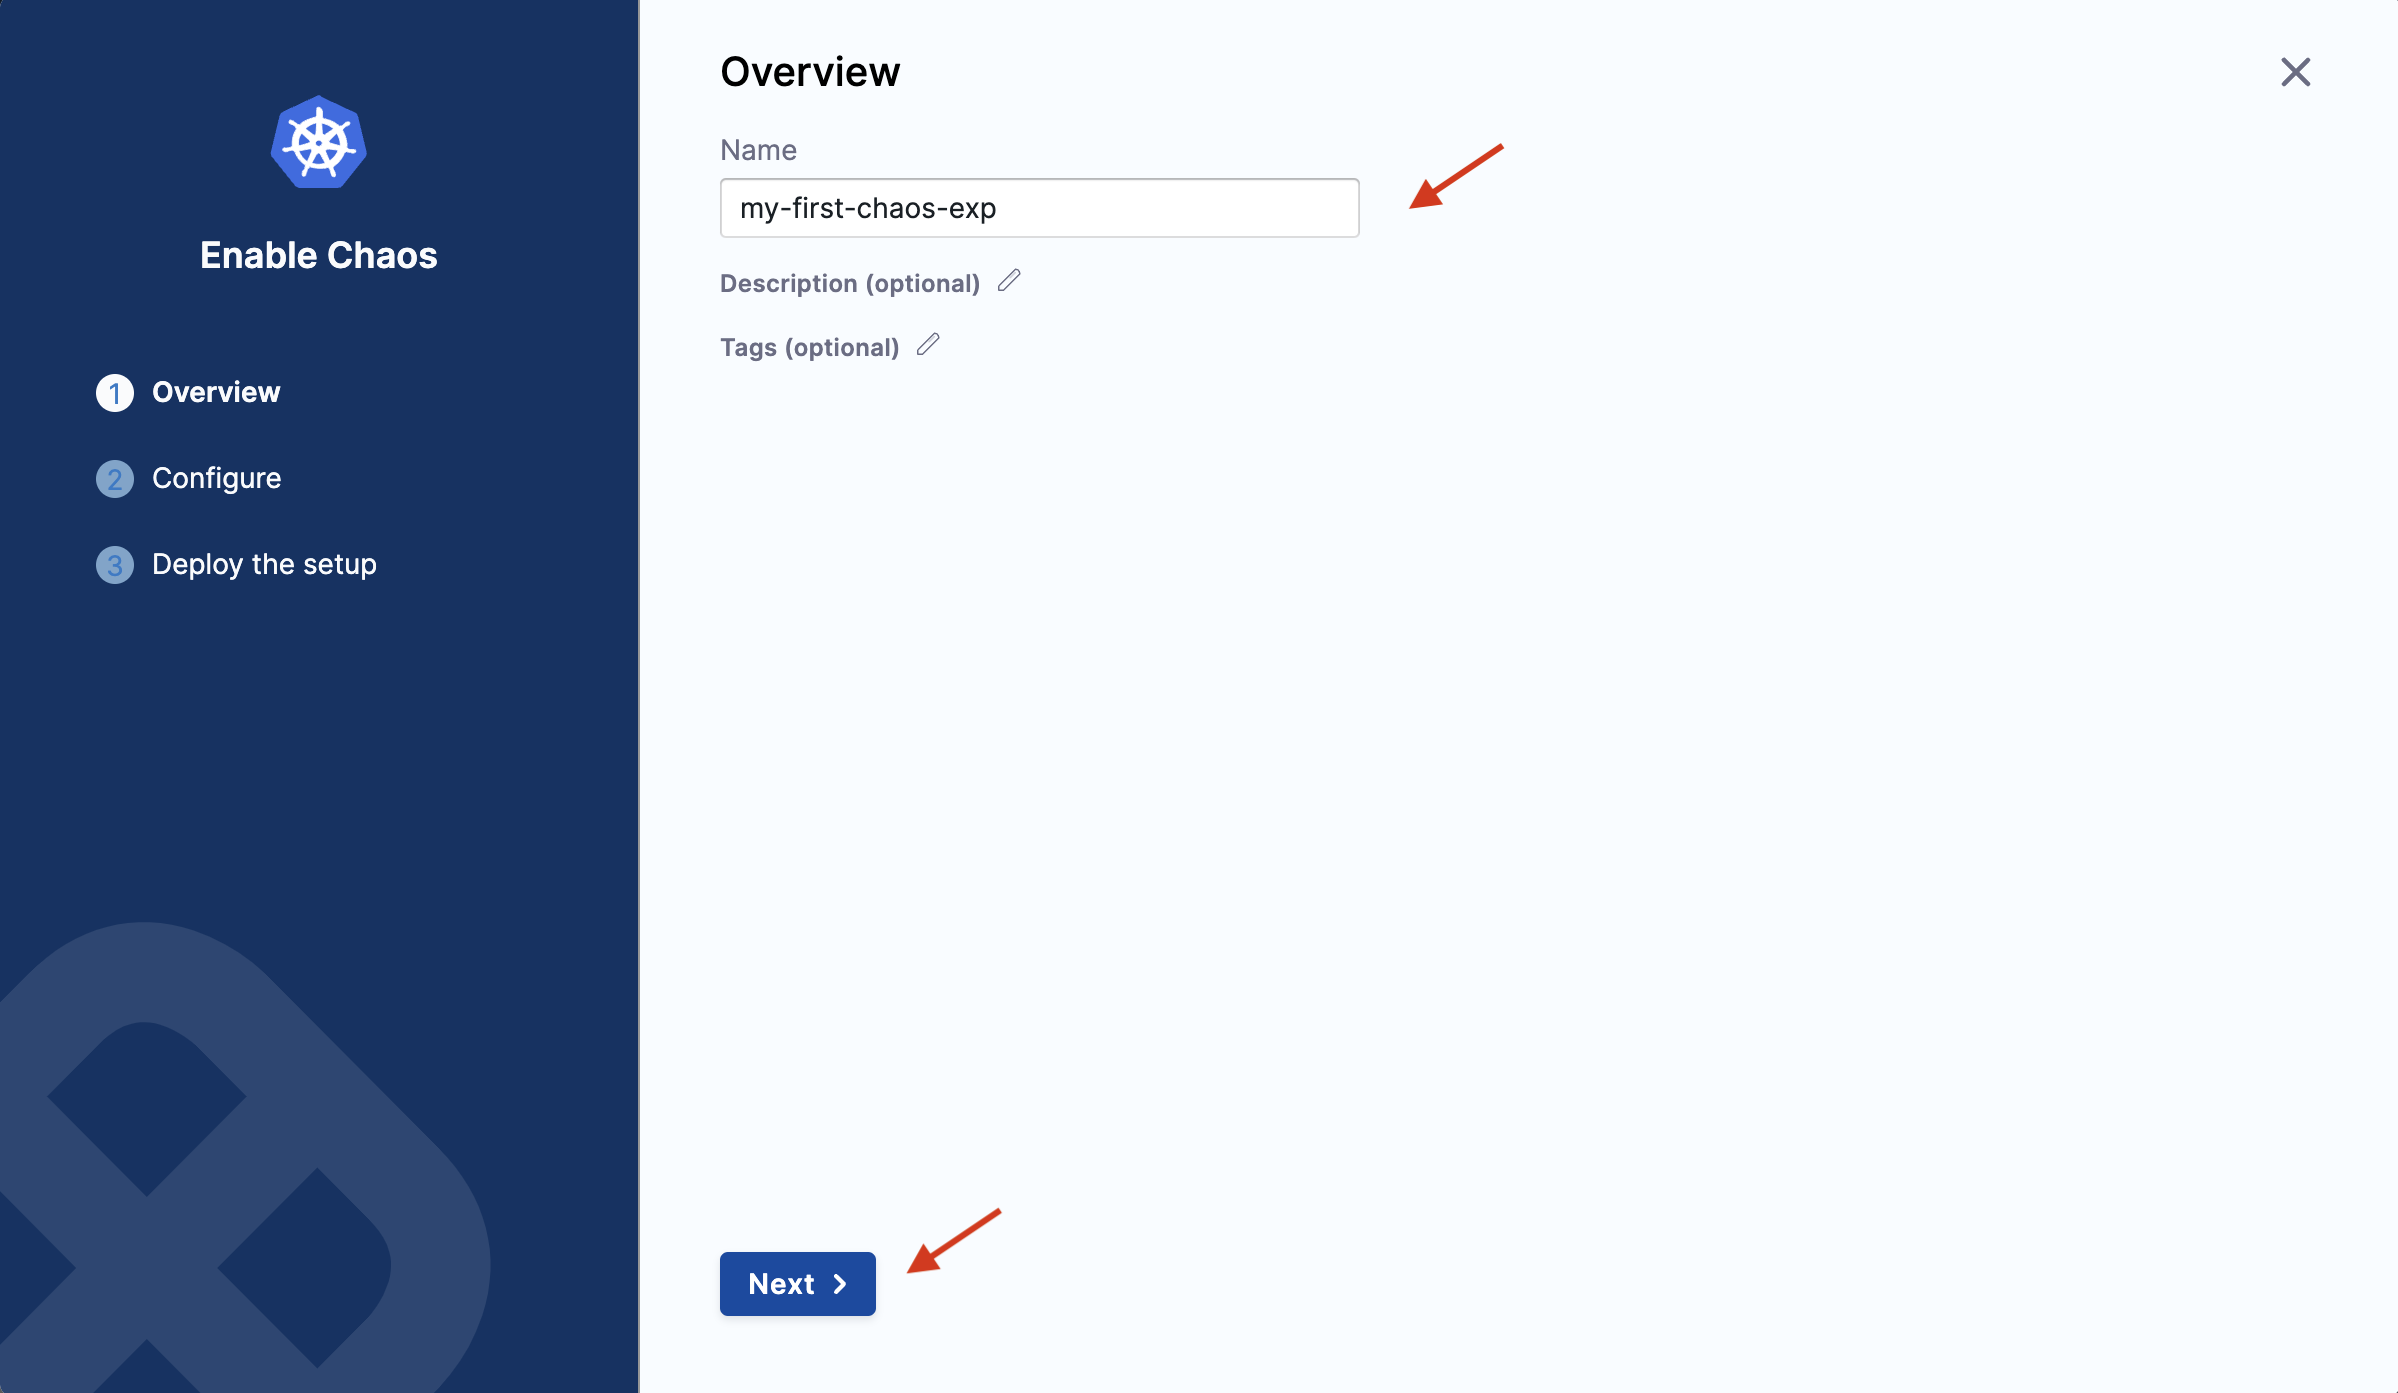
- Provide a name, a description (optional), and tags (optional) for your chaos infrastructure. Click Next.
- In this step, choose the installation type as Kubernetes, access type as Specific namespace access (click Change to display the Specific namespace access access type), namespace as hce, and service account name as hce. Select Next.
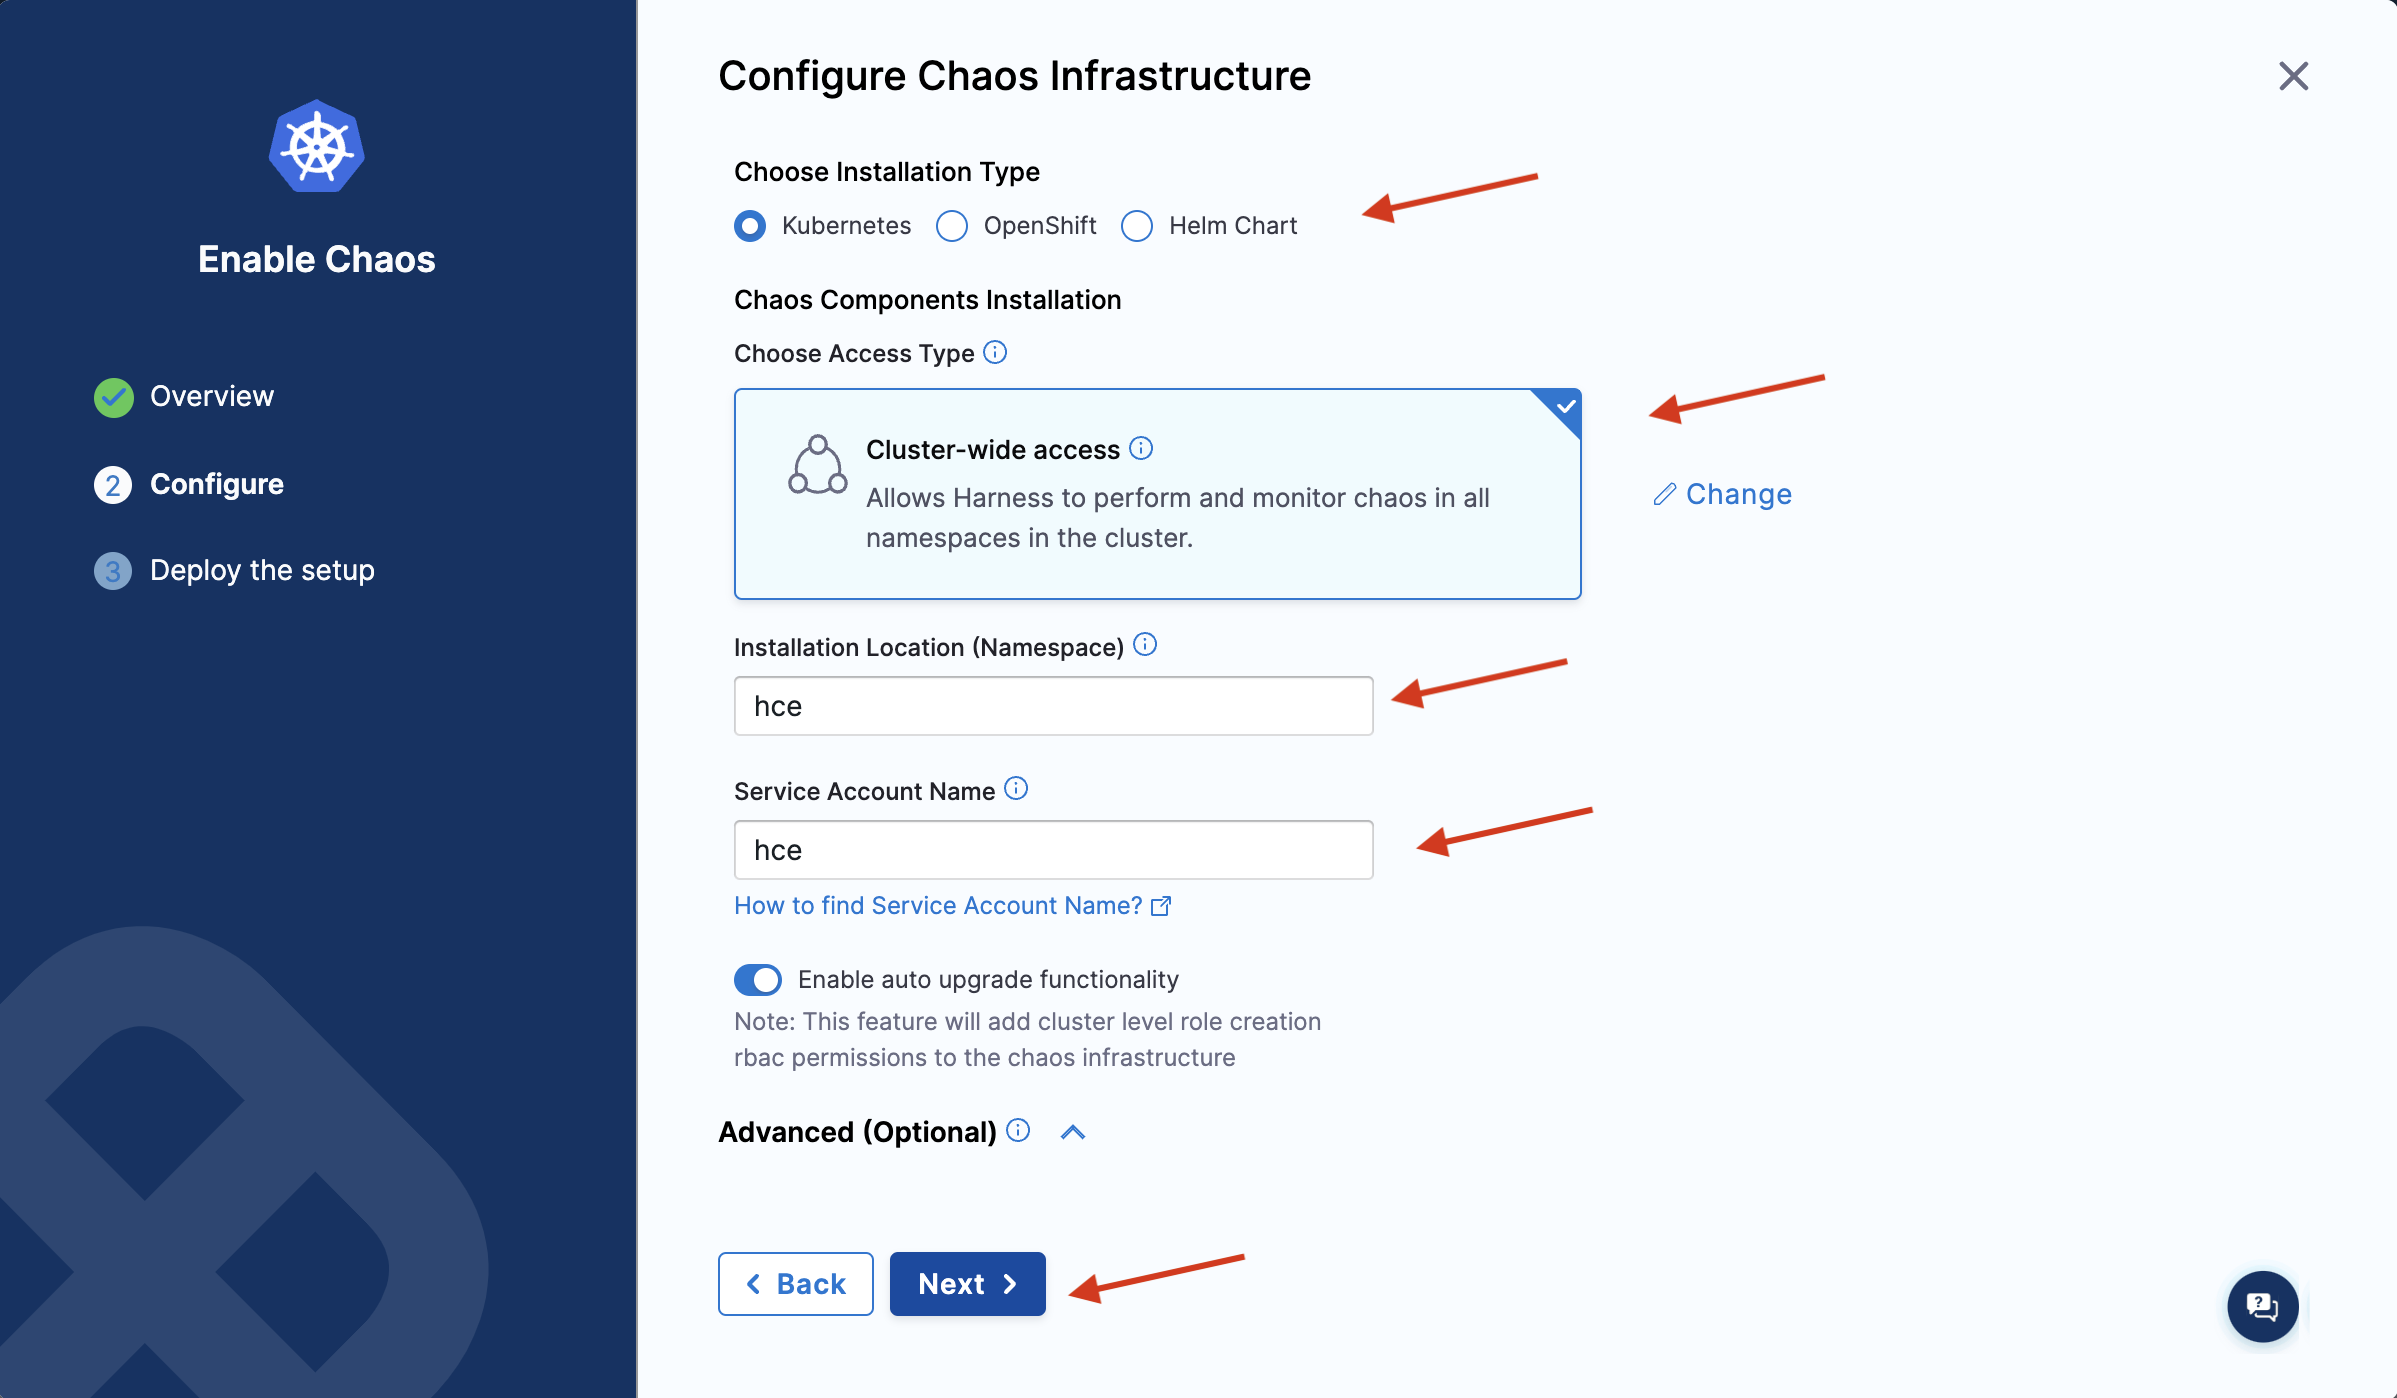
The Cluster-wide access installation mode allows you to target resources across all the namespaces in your cluster whereas the Specific namespace access mode restricts chaos injection to only the namespace in which the delegate is installed.
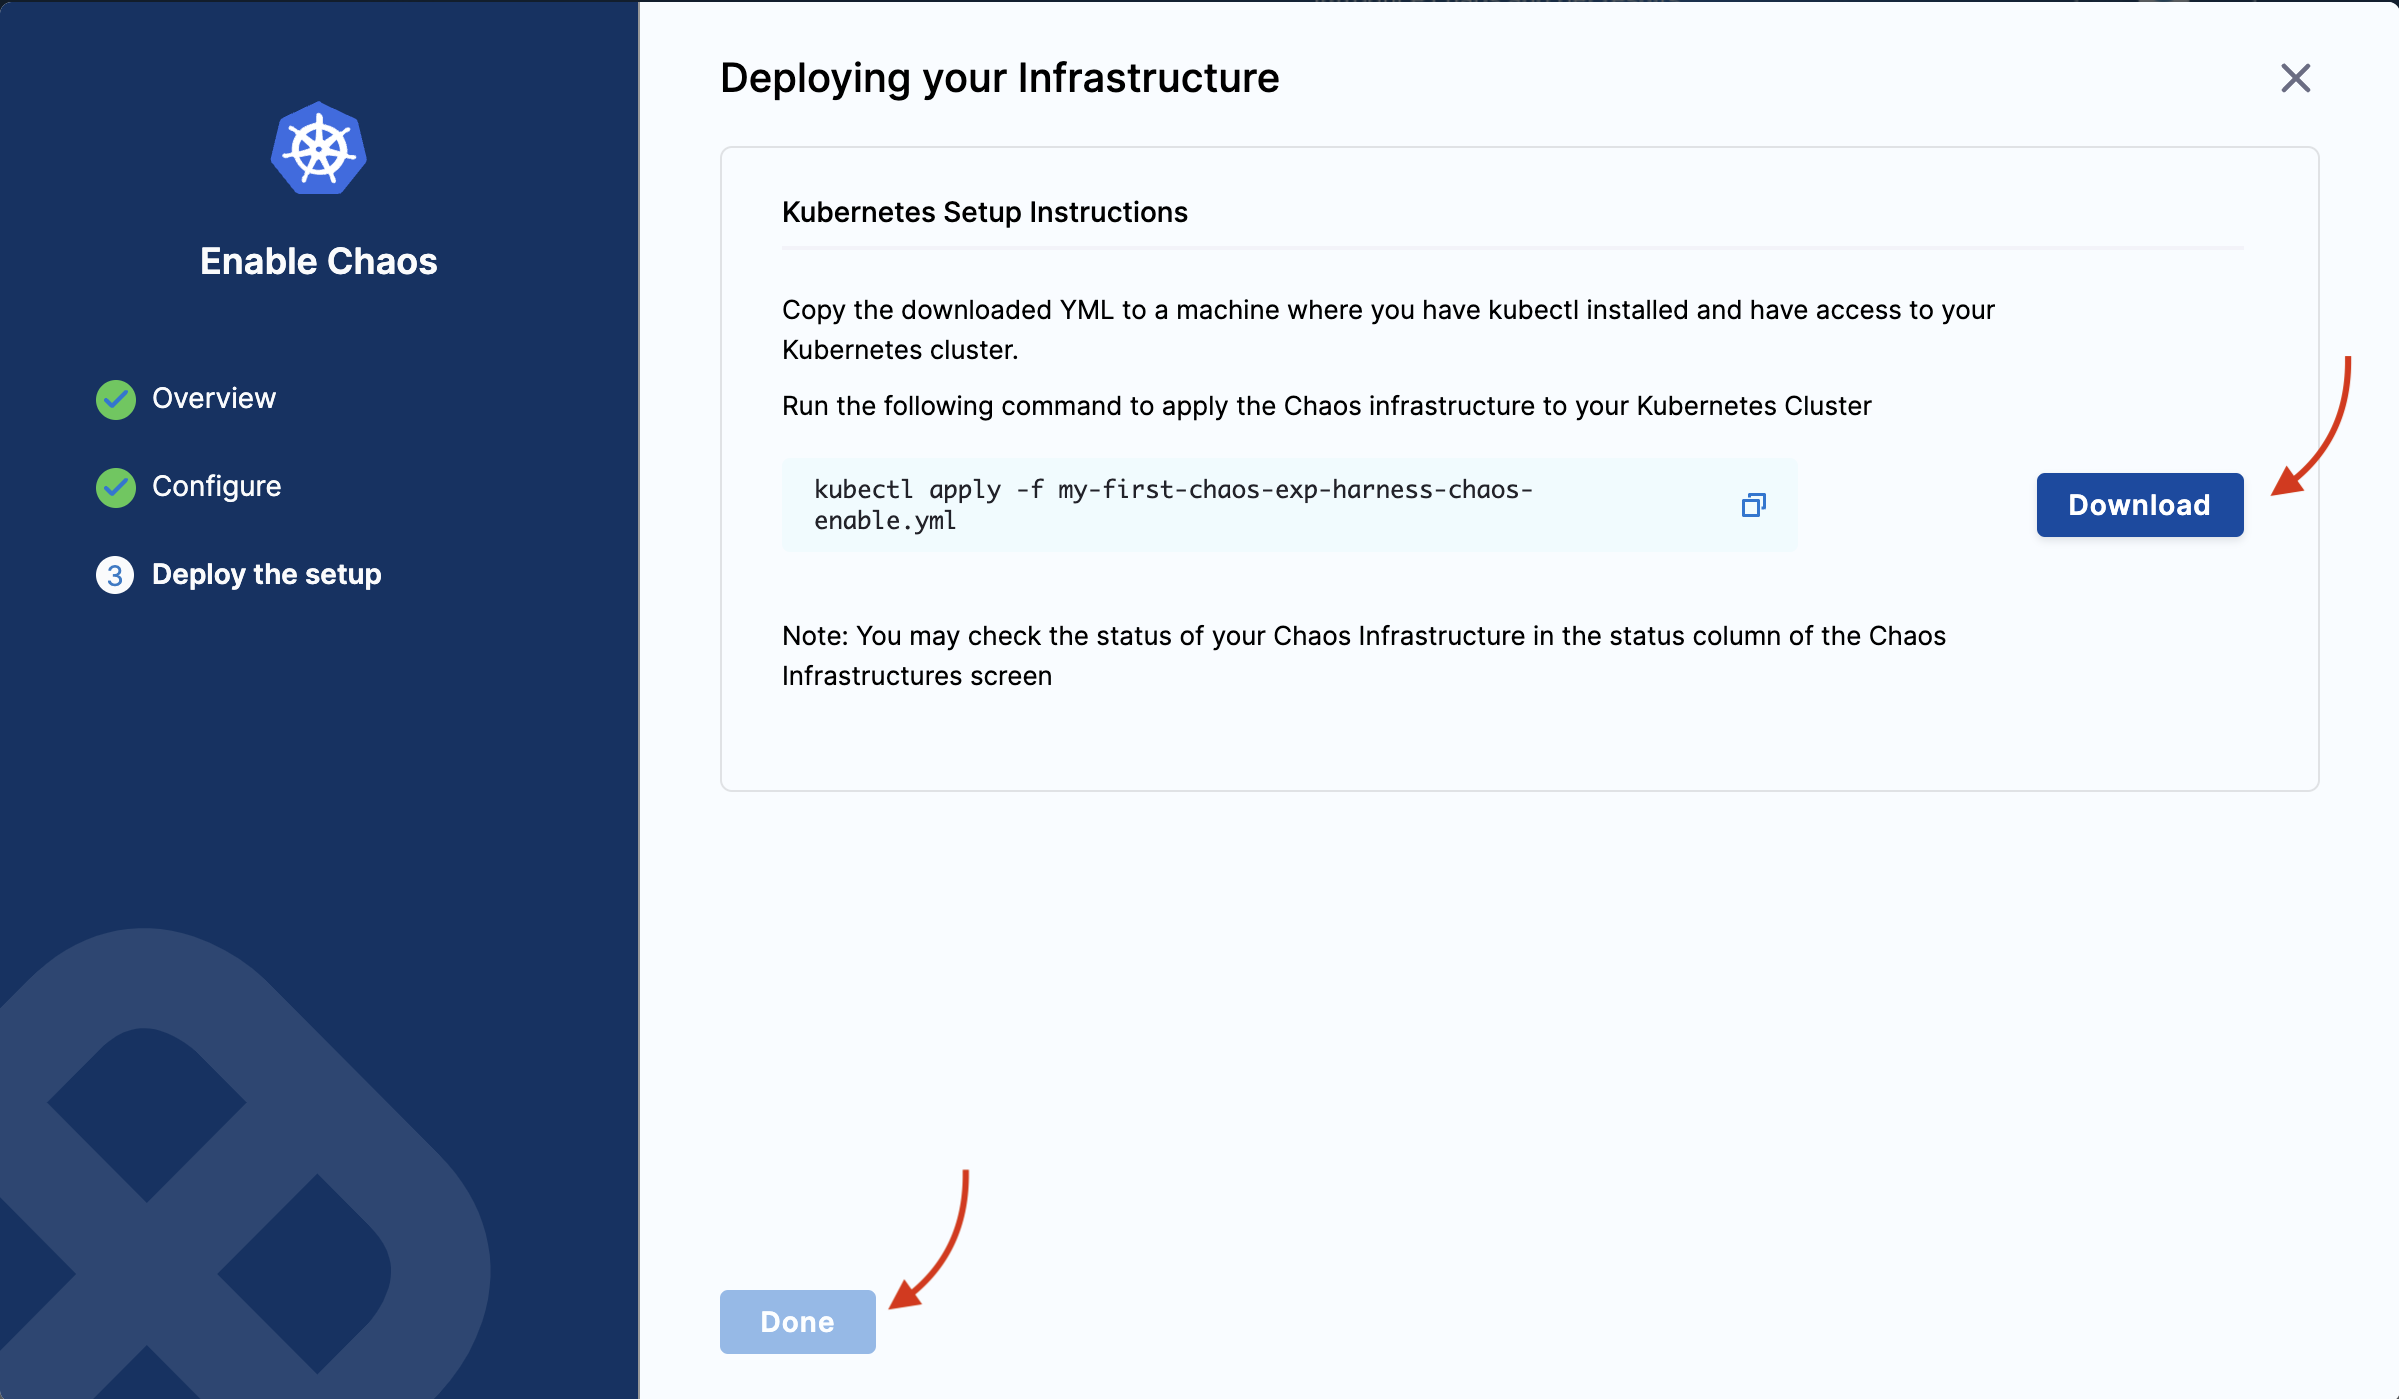
- Ensure you have access to your Kubernetes cluster via kubectl. Select Download to deploy your chaos infrastructure by downloading and applying the given manifest using your terminal. Once done, choose Done.
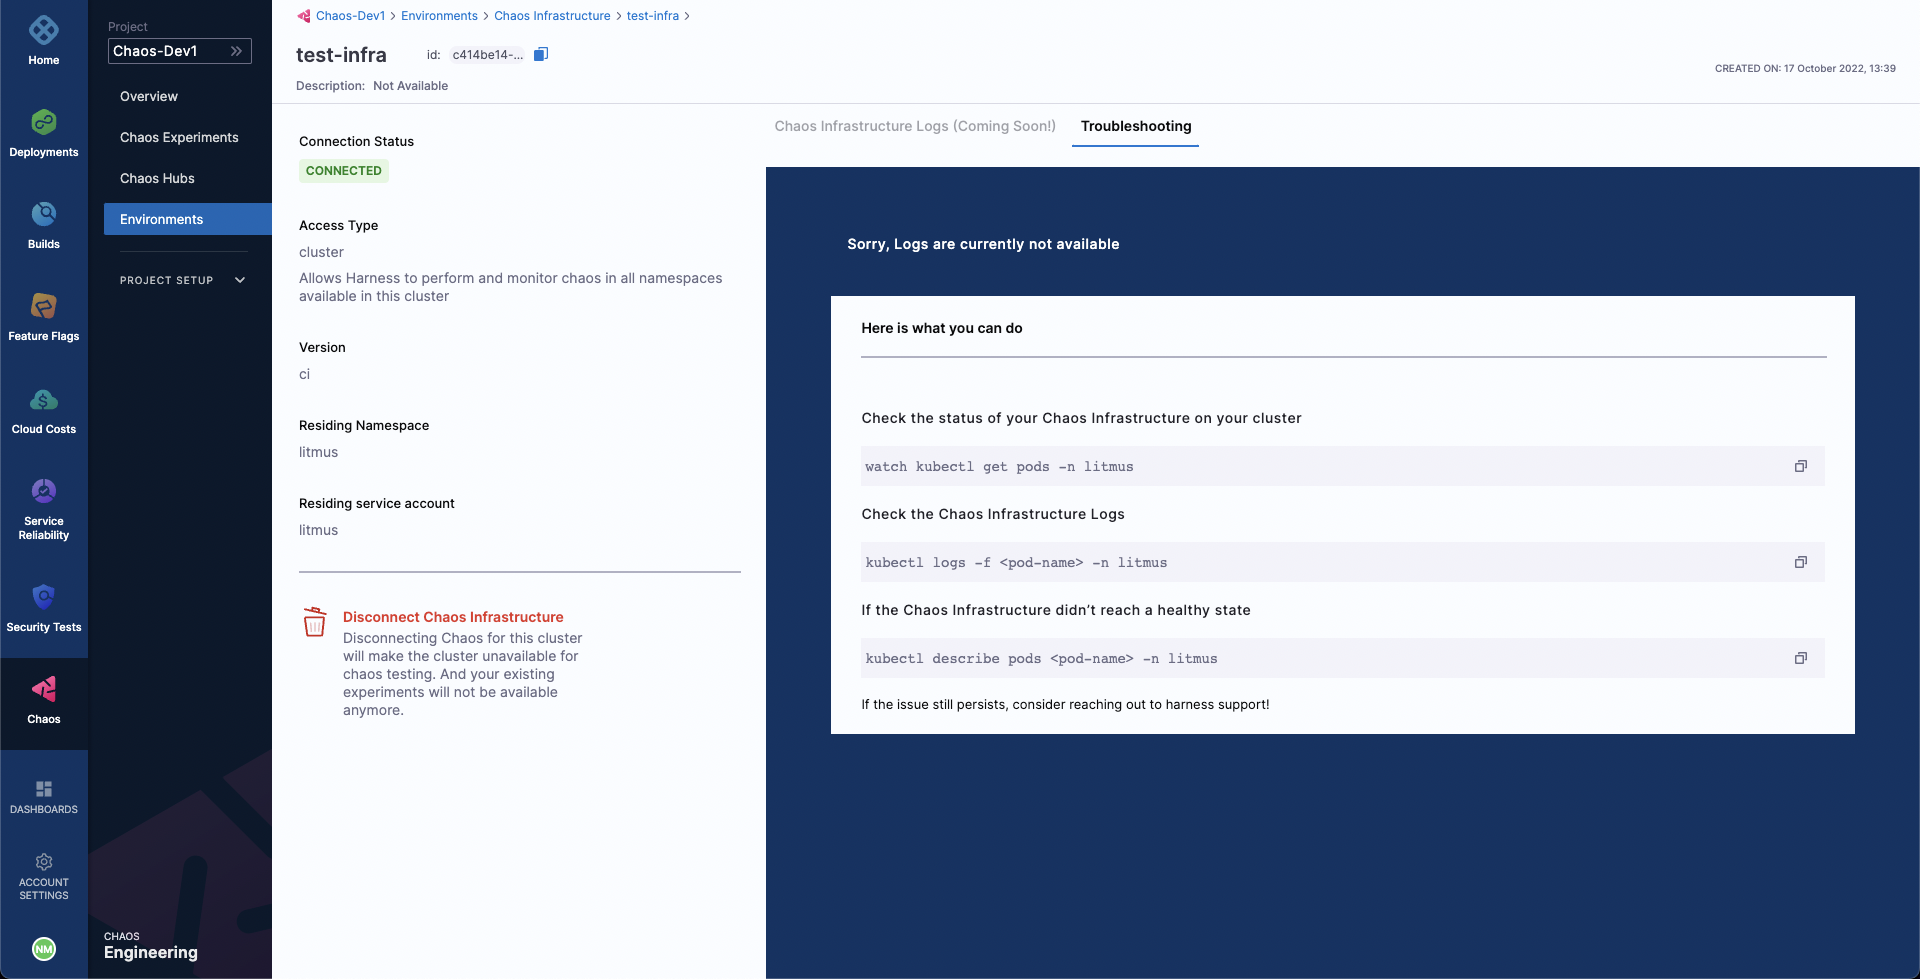
- It may take some time for the delegate to be set up in the Kubernetes cluster. Navigate to Environments and once the delegate is ready, the connection status displays as
CONNECTED.
Step 4: Create a demo application and observability infrastructure
Once you are all ready to target our Kubernetes resources, you can execute the simplest fault, Pod Delete. The "pod delete" chaos fault deletes the pods of a deployment, StatefulSet, DaemonSet, etc, to validate the resiliency of a microservice application.
-
You can use your application as a target, however, in this tutorial, use the Online Boutique microservices demo application as the target.
-
Before you set up the chaos experiment, install the target application. Run the following commands to set the target application microservices and observability infrastructure (optional), including Grafana, Prometheus, and a BlackBox exporter. Installing the observability infrastructure (optional) provides a dashboard that helps validate the health of the constituent application microservices in real-time.
❯ kubectl apply -f https://raw.githubusercontent.com/chaosnative/harness-chaos-demo/main/boutique-app-manifests/manifest/app.yaml -n hce
❯ kubectl apply -f https://raw.githubusercontent.com/chaosnative/harness-chaos-demo/main/boutique-app-manifests/manifest/monitoring.yaml -n hce
- Earlier, you specified the installation mode as Specific namespace access, hence the resources are deployed in the
hcenamespace. - The target application and observability infrastructure pods are available in the
hcenamespace
- To view the pods in the
hcenamespace, execute the command below:
❯ kubectl get pods -n hce

NAME                                           READY   STATUS    RESTARTS        AGE
adservice-68db567bb5-hd47j                     1/1     Running   0               5m39s
cartservice-6b8f46f64f-6mrkv                   1/1     Running   0               5m39s
chaos-exporter-765d6b6674-tkrpm                1/1     Running   0               11m
chaos-operator-ce-678b67c75-l68m5              1/1     Running   0               11m
checkoutservice-7545ff6849-rdl9f               1/1     Running   0               5m40s
currencyservice-5769b647d5-trx69               1/1     Running   0               5m39s
emailservice-55c84dcfdc-c9x9q                  1/1     Running   0               5m40s
frontend-74b7898dd9-x4bzr                      1/1     Running   0               5m40s
grafana-6f6fb469b7-bm9vh                       1/1     Running   0               5m34s
loadgenerator-5b875b84dd-pcjdr                 1/1     Running   0               5m39s
paymentservice-59d87f77bc-fkwjq                1/1     Running   0               5m40s
productcatalogservice-676d7d7dbc-nx75x         1/1     Running   0               5m40s
prometheus-blackbox-exporter-6d955c876-l7fdv   2/2     Running   0               5m34s
prometheus-deployment-779b88bf5d-zf8f9         1/1     Running   0               5m34s
recommendationservice-6fc8b4d9cf-4s96t         1/1     Running   0               5m40s
redis-cart-7cd9d8966d-mgbhx                    1/1     Running   0               5m39s
shippingservice-7b4945b5fc-cbmc9               1/1     Running   0               5m39s
subscriber-7774bd95d4-4rnwp                    1/1     Running   0               11m
workflow-controller-6d5d75dc7c-v9vqc           1/1     Running   0               11m
- To list the services available in the
hcenamespace, execute the command below:
❯ kubectl get services -n hce

NAME                           TYPE           CLUSTER-IP       EXTERNAL-IP   PORT(S)          AGE
adservice                      ClusterIP      10.110.145.128   <none>        9555/TCP         9m48s
cartservice                    ClusterIP      10.103.73.107    <none>        7070/TCP         9m49s
chaos-exporter                 ClusterIP      10.103.163.182   <none>        8080/TCP         15m
checkoutservice                ClusterIP      10.105.52.42     <none>        5050/TCP         9m49s
currencyservice                ClusterIP      10.108.12.130    <none>        7000/TCP         9m49s
emailservice                   ClusterIP      10.106.79.95     <none>        5000/TCP         9m49s
frontend                       ClusterIP      10.98.222.239    <none>        80/TCP           9m49s
frontend-external              LoadBalancer   10.101.239.201   localhost     80:30963/TCP     9m49s
grafana                        LoadBalancer   10.96.206.174    localhost     3000:32659/TCP   9m43s
paymentservice                 ClusterIP      10.106.36.71     <none>        50051/TCP        9m49s
productcatalogservice          ClusterIP      10.97.78.9       <none>        3550/TCP         9m49s
prometheus-blackbox-exporter   ClusterIP      10.103.118.20    <none>        9115/TCP         9m43s
prometheus-k8s                 LoadBalancer   10.106.153.10    localhost     9090:32101/TCP   9m43s
recommendationservice          ClusterIP      10.106.227.47    <none>        8080/TCP         9m49s
redis-cart                     ClusterIP      10.103.184.94    <none>        6379/TCP         9m48s
shippingservice                ClusterIP      10.109.150.169   <none>        50051/TCP        9m48s
workflow-controller-metrics    ClusterIP      10.106.97.173    <none>        9090/TCP         15m
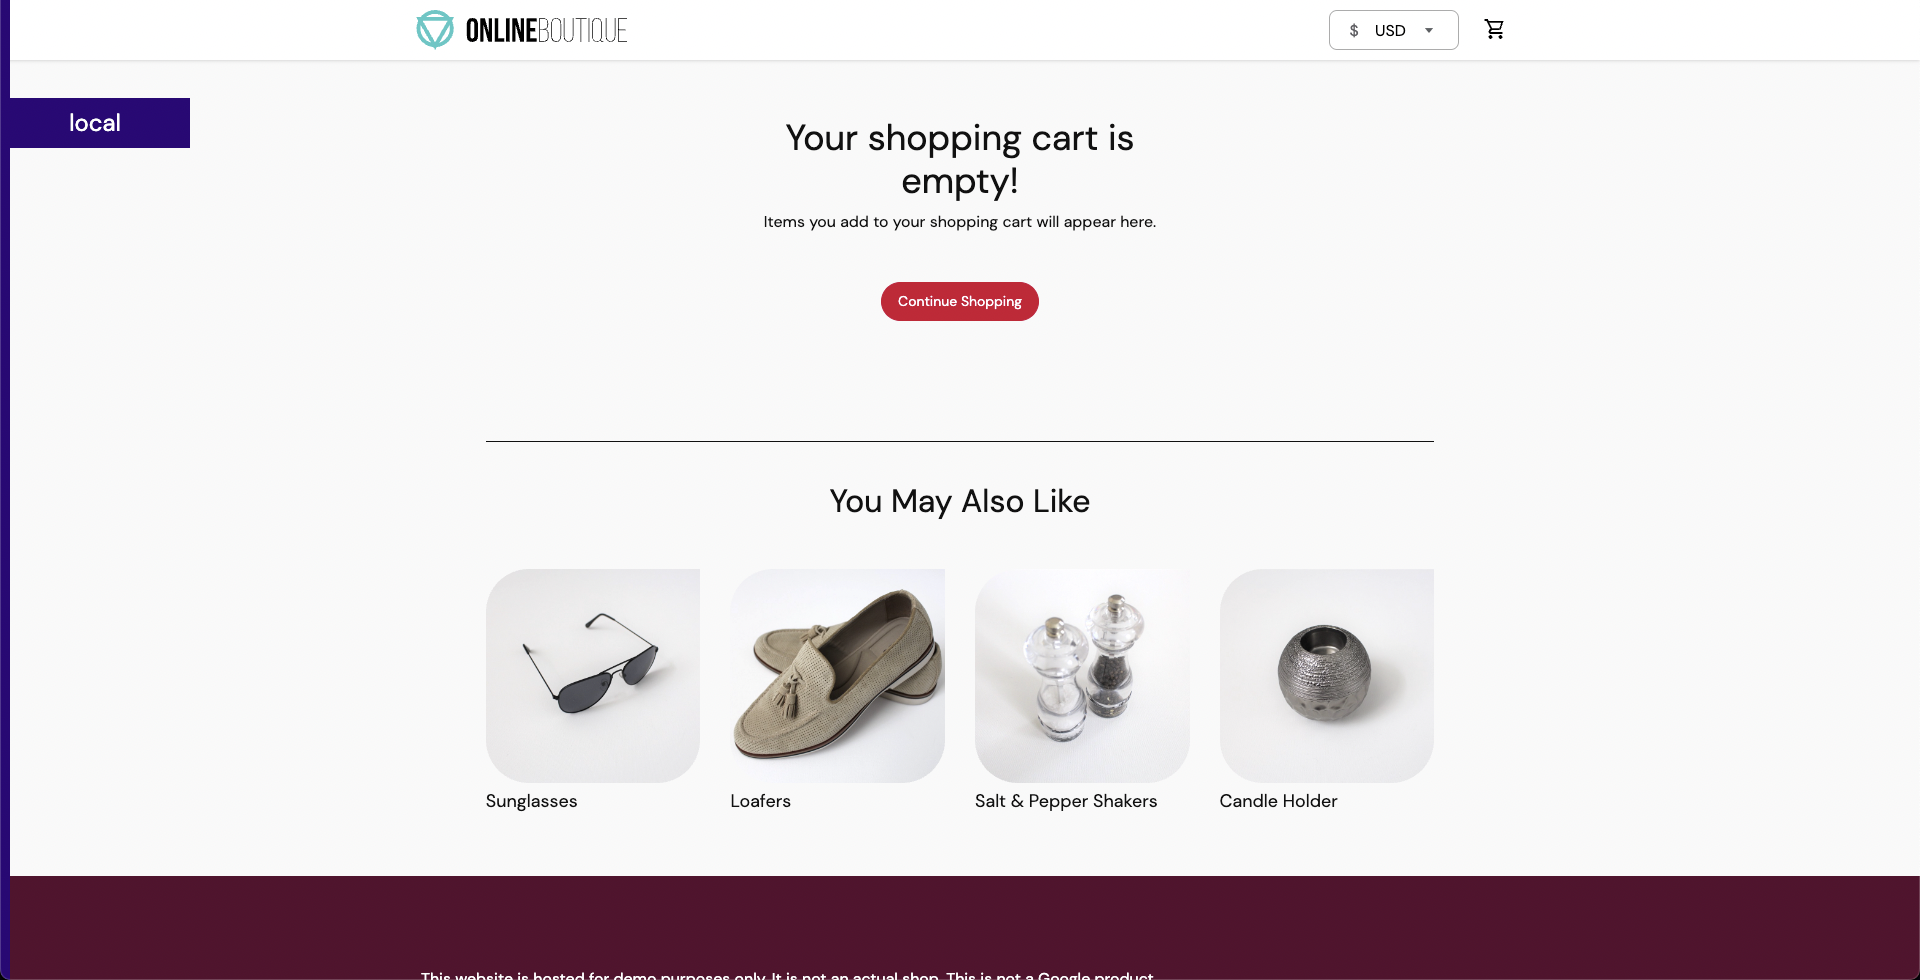
- To access the frontend of the target application in your browser, use the
frontend-externalLoadBalancer service.

- Similarly, you can access the Grafana dashboard. Login with the default credentials, that is, username
adminand passwordadmin, and browse the Online Boutique application dashboard. Currently, all the metrics indicate normal application behavior.
Step 5: Construct a chaos experiment
Since the target application has been deployed, you can now create a chaos experiment. You will target the pods of the carts microservice with the pod delete fault. Currently, the cart page is healthy and accessible from the front end, as seen in the /cart route.
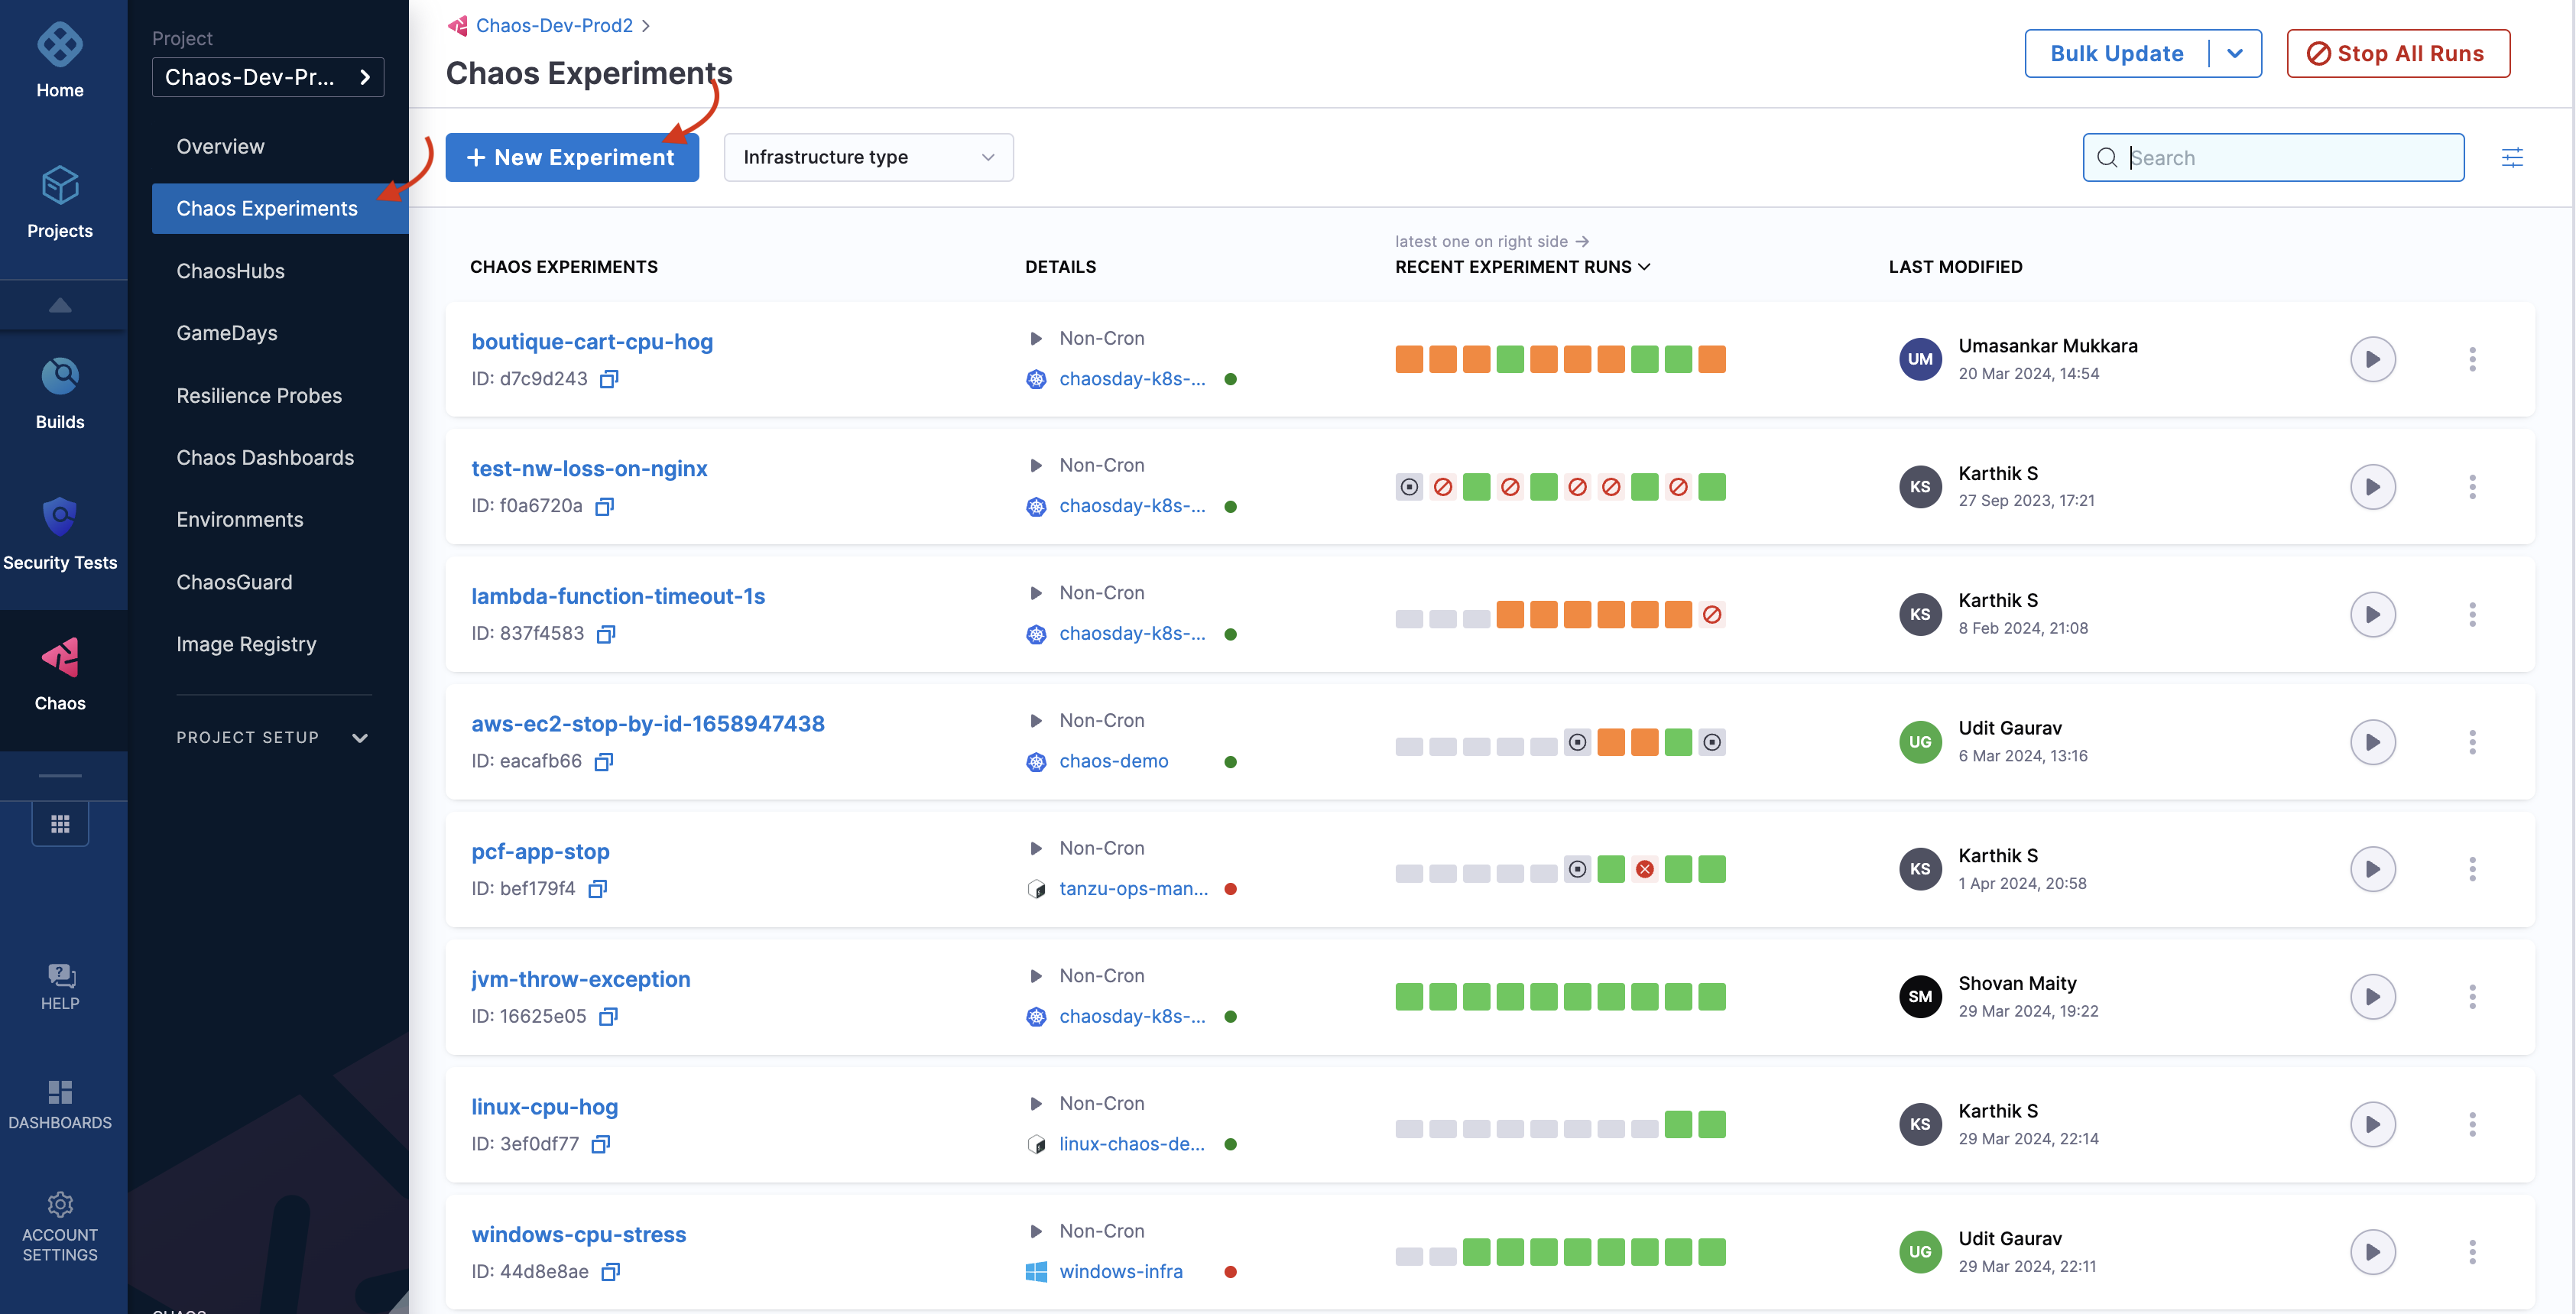
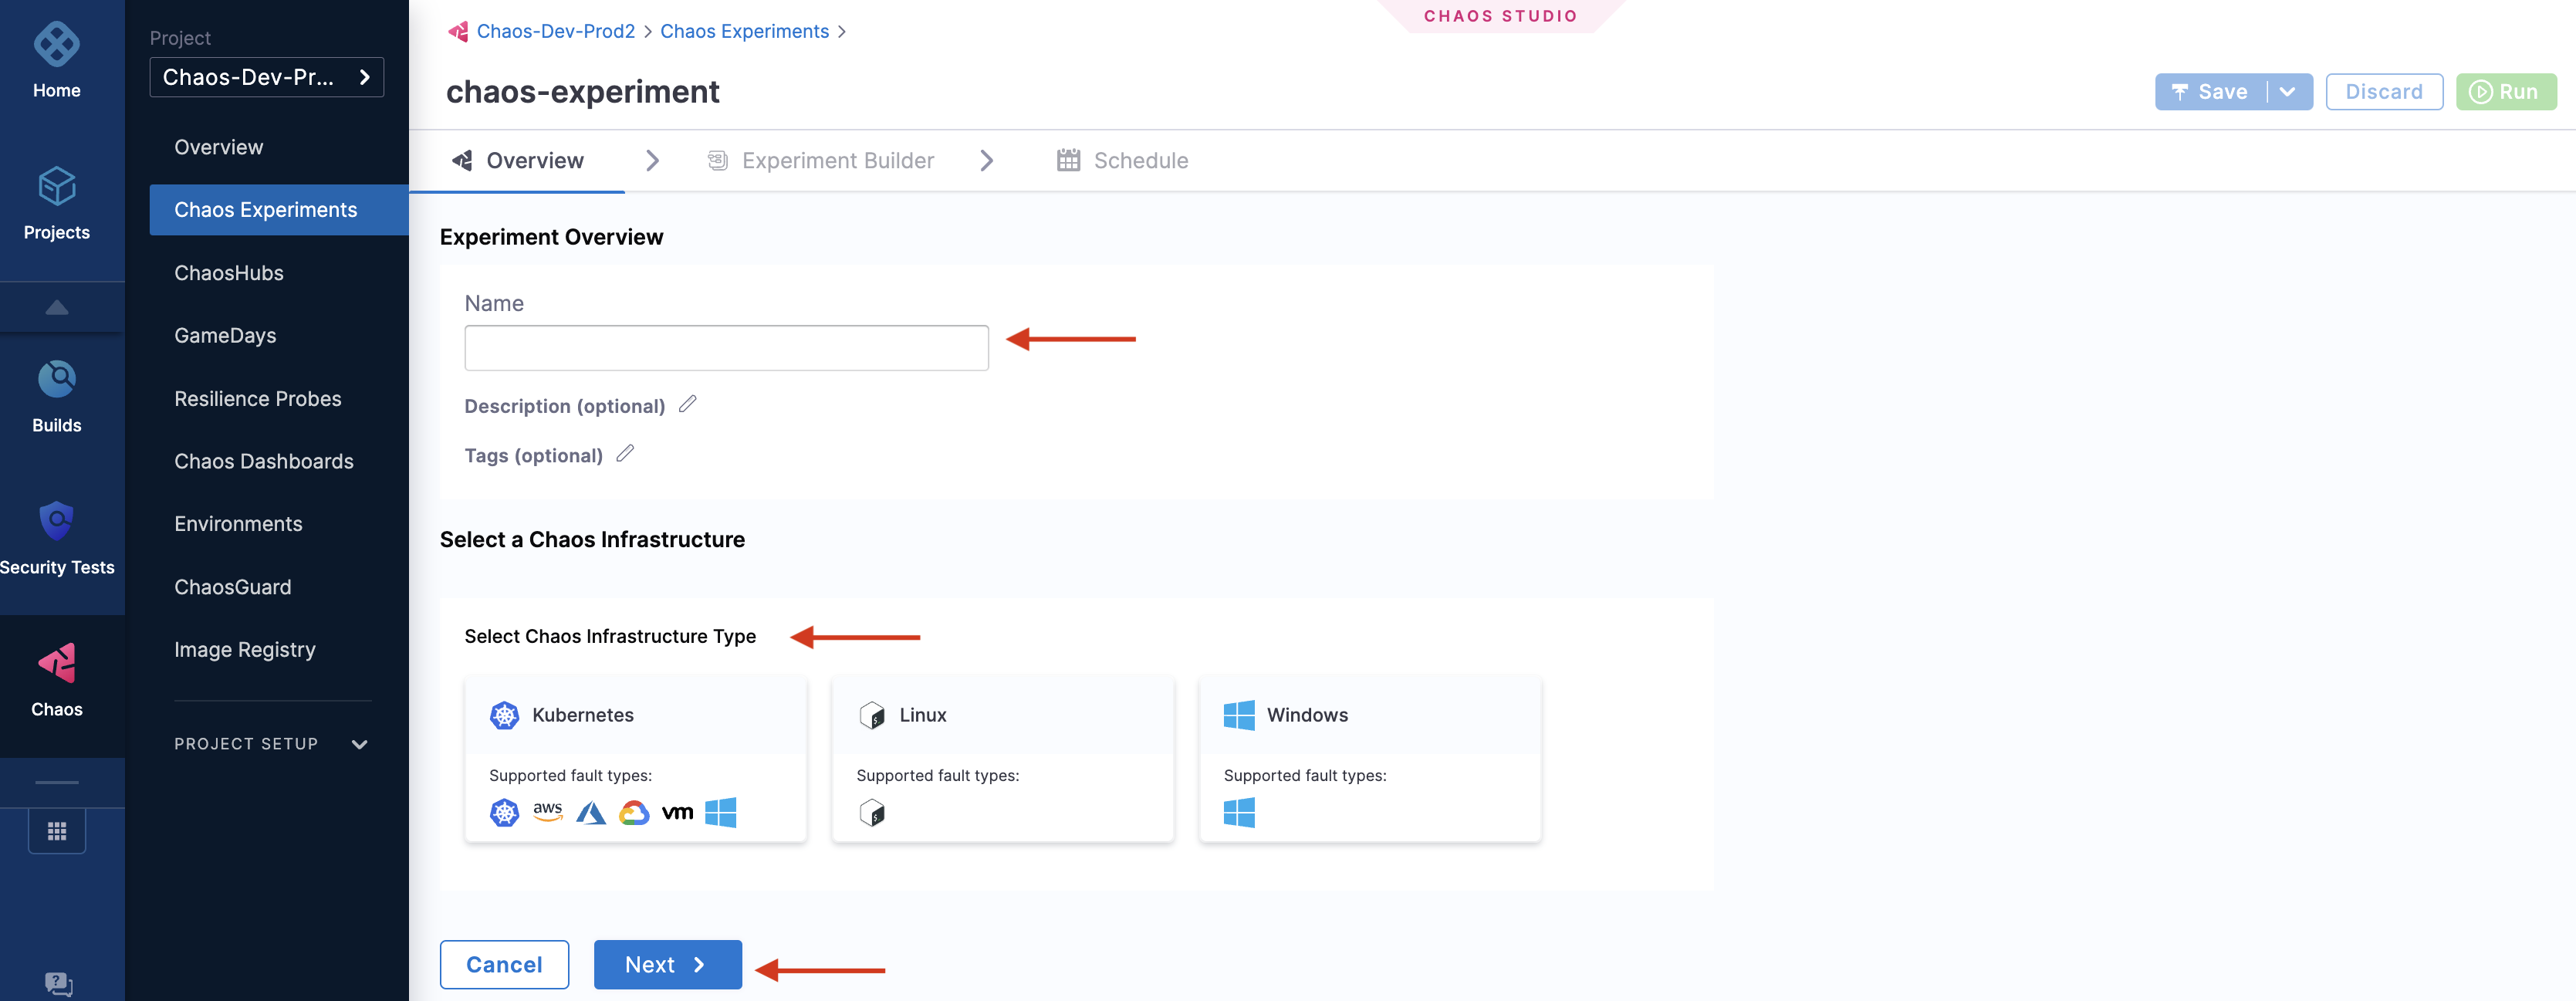
- To create a chaos experiment, go to Chaos Experiments page and select New Experiment.
- Specify the experiment name and a description (optional) and tags (optional). Choose the target infrastructure that you created earlier, click Apply, and click Next.
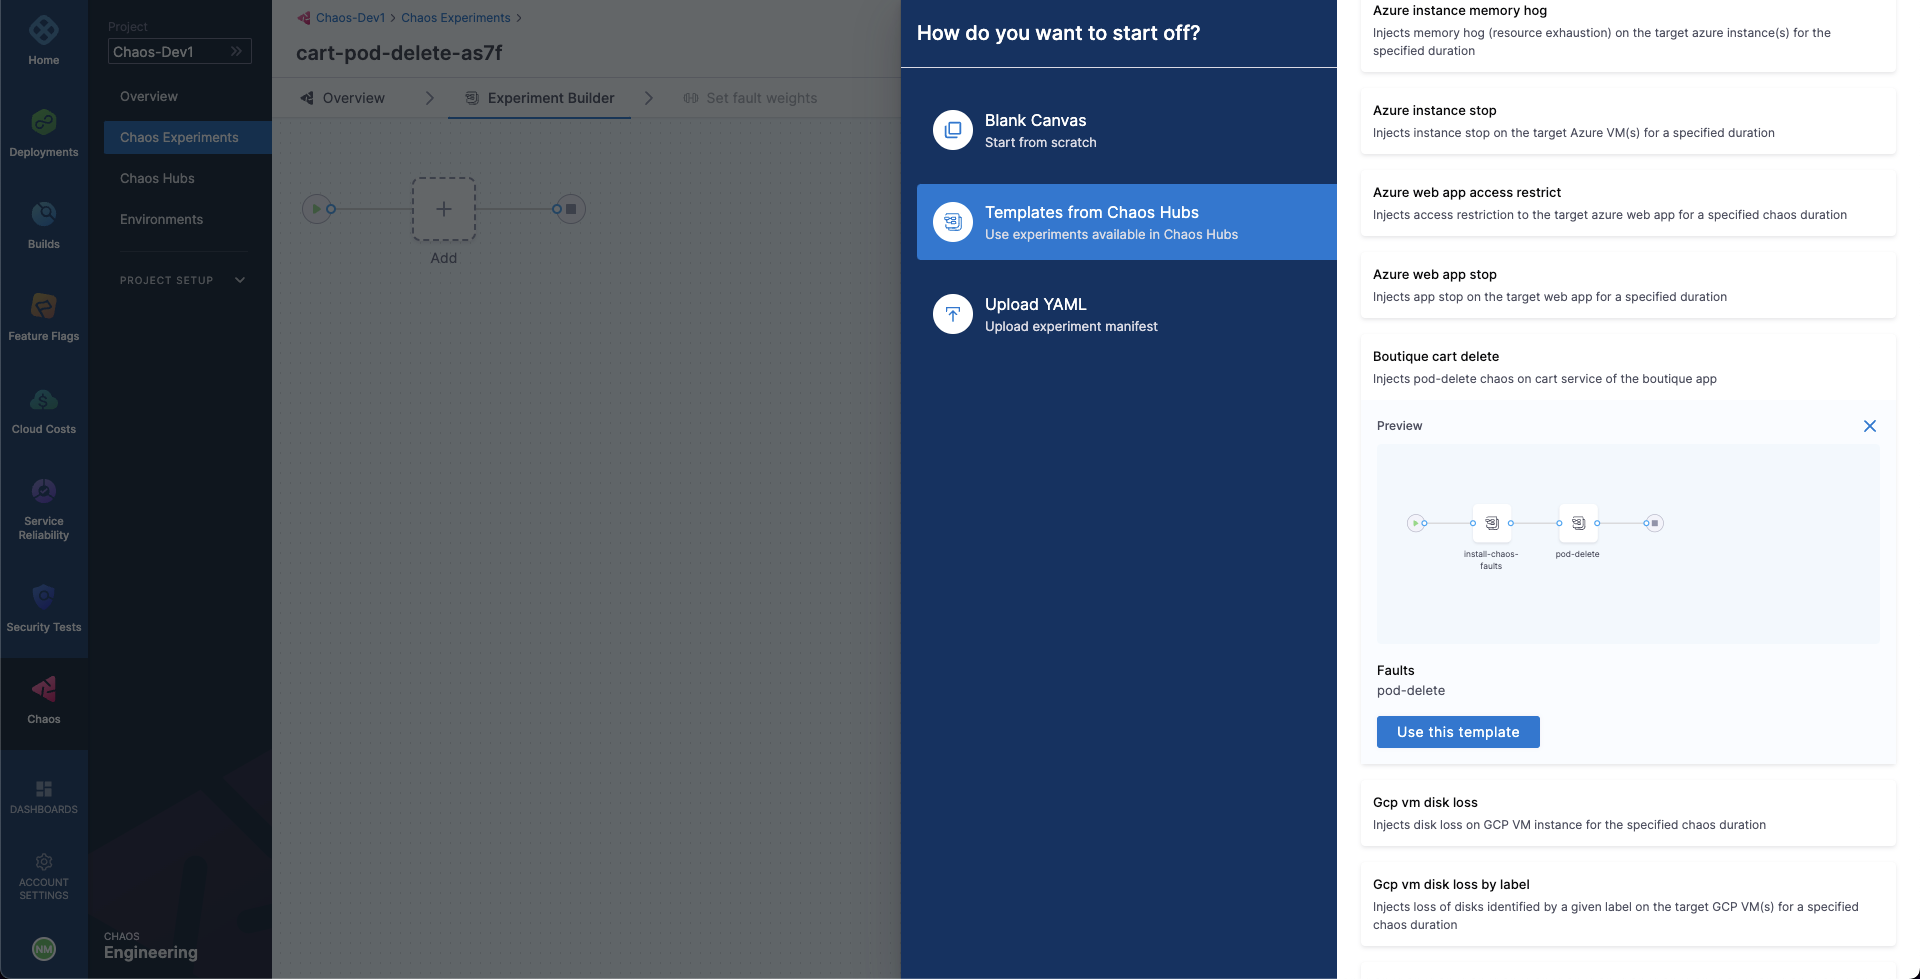
- In the Experiment Builder, choose Templates from Chaos Hubs and select Boutique cart delete. This allows you to create a chaos experiment using a pre-defined template that already has a pod delete chaos fault configured to target the online boutique application. Select Use this template to continue.
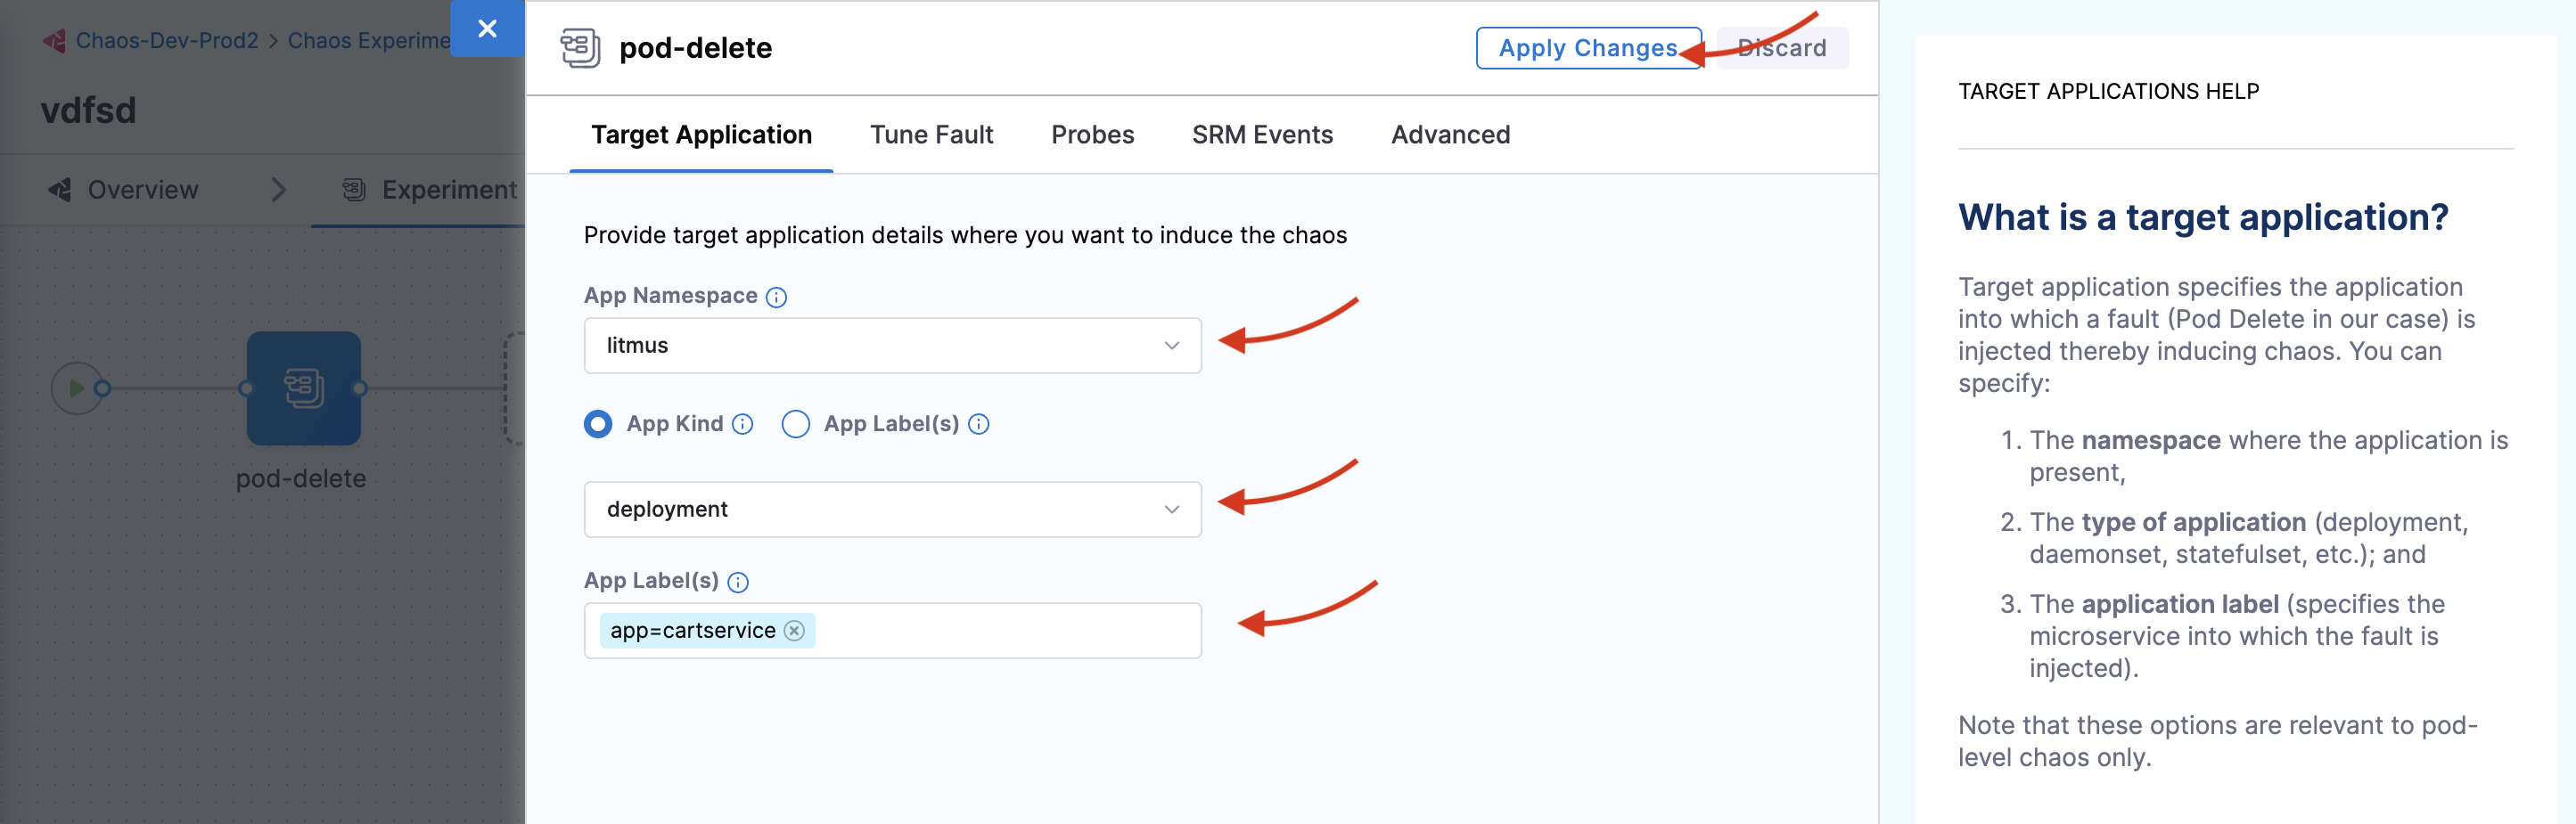
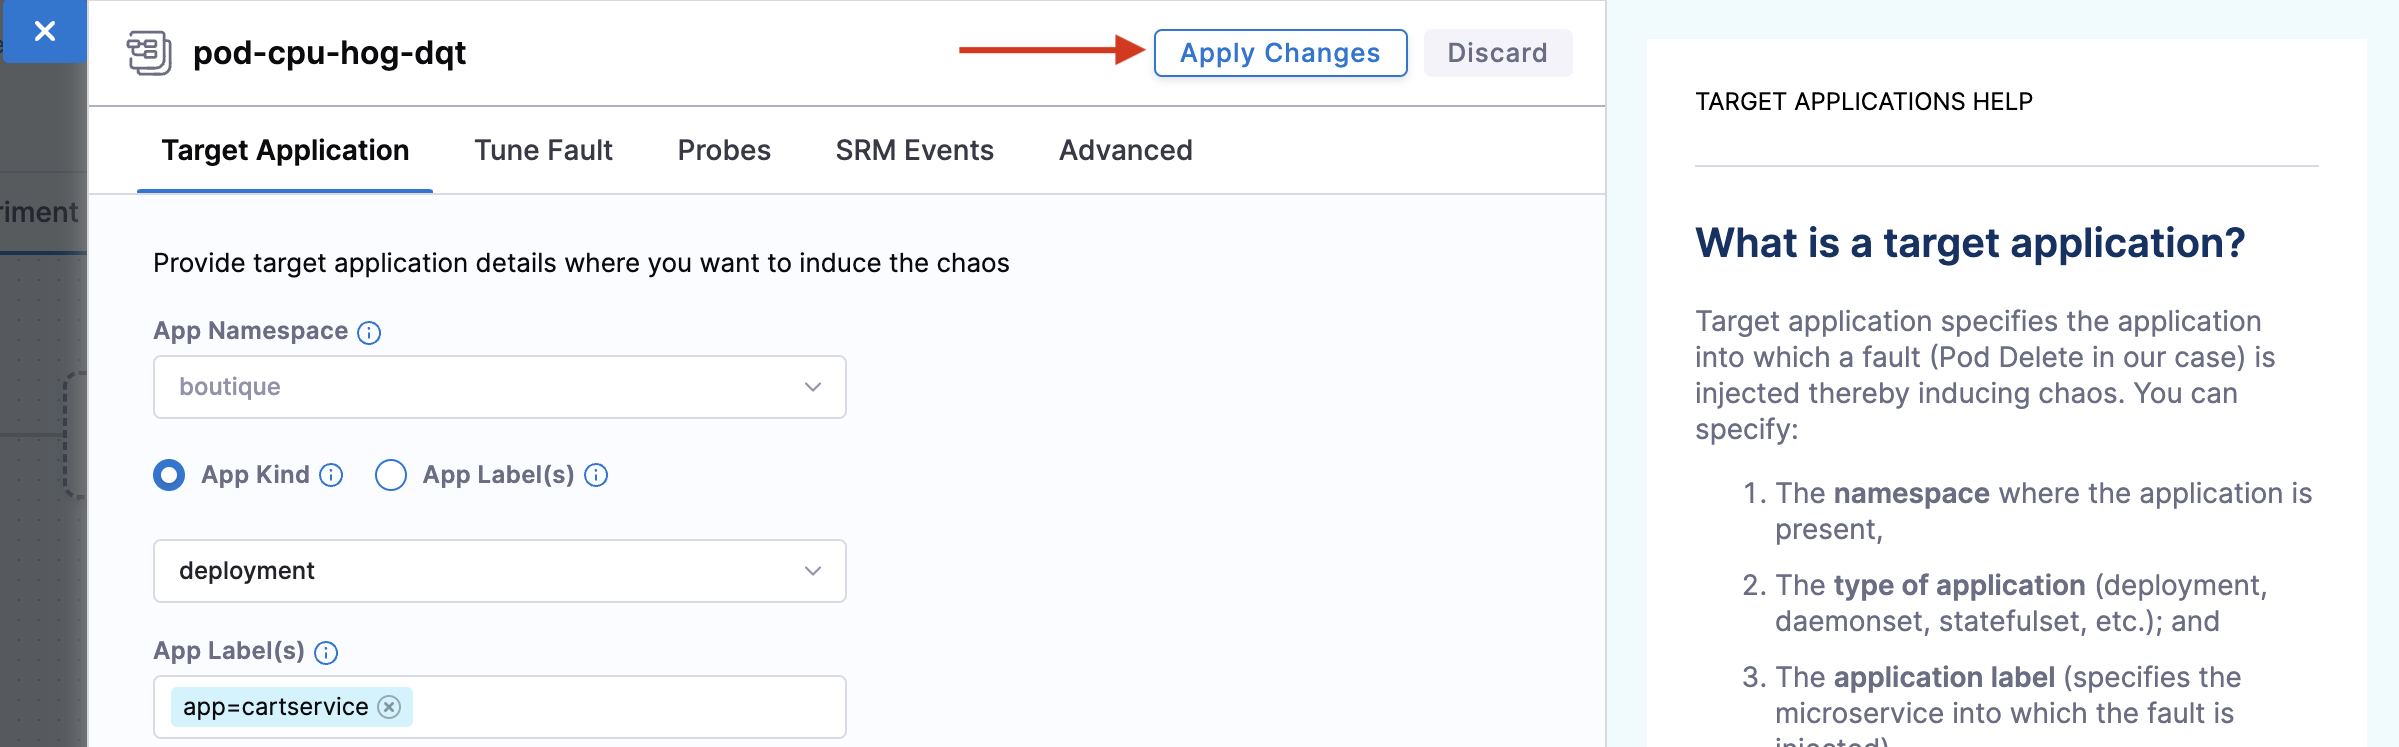
- Your target is the
cartsmicroservice. Hence the appropriatehceapplication namespace and theapp=cartserviceapplication label have been provided here. Also, the application kind isdeployment. You can discover these entities from within the UI using the search dropdown menu for the respective inputs.
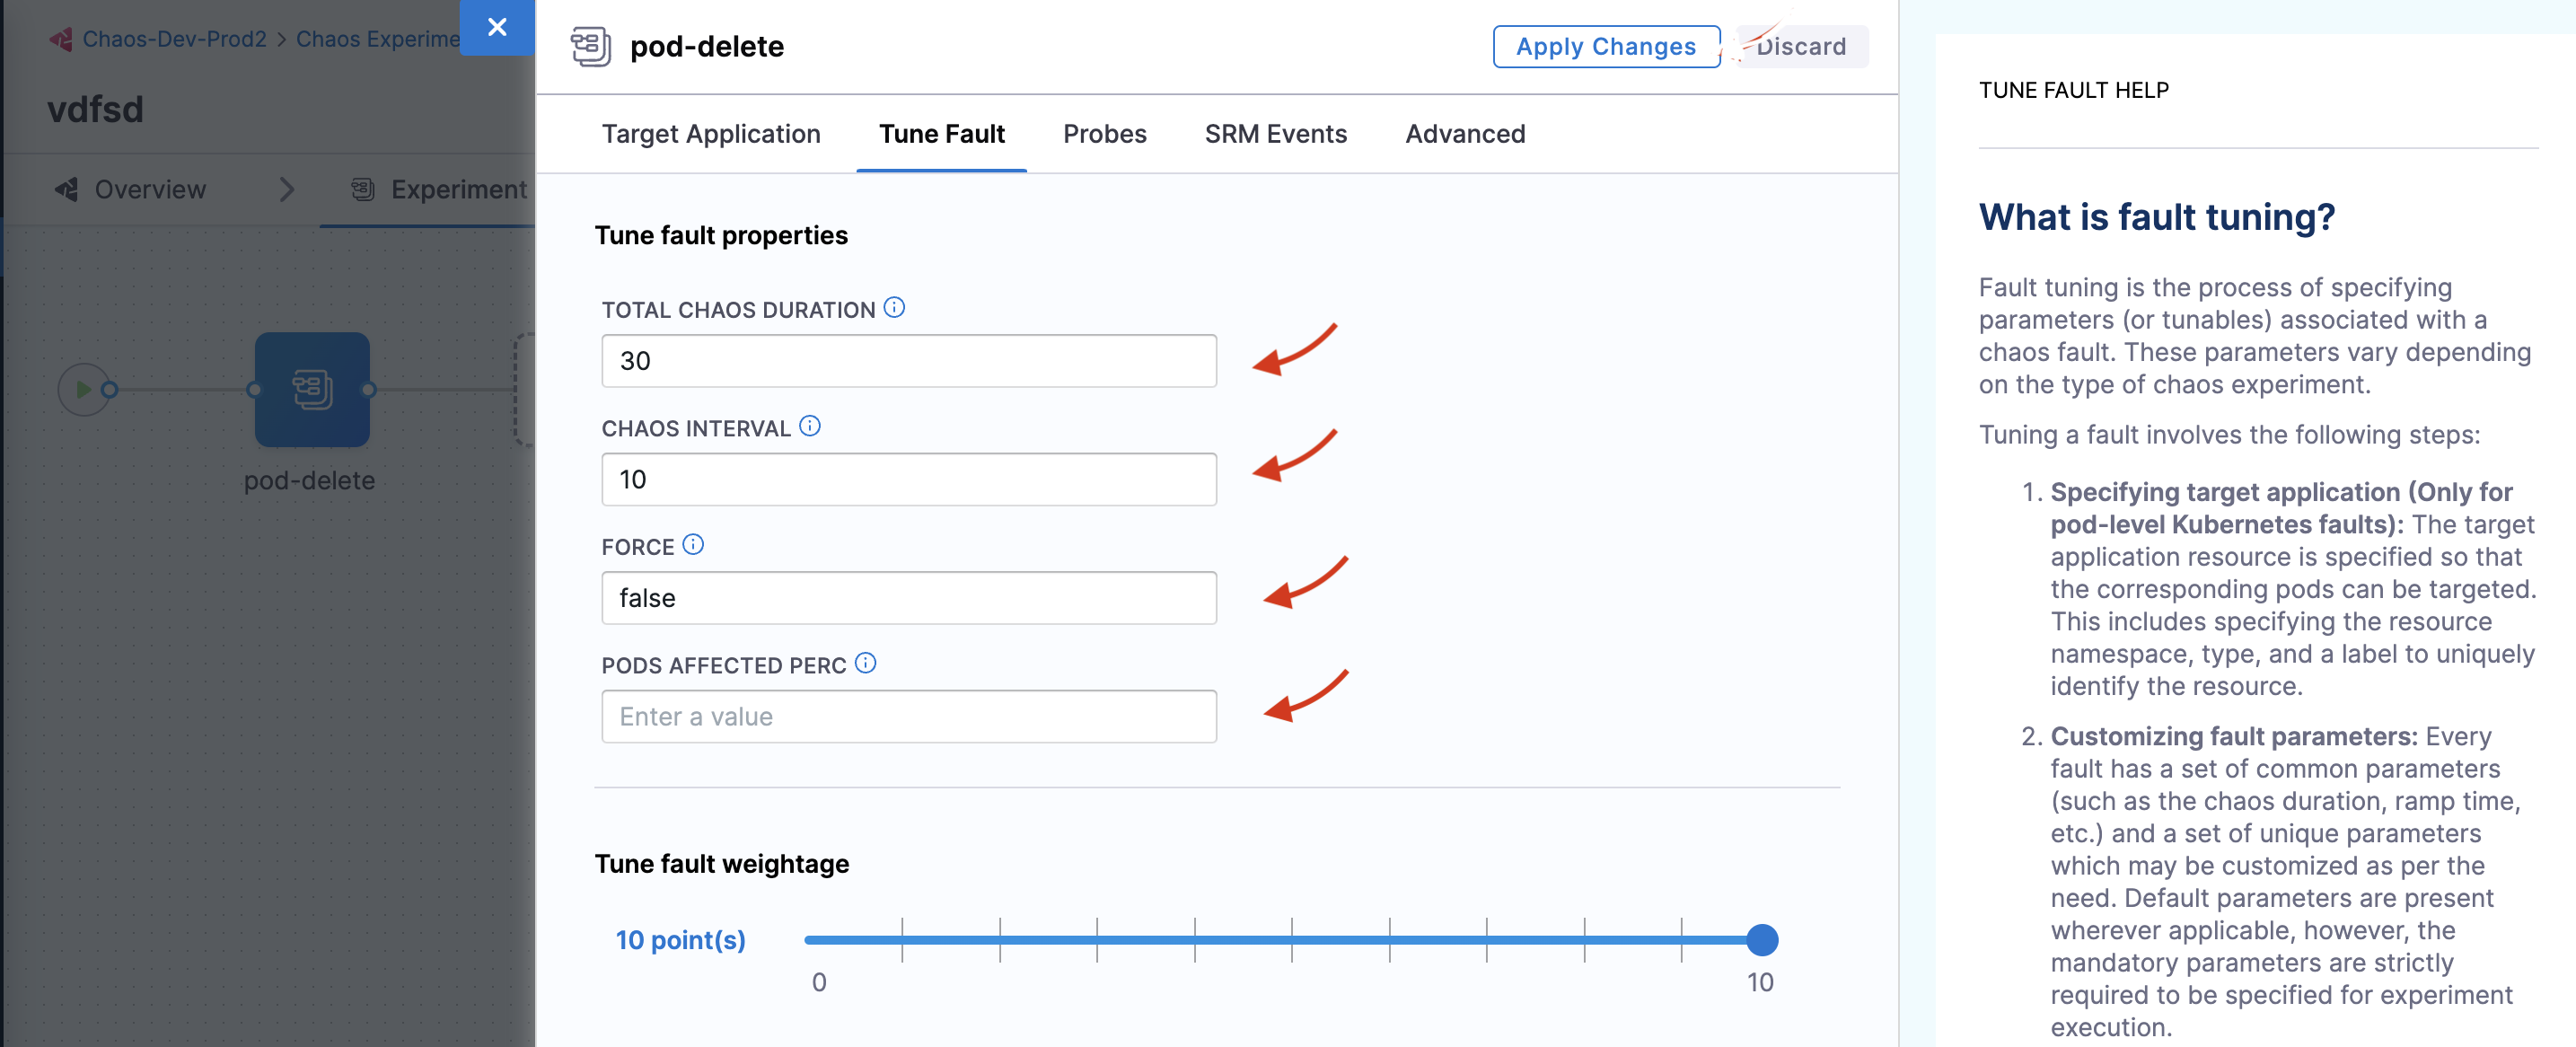
- Choose the Tune Fault tab to view the fault parameters. Here, you can tune the fault parameters. Set Total Chaos Duration to 30, Chaos Interval to 10, and Force to
false. You can leave the Pods affected perc empty for now. The values forTotal Chaos DurationandChaos Intervalindicate that for every value of 10 seconds, the cart microservice pod(s) are deleted for a total of 30 seconds. By default, at least one pod of the cart deployment is targeted.
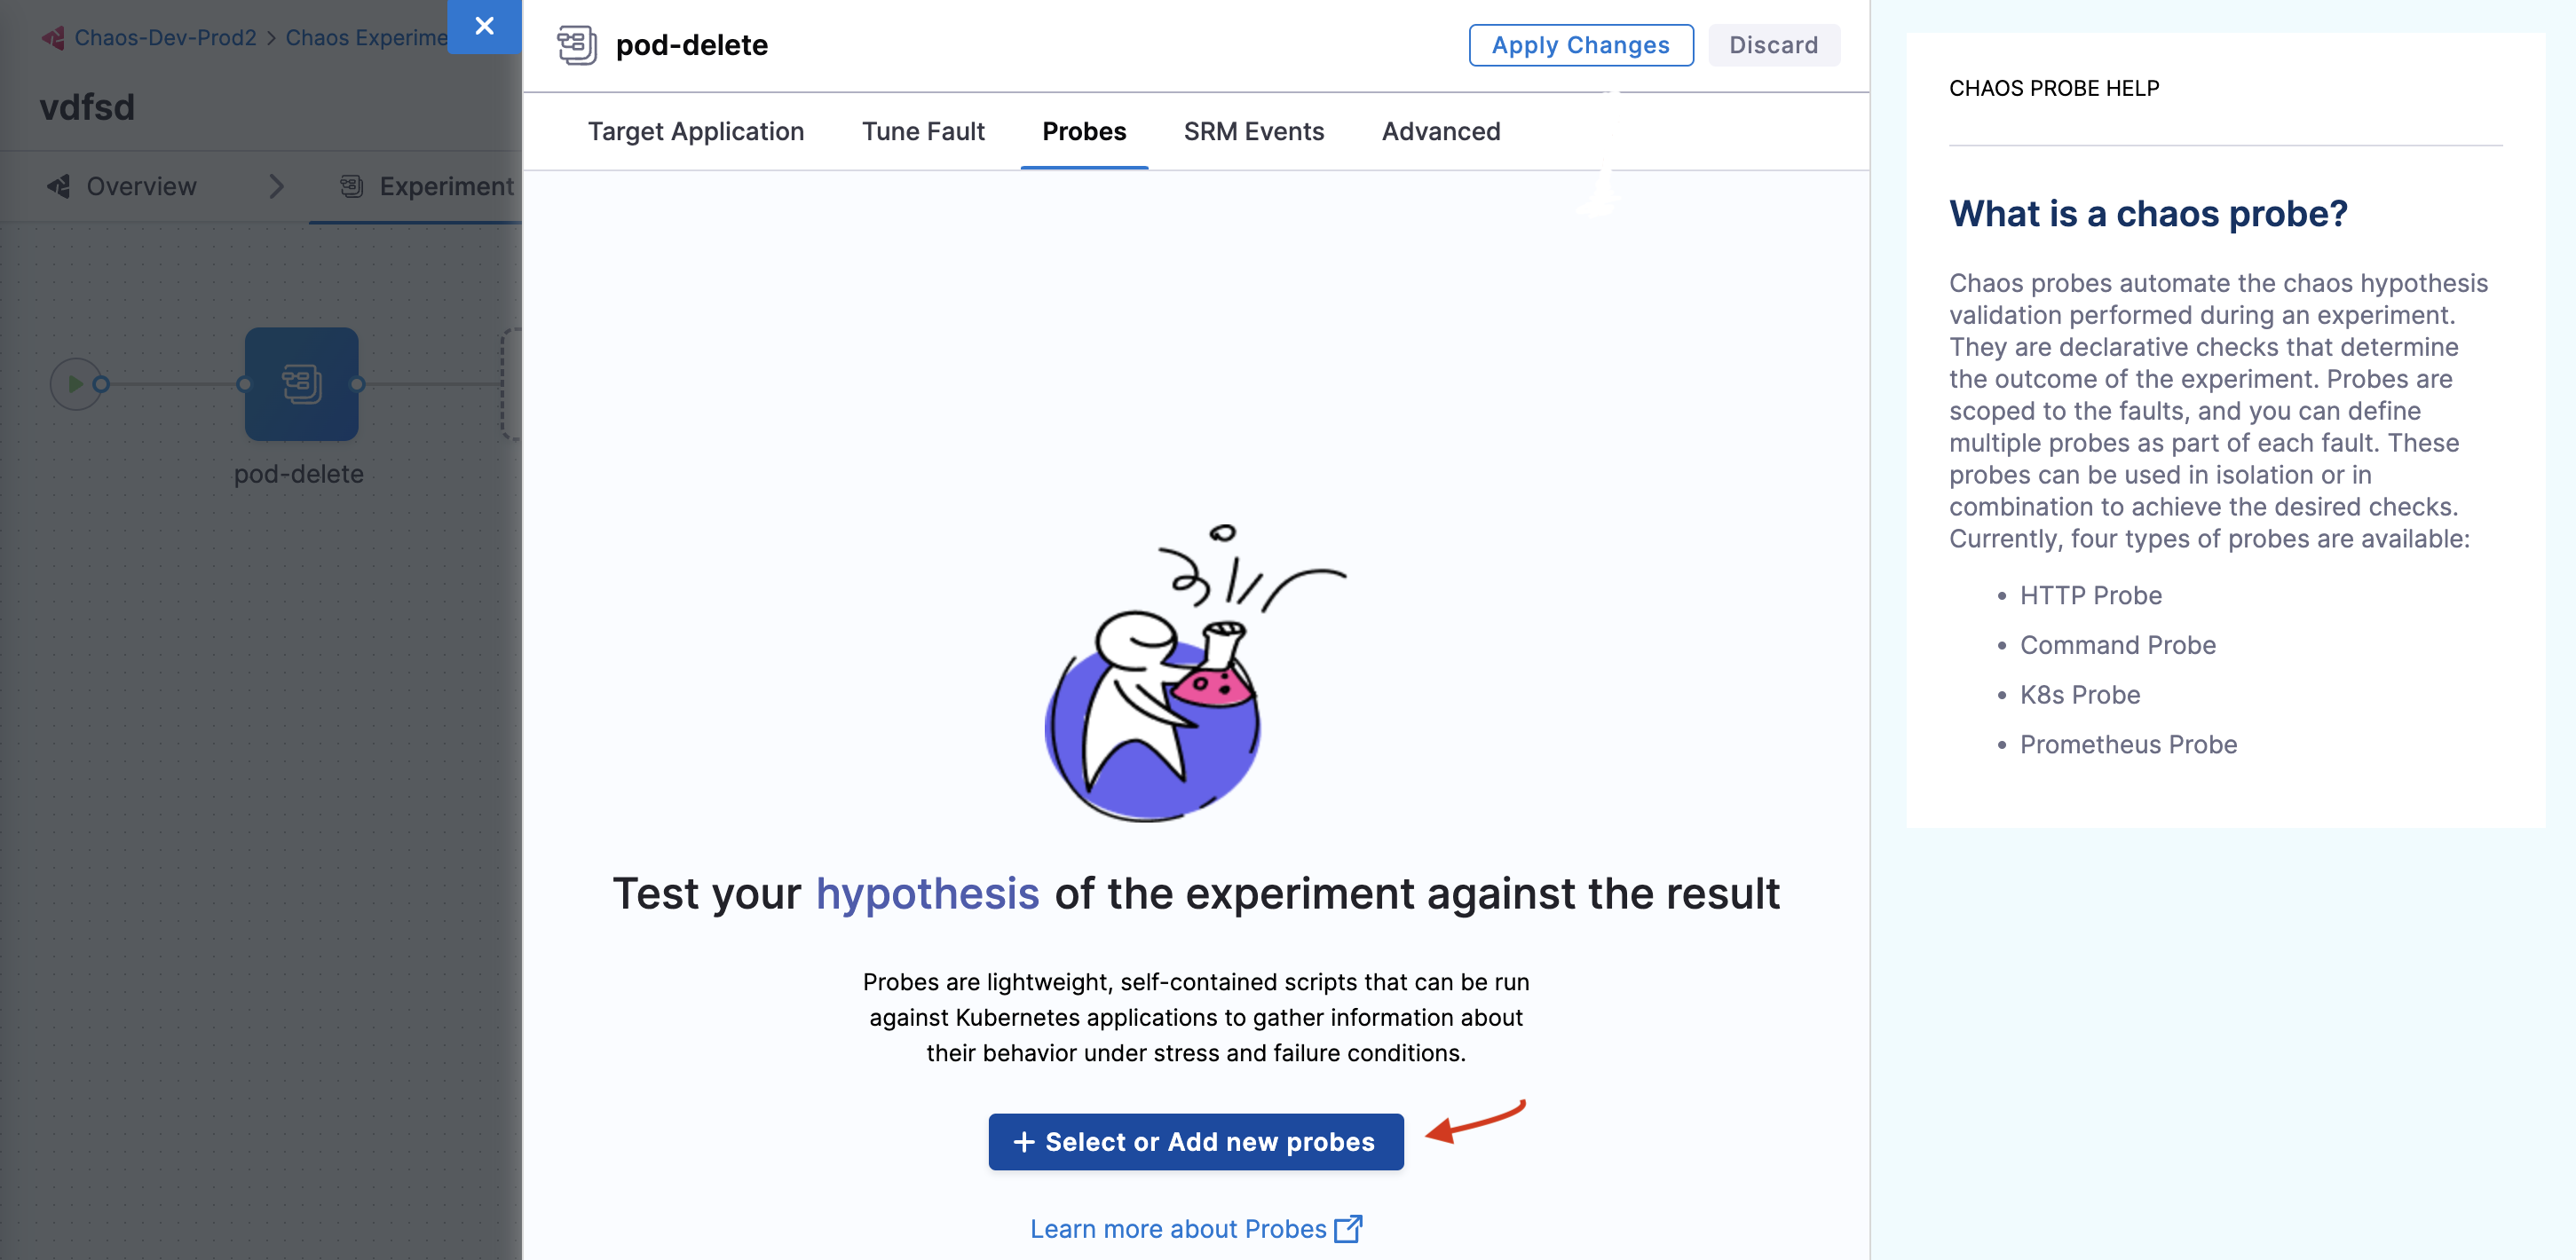
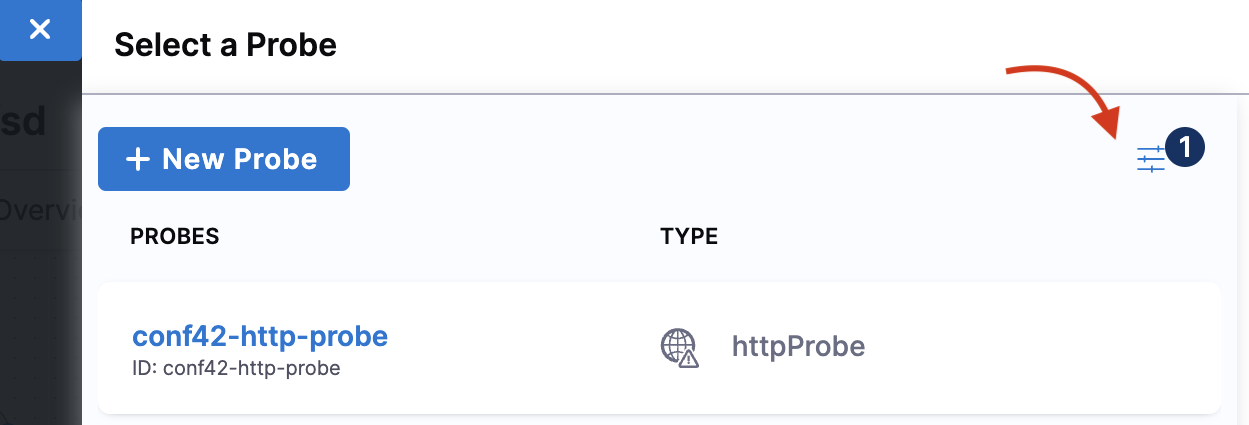
- Navigate to the Probes tab. Here, you can either create a probe or select a pre-defined probe. Click Select or Add new probes. In this tutorial, you can select a pre-defined probe and add it to your chaos fault.
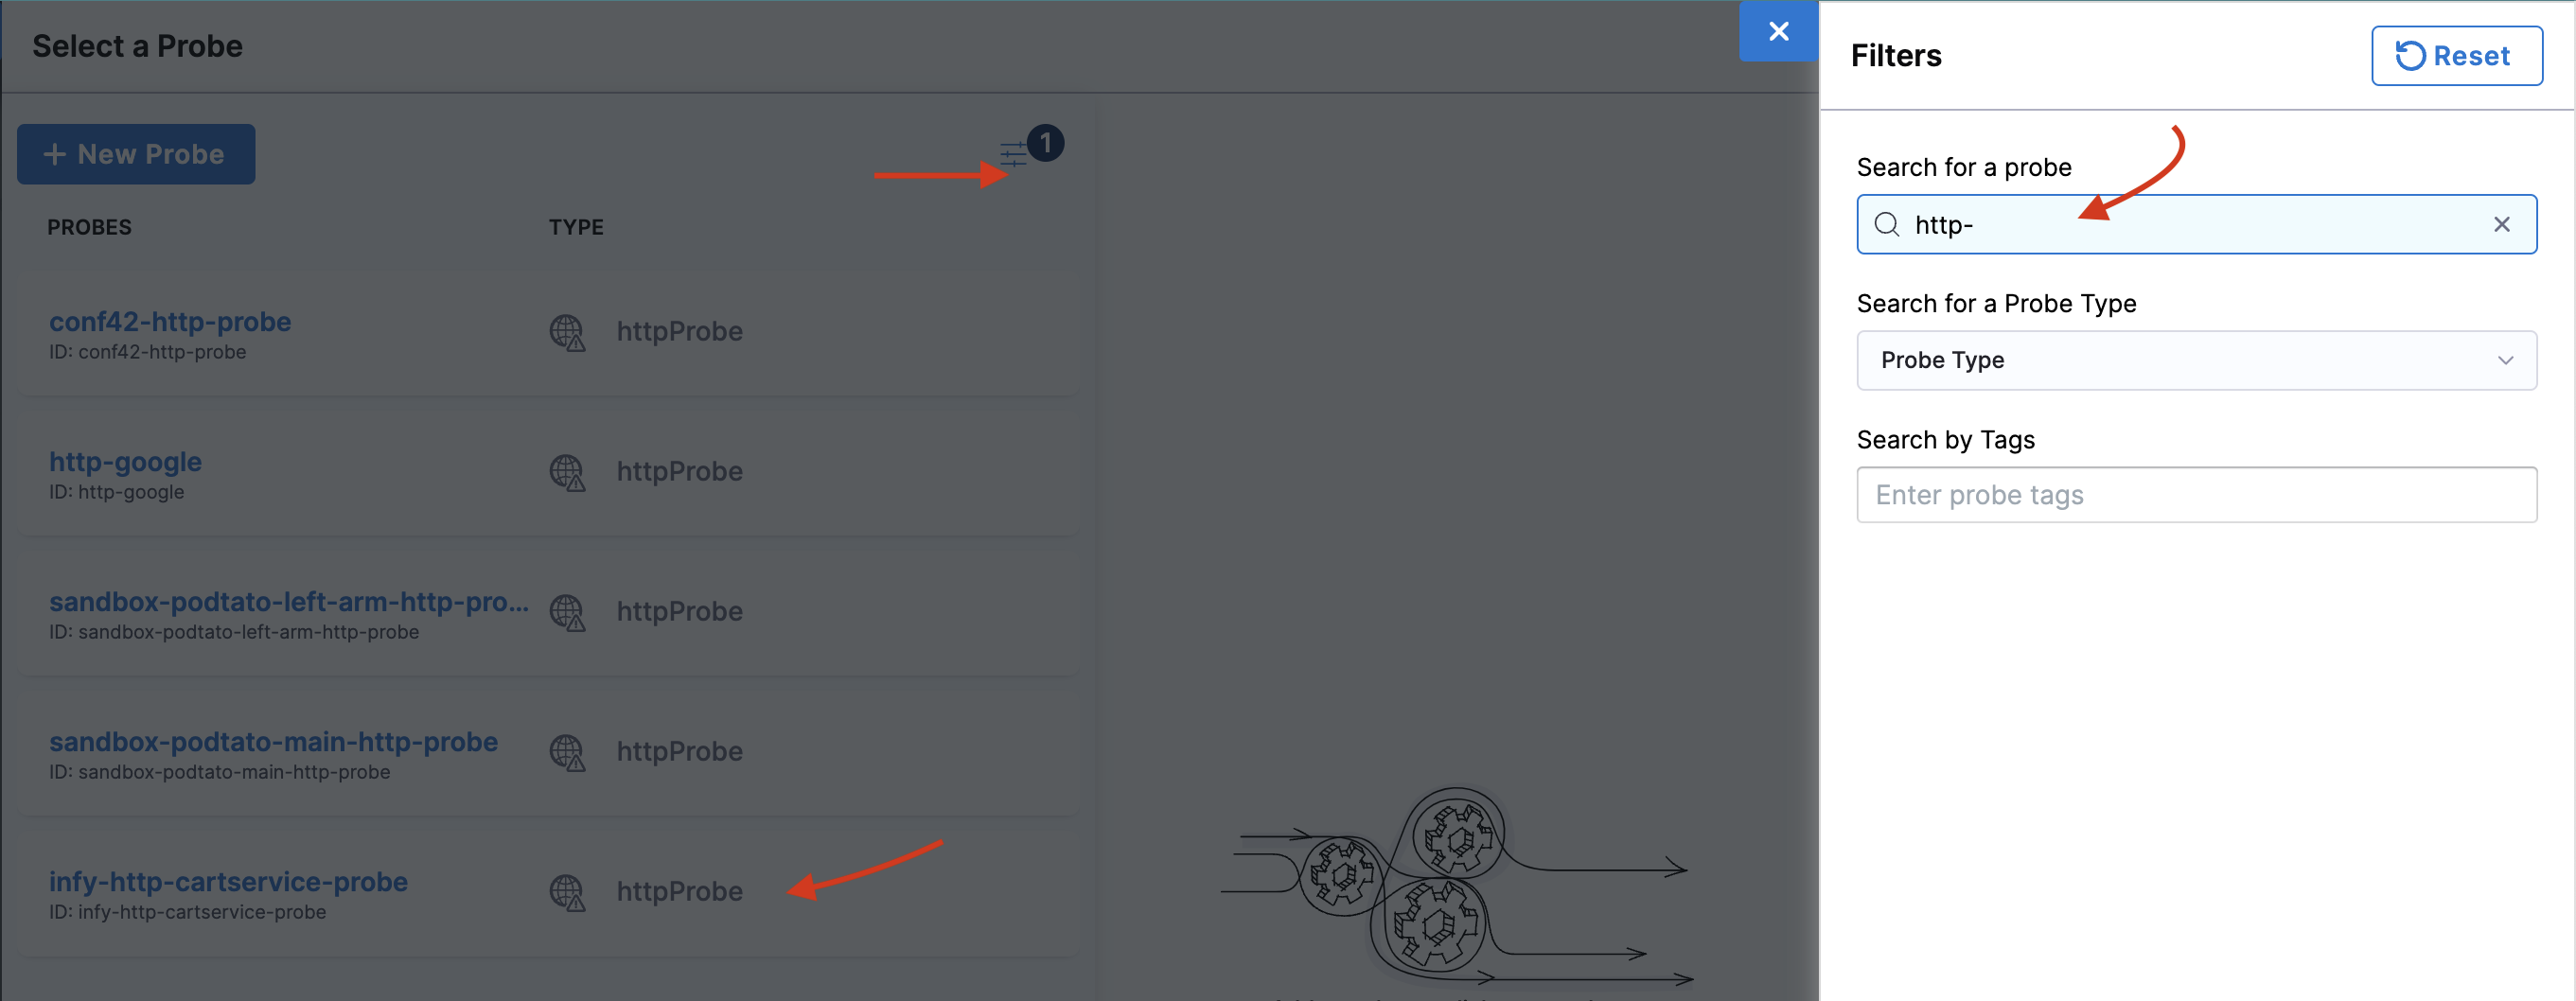
- To add a pre-defined probe to your chaos experiment, click the filter button and search for
http-cartservice. Thiscartservicevalidates the availability of the/cartURL endpoint when you execute the pod delete fault.
- Click Add to Fault.
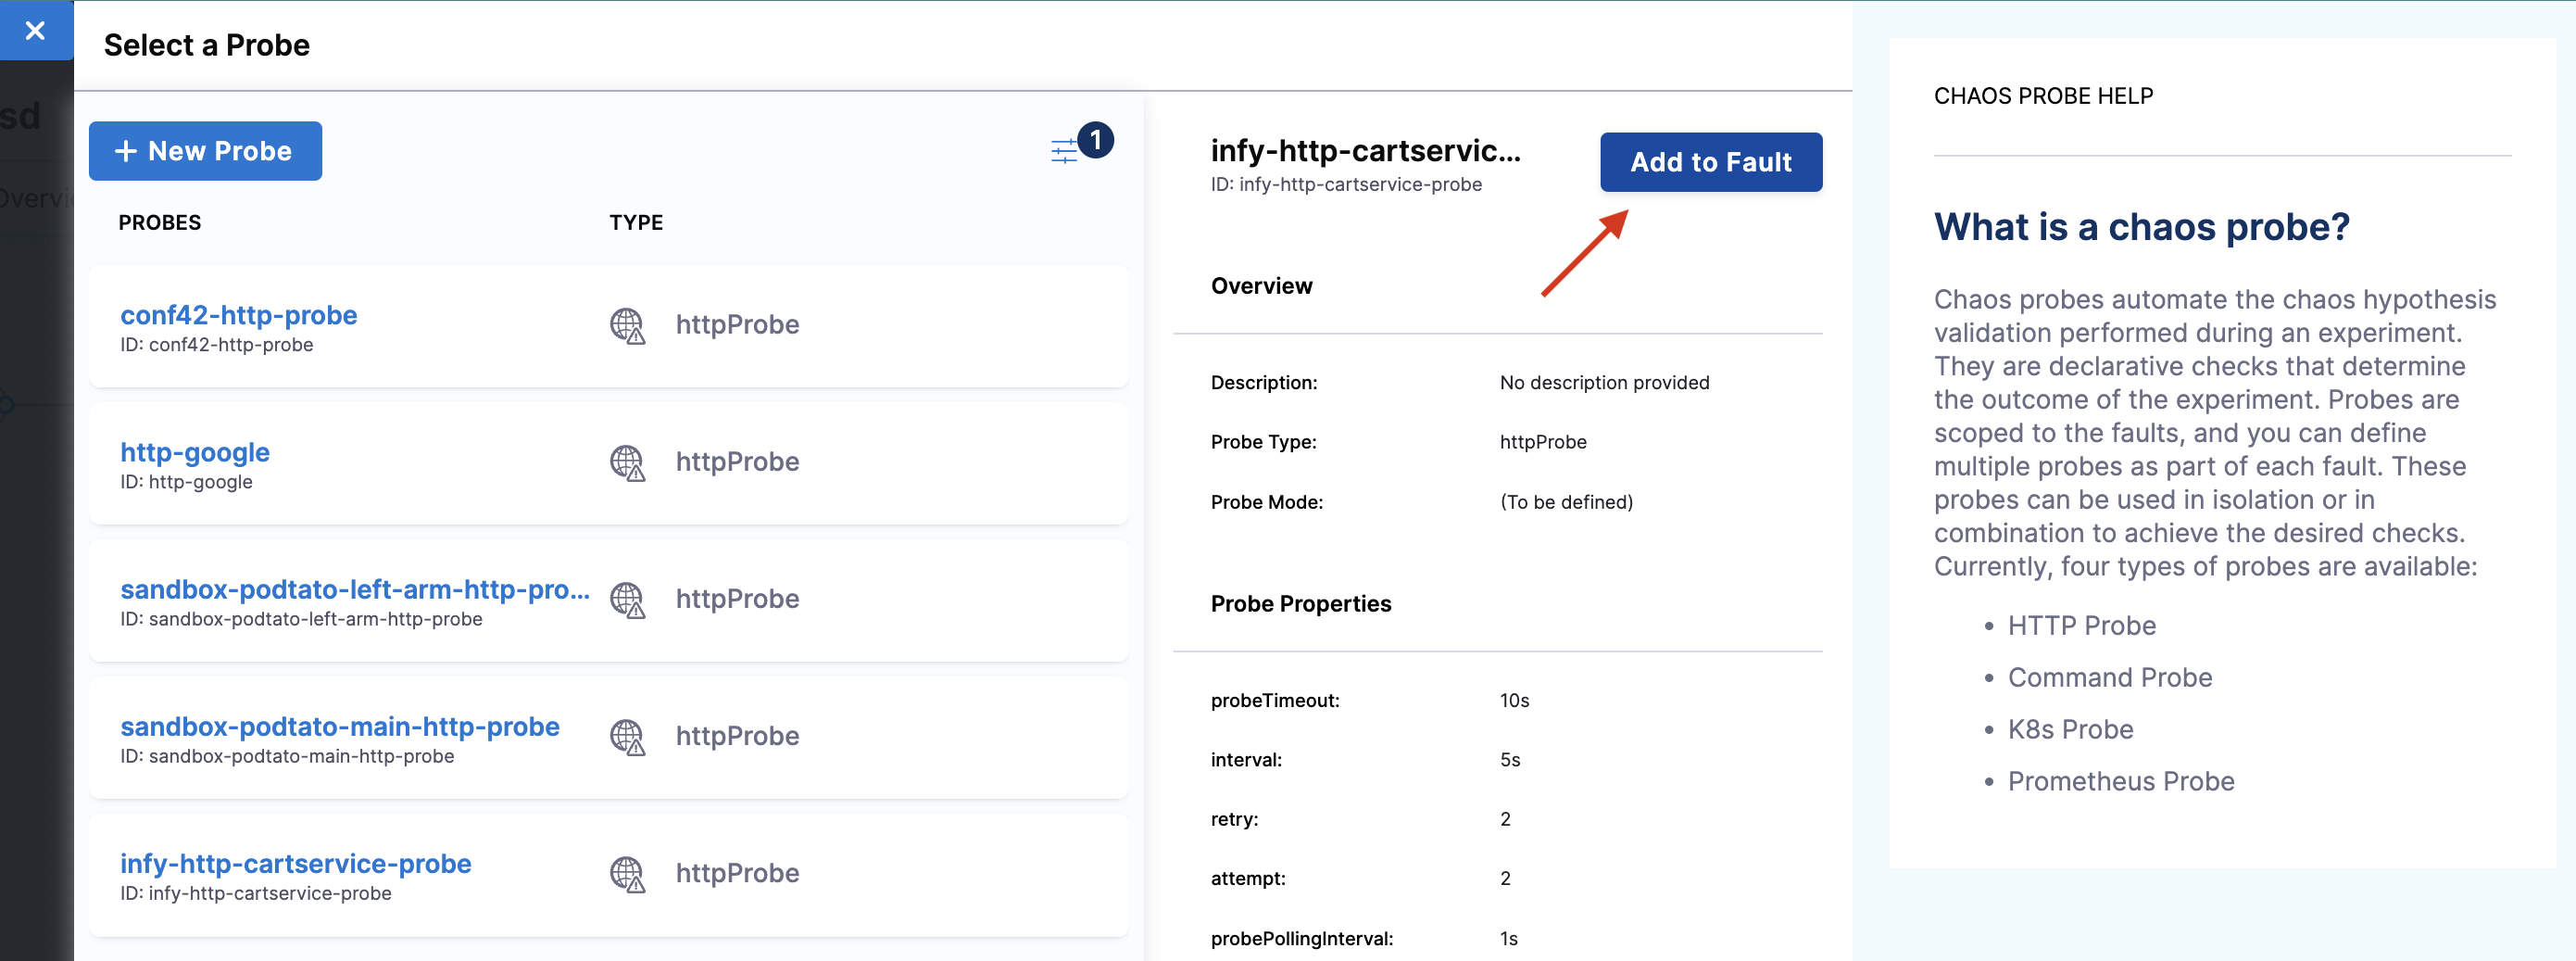
Under probe details, you can see that the URL is http://frontend/cart and the response timeout is 15 ms. As a part of the probe execution, GET requests are made to the specified URL. If no HTTP response is found within 15 ms, the probe status is considered as 'failed'. If all the probe executions pass, then the probe status is considered as 'passed'. You can find other probe details in the properties field.
- Select mode as Continuous. Click Apply changes.
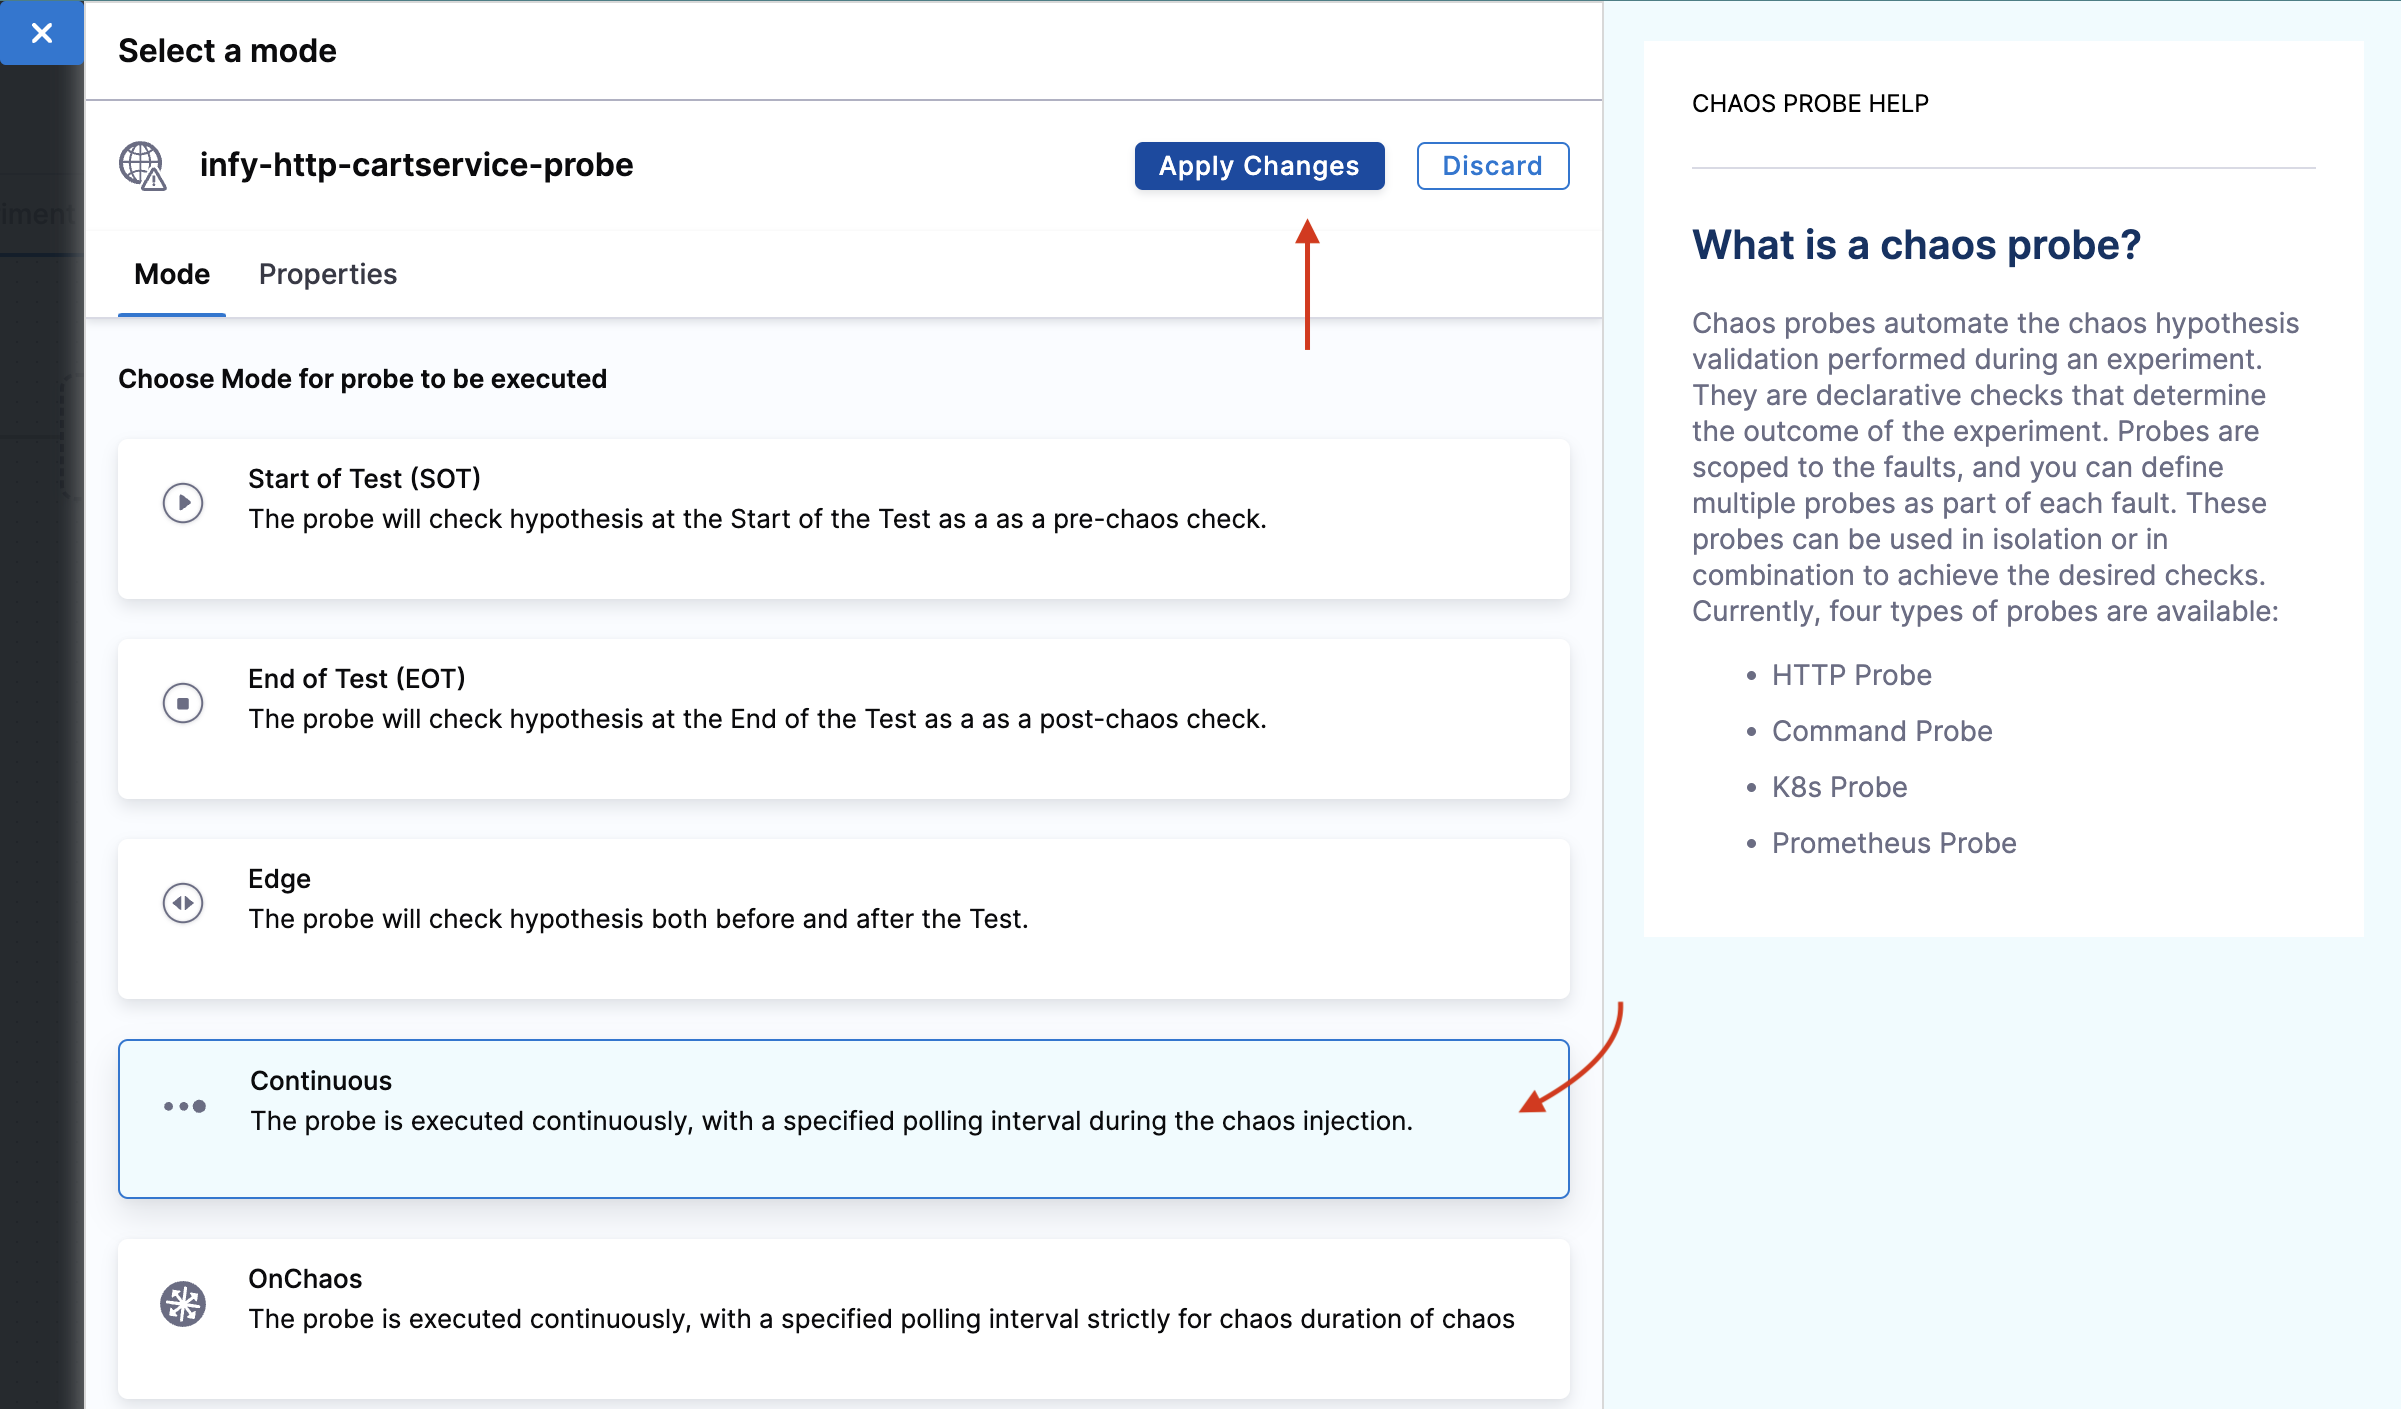
- This will close the probes tab, and now, you can click Apply changes to apply the configuration to the chaos experiment.
Step 6: Observing chaos execution
- To execute the chaos experiment, click Save, and then Run.
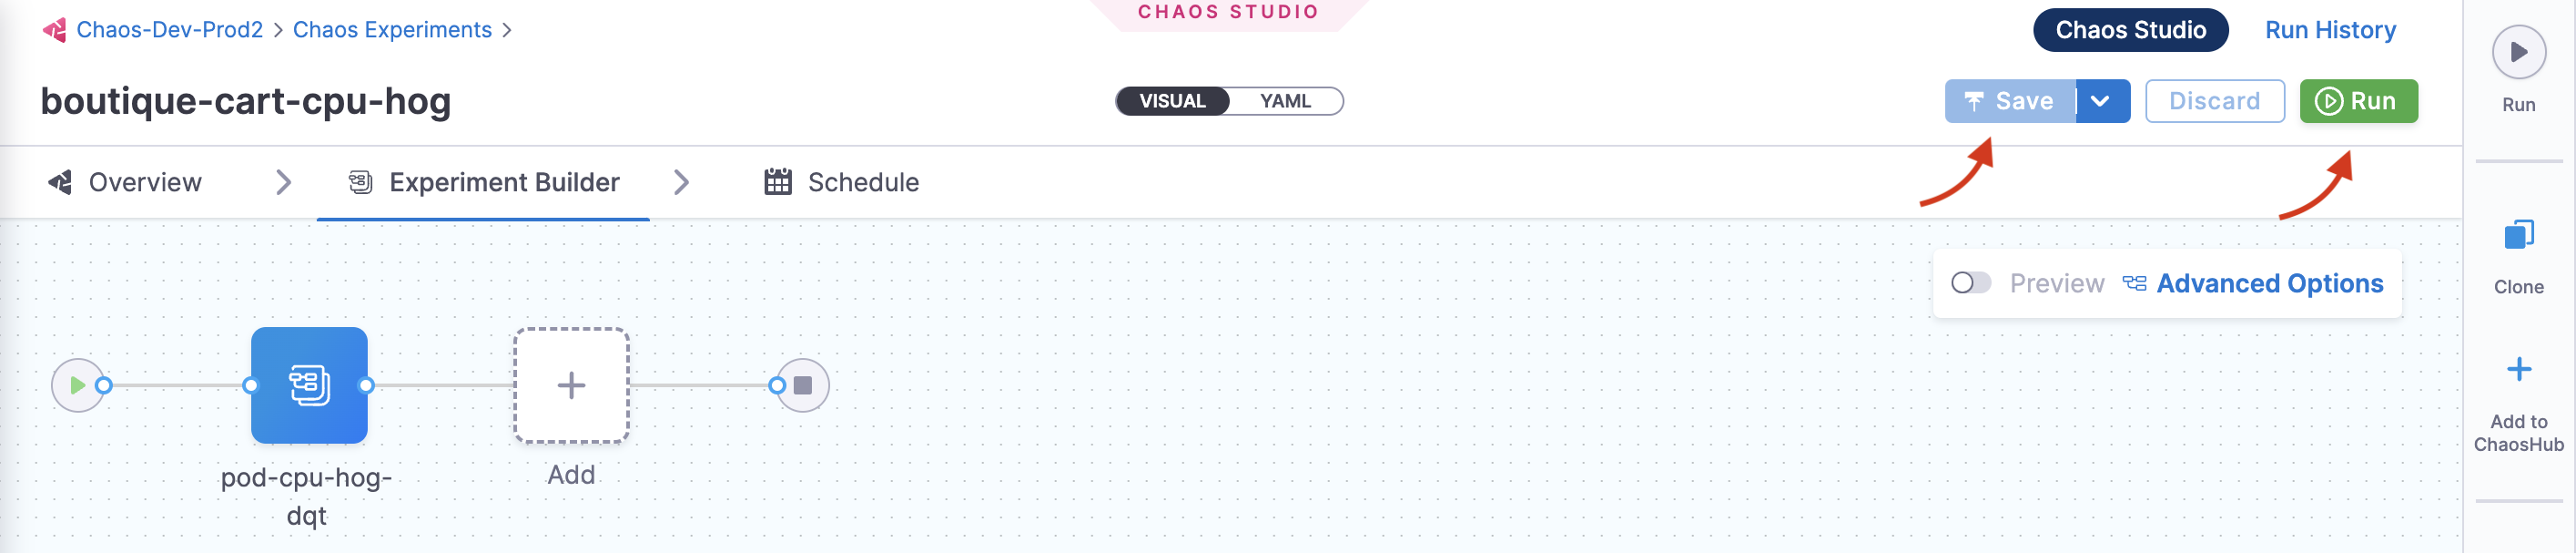
- You can see that once you click Run, an experiment run is scheduled. You can see the status of every step in the tab.
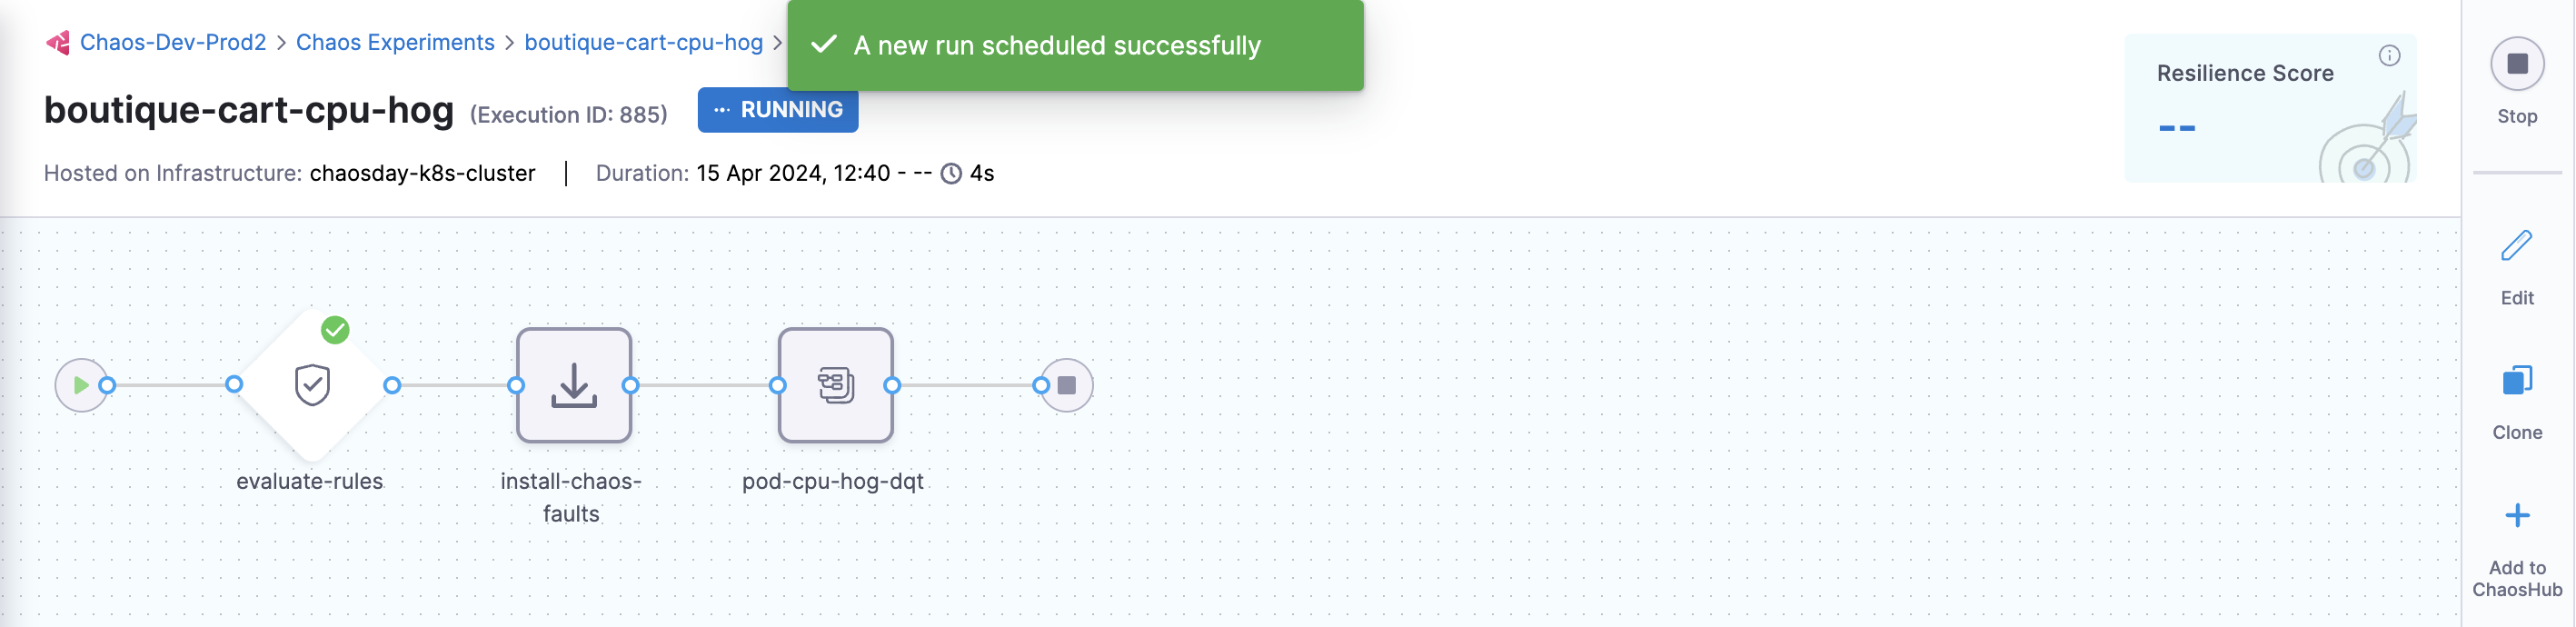
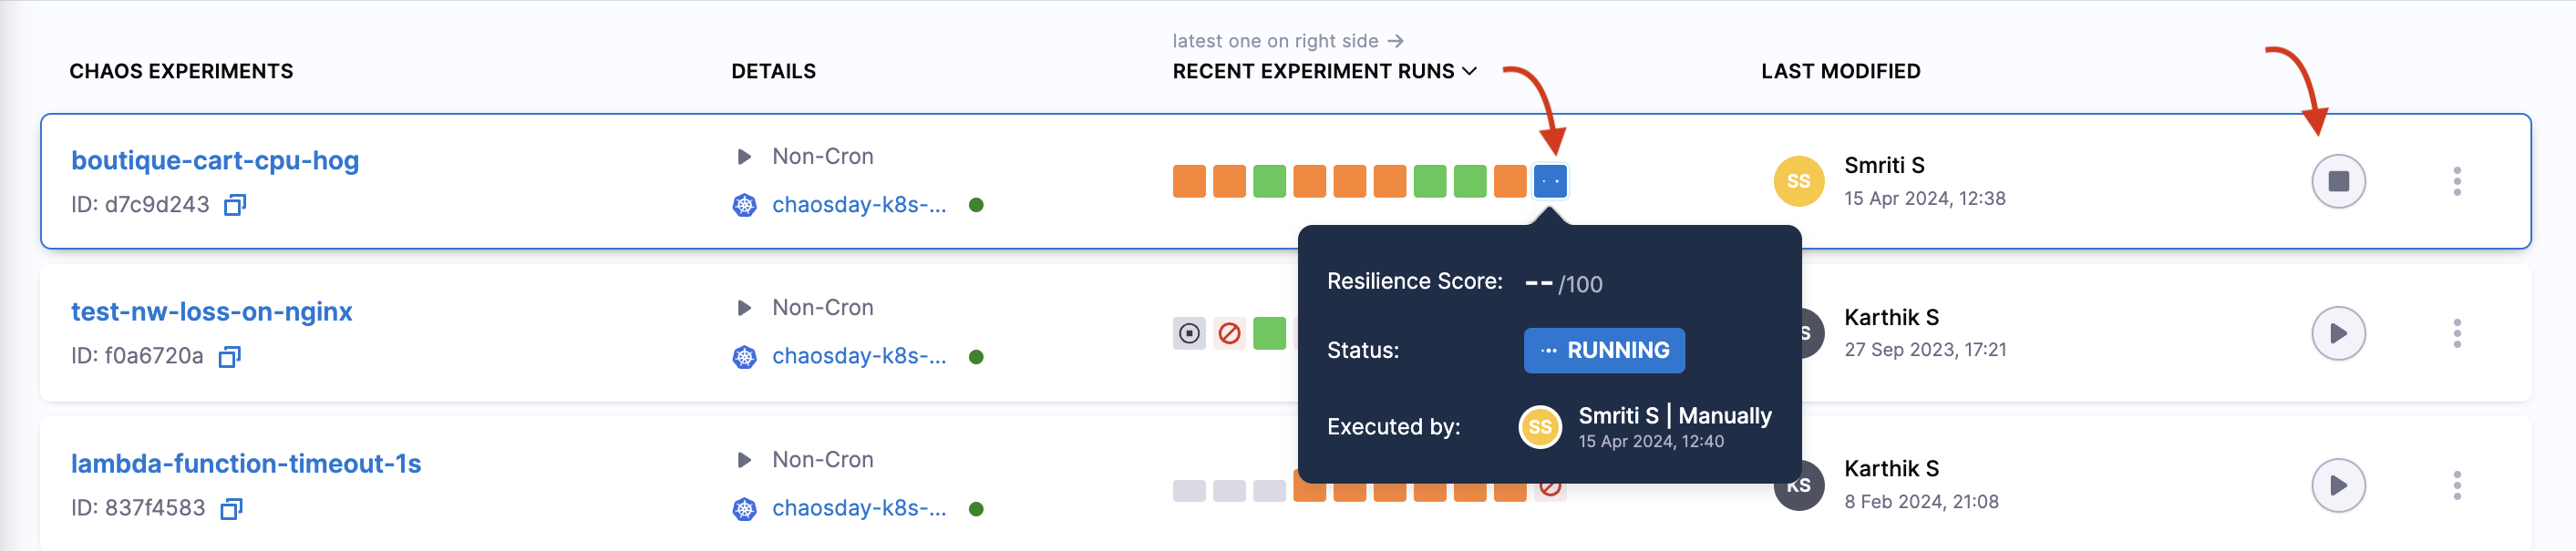
- Select Recent experiment runs to view the runs of an experiment. The latest experiment is displayed in the last bar with the status as
RUNNING.
- To check the status of the cart deployment pod, execute the command below. The pod delete fault terminates the cart pod and replaces it with a new pod, for which a container is yet to be created.
❯ kubectl get pods -n hce

NAME                                           READY   STATUS    RESTARTS       AGE
adservice-68db567bb5-hd47j                     1/1     Running   0              5h41m
cartservice-6b8f46f64f-lkgs8                   0/1     Running   0              29s
chaos-exporter-765d6b6674-tkrpm                1/1     Running   0              5h41m
chaos-operator-ce-678b67c75-l68m5              1/1     Running   0              5h41m
checkoutservice-7545ff6849-rdl9f               1/1     Running   0              5h41m
currencyservice-5769b647d5-trx69               1/1     Running   0              5h41m
emailservice-55c84dcfdc-c9x9q                  1/1     Running   0              5h41m
frontend-74b7898dd9-x4bzr                      1/1     Running   0              5h41m
grafana-6f6fb469b7-bm9vh                       1/1     Running   0              5h41m
loadgenerator-5b875b84dd-pcjdr                 1/1     Running   0              5h41m
paymentservice-59d87f77bc-fkwjq                1/1     Running   0              5h41m
productcatalogservice-676d7d7dbc-nx75x         1/1     Running   0              5h41m
prometheus-blackbox-exporter-6d955c876-l7fdv   2/2     Running   0              5h41m
prometheus-deployment-779b88bf5d-zf8f9         1/1     Running   0              5h41m
recommendationservice-6fc8b4d9cf-4s96t         1/1     Running   0              5h41m
redis-cart-7cd9d8966d-mgbhx                    1/1     Running   0              5h41m
shippingservice-7b4945b5fc-cbmc9               1/1     Running   0              5h41m
subscriber-7774bd95d4-4rnwp                    1/1     Running   0              5h41m
workflow-controller-6d5d75dc7c-v9vqc           1/1     Running   0              5h41m
- As a consequence, if you try to access the frontend cart page, you will encounter the following error which indicates that the application is now unreachable.
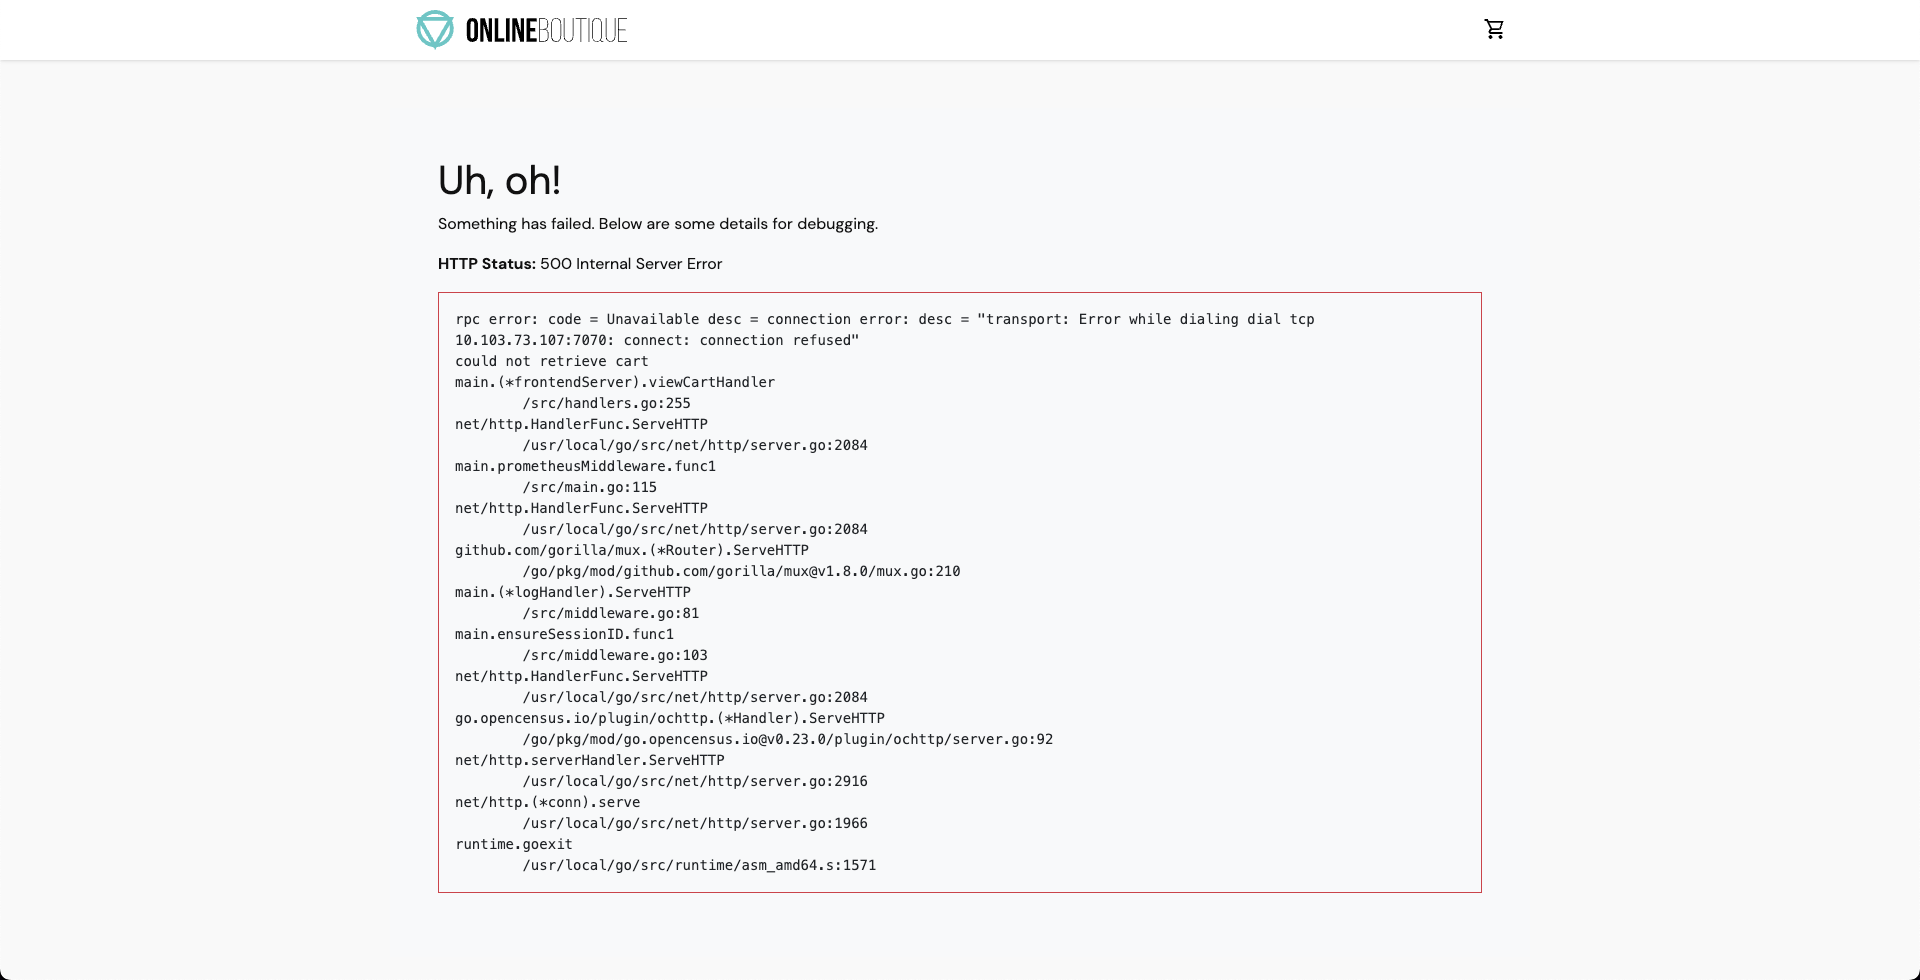
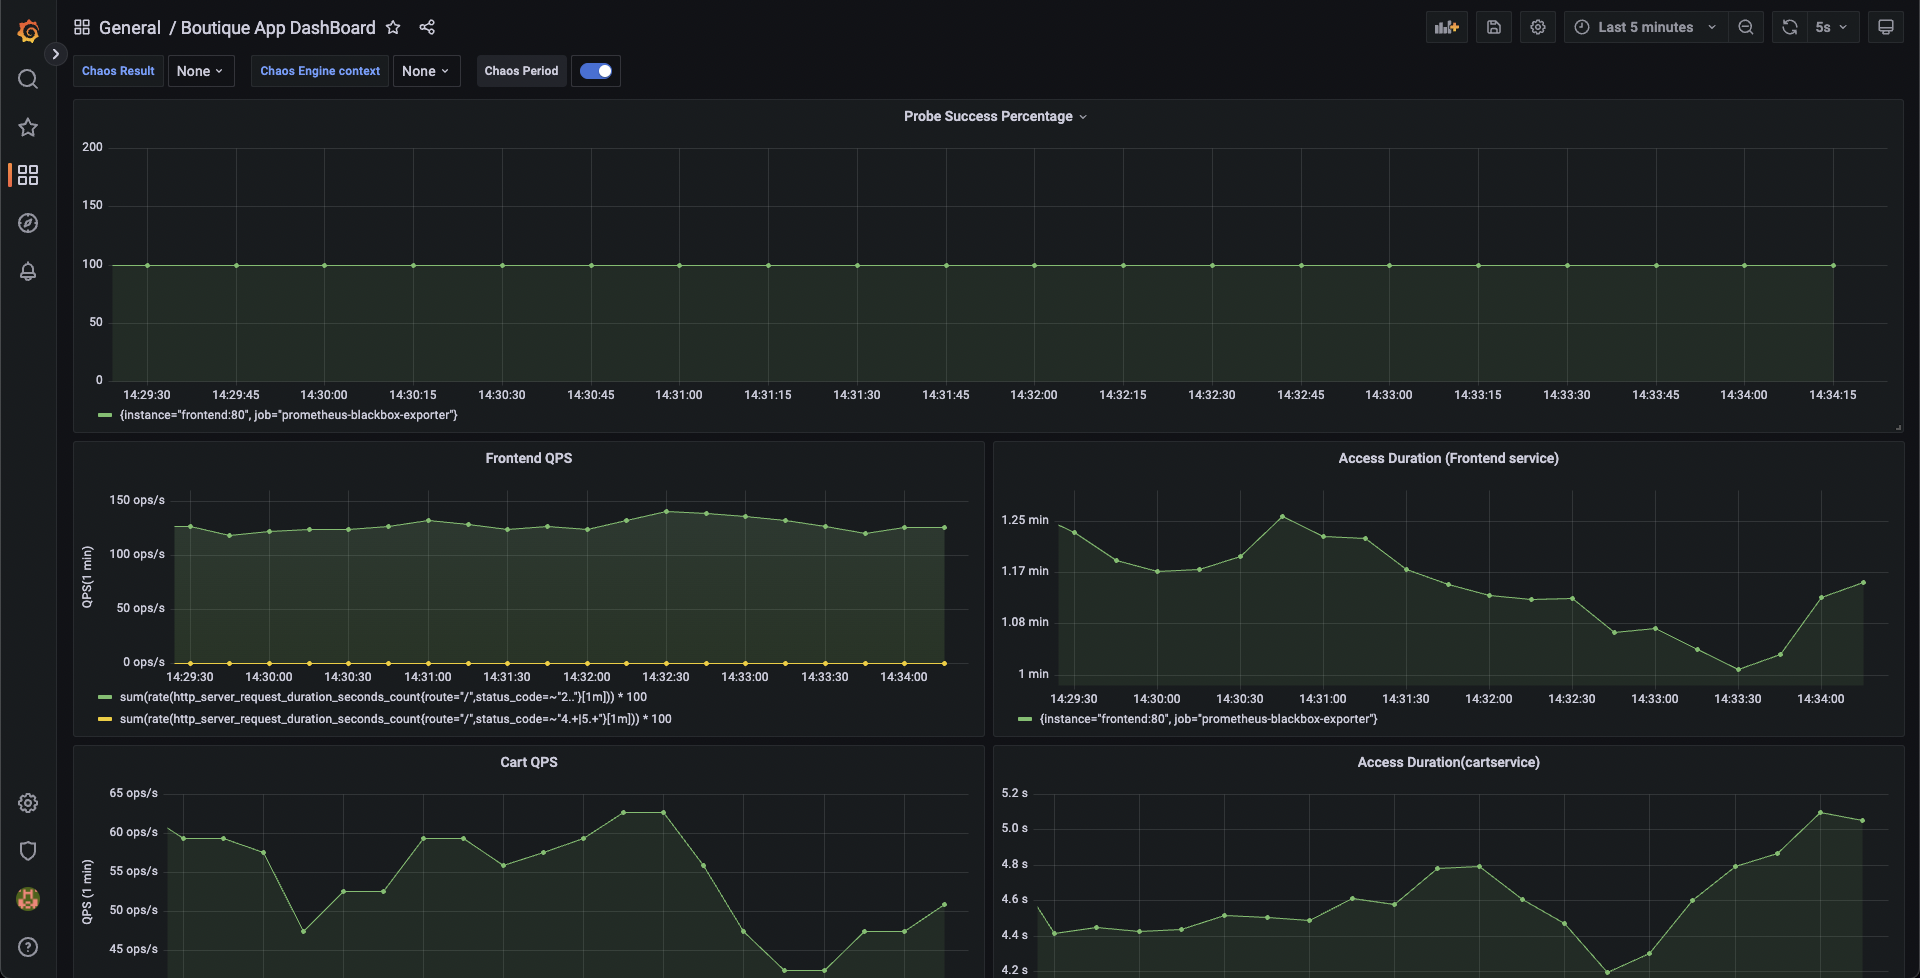
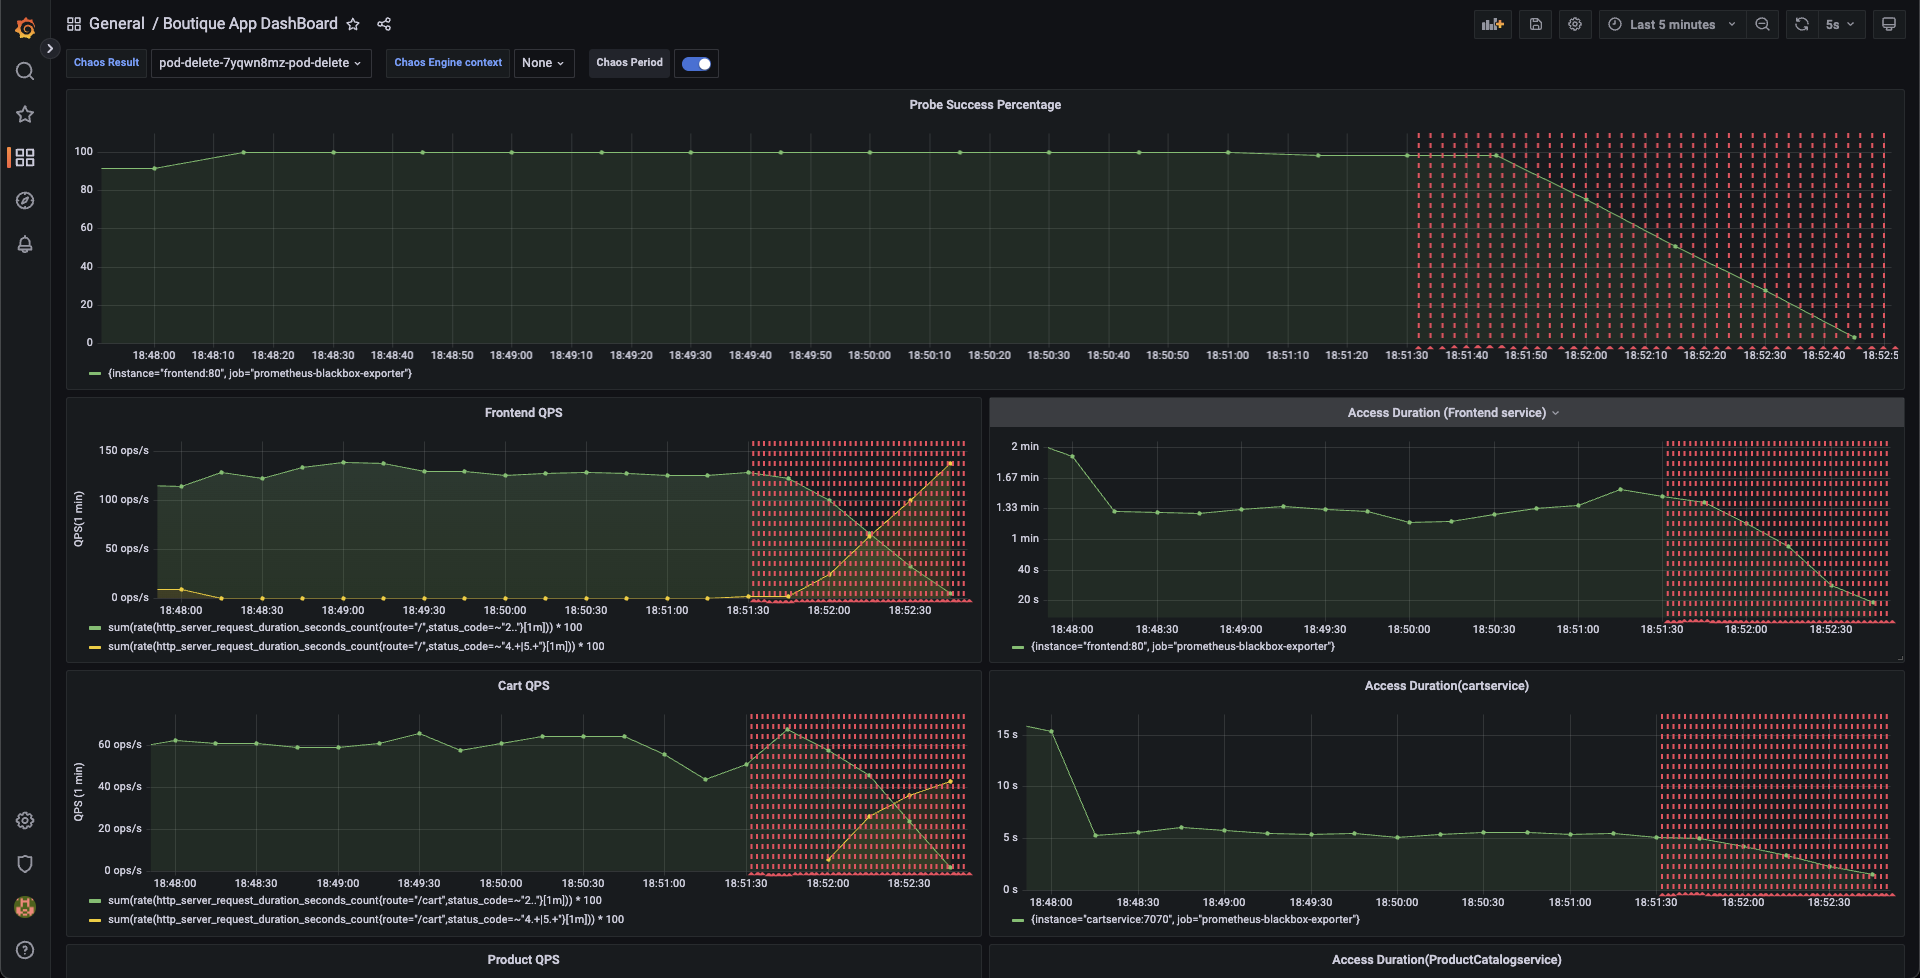
- You can validate this behavior using the application metrics dashboard too. The probe success percentage for website availability (200 response code) decreases steeply along with the 99th percentile (green line) queries per second (QPS) and access duration for the application microservices. Also, the mean QPS (yellow line) steeply increases. This is because no pod is available at the moment to service the query requests.
Step 7: Evaluate the experiment run
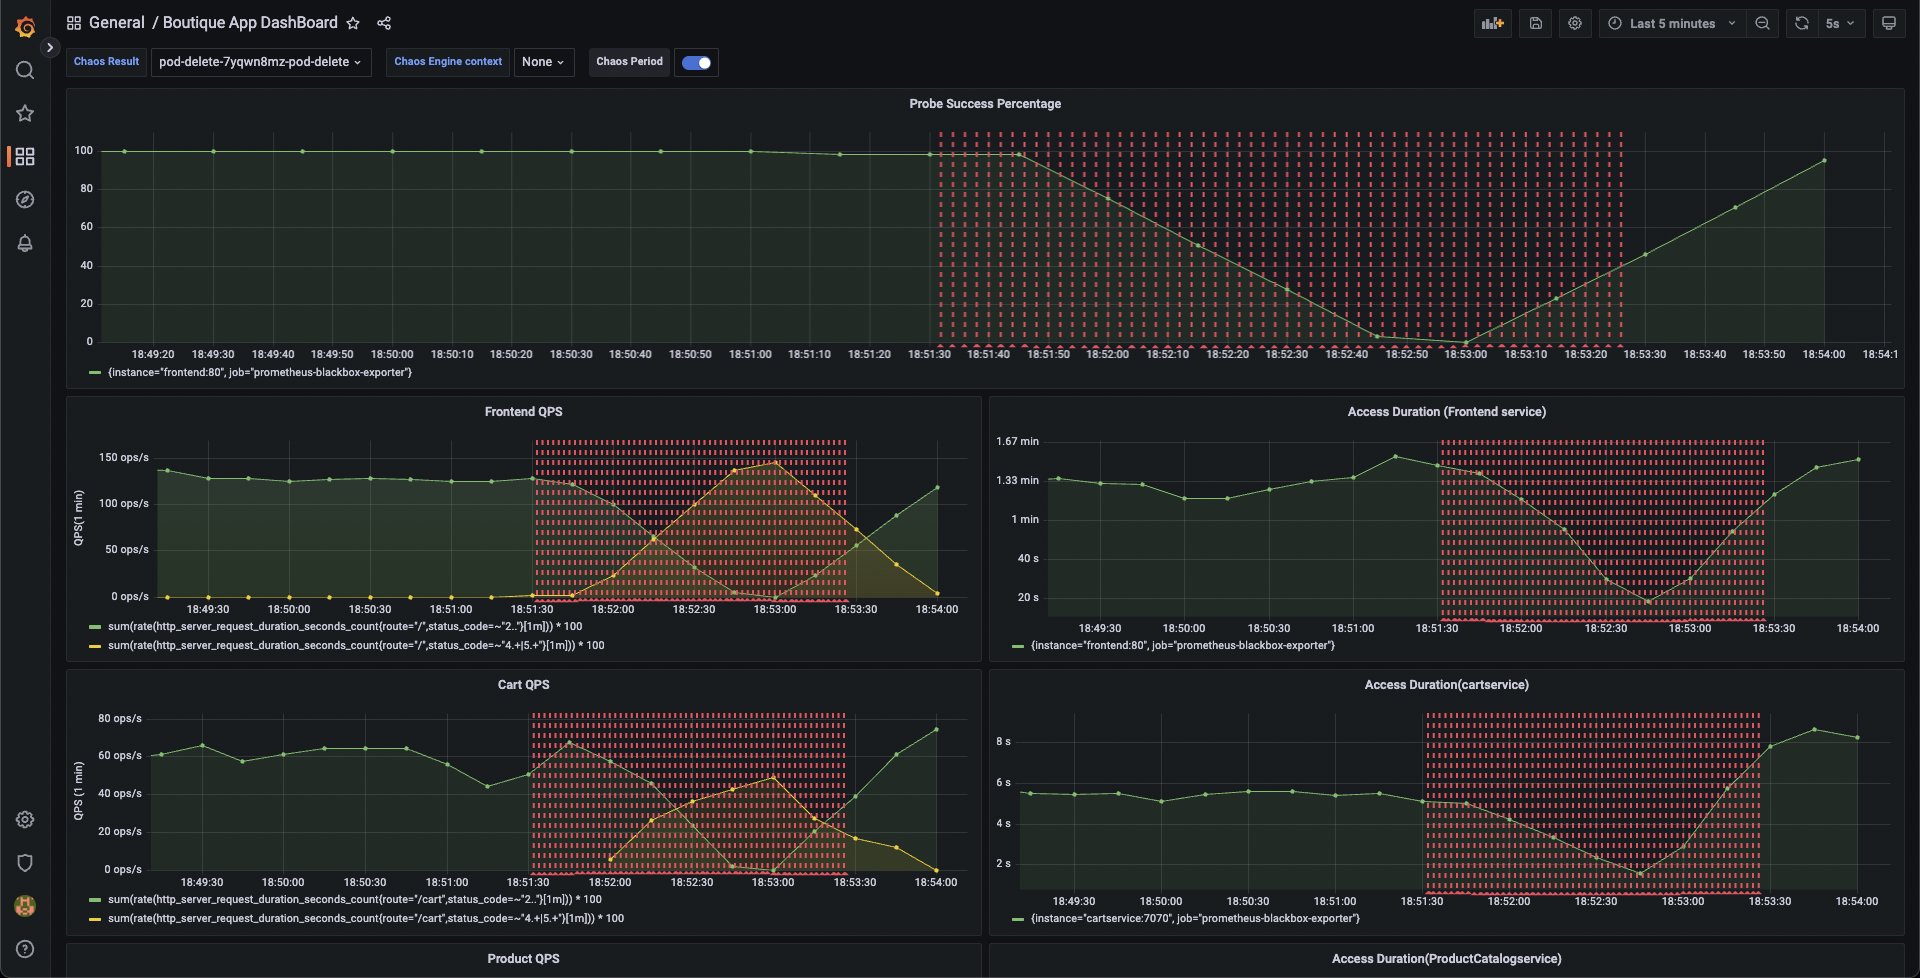
- When the experiment execution concludes, you get a resilience score of 0 %. You will observe that the pod delete fault step failed. Before analyzing the experiment result, you can validate that the application is now again accessible, without any errors. You can validate this from the Grafana dashboard metrics that indicate the app returning to normal as the chaos duration is over.
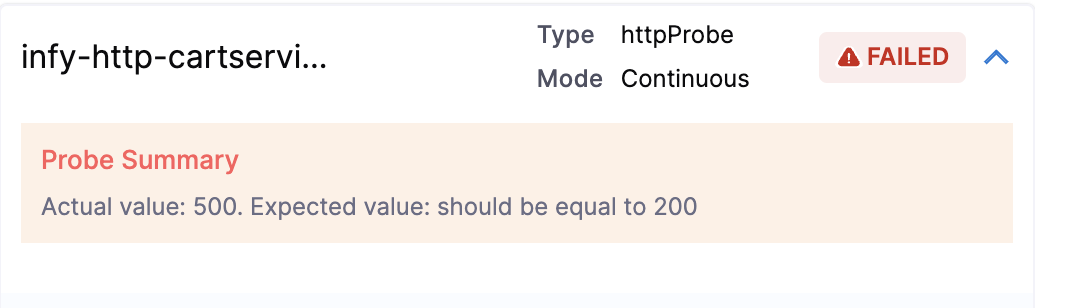
- You can check the chaos result that shows the pod delete as Failed. This is because the 'http-cart-service' probe failed. The failure is due to the unavailability of the cart pod and therefore the
/cartendpoint, due to injecting the "pod delete" fault.
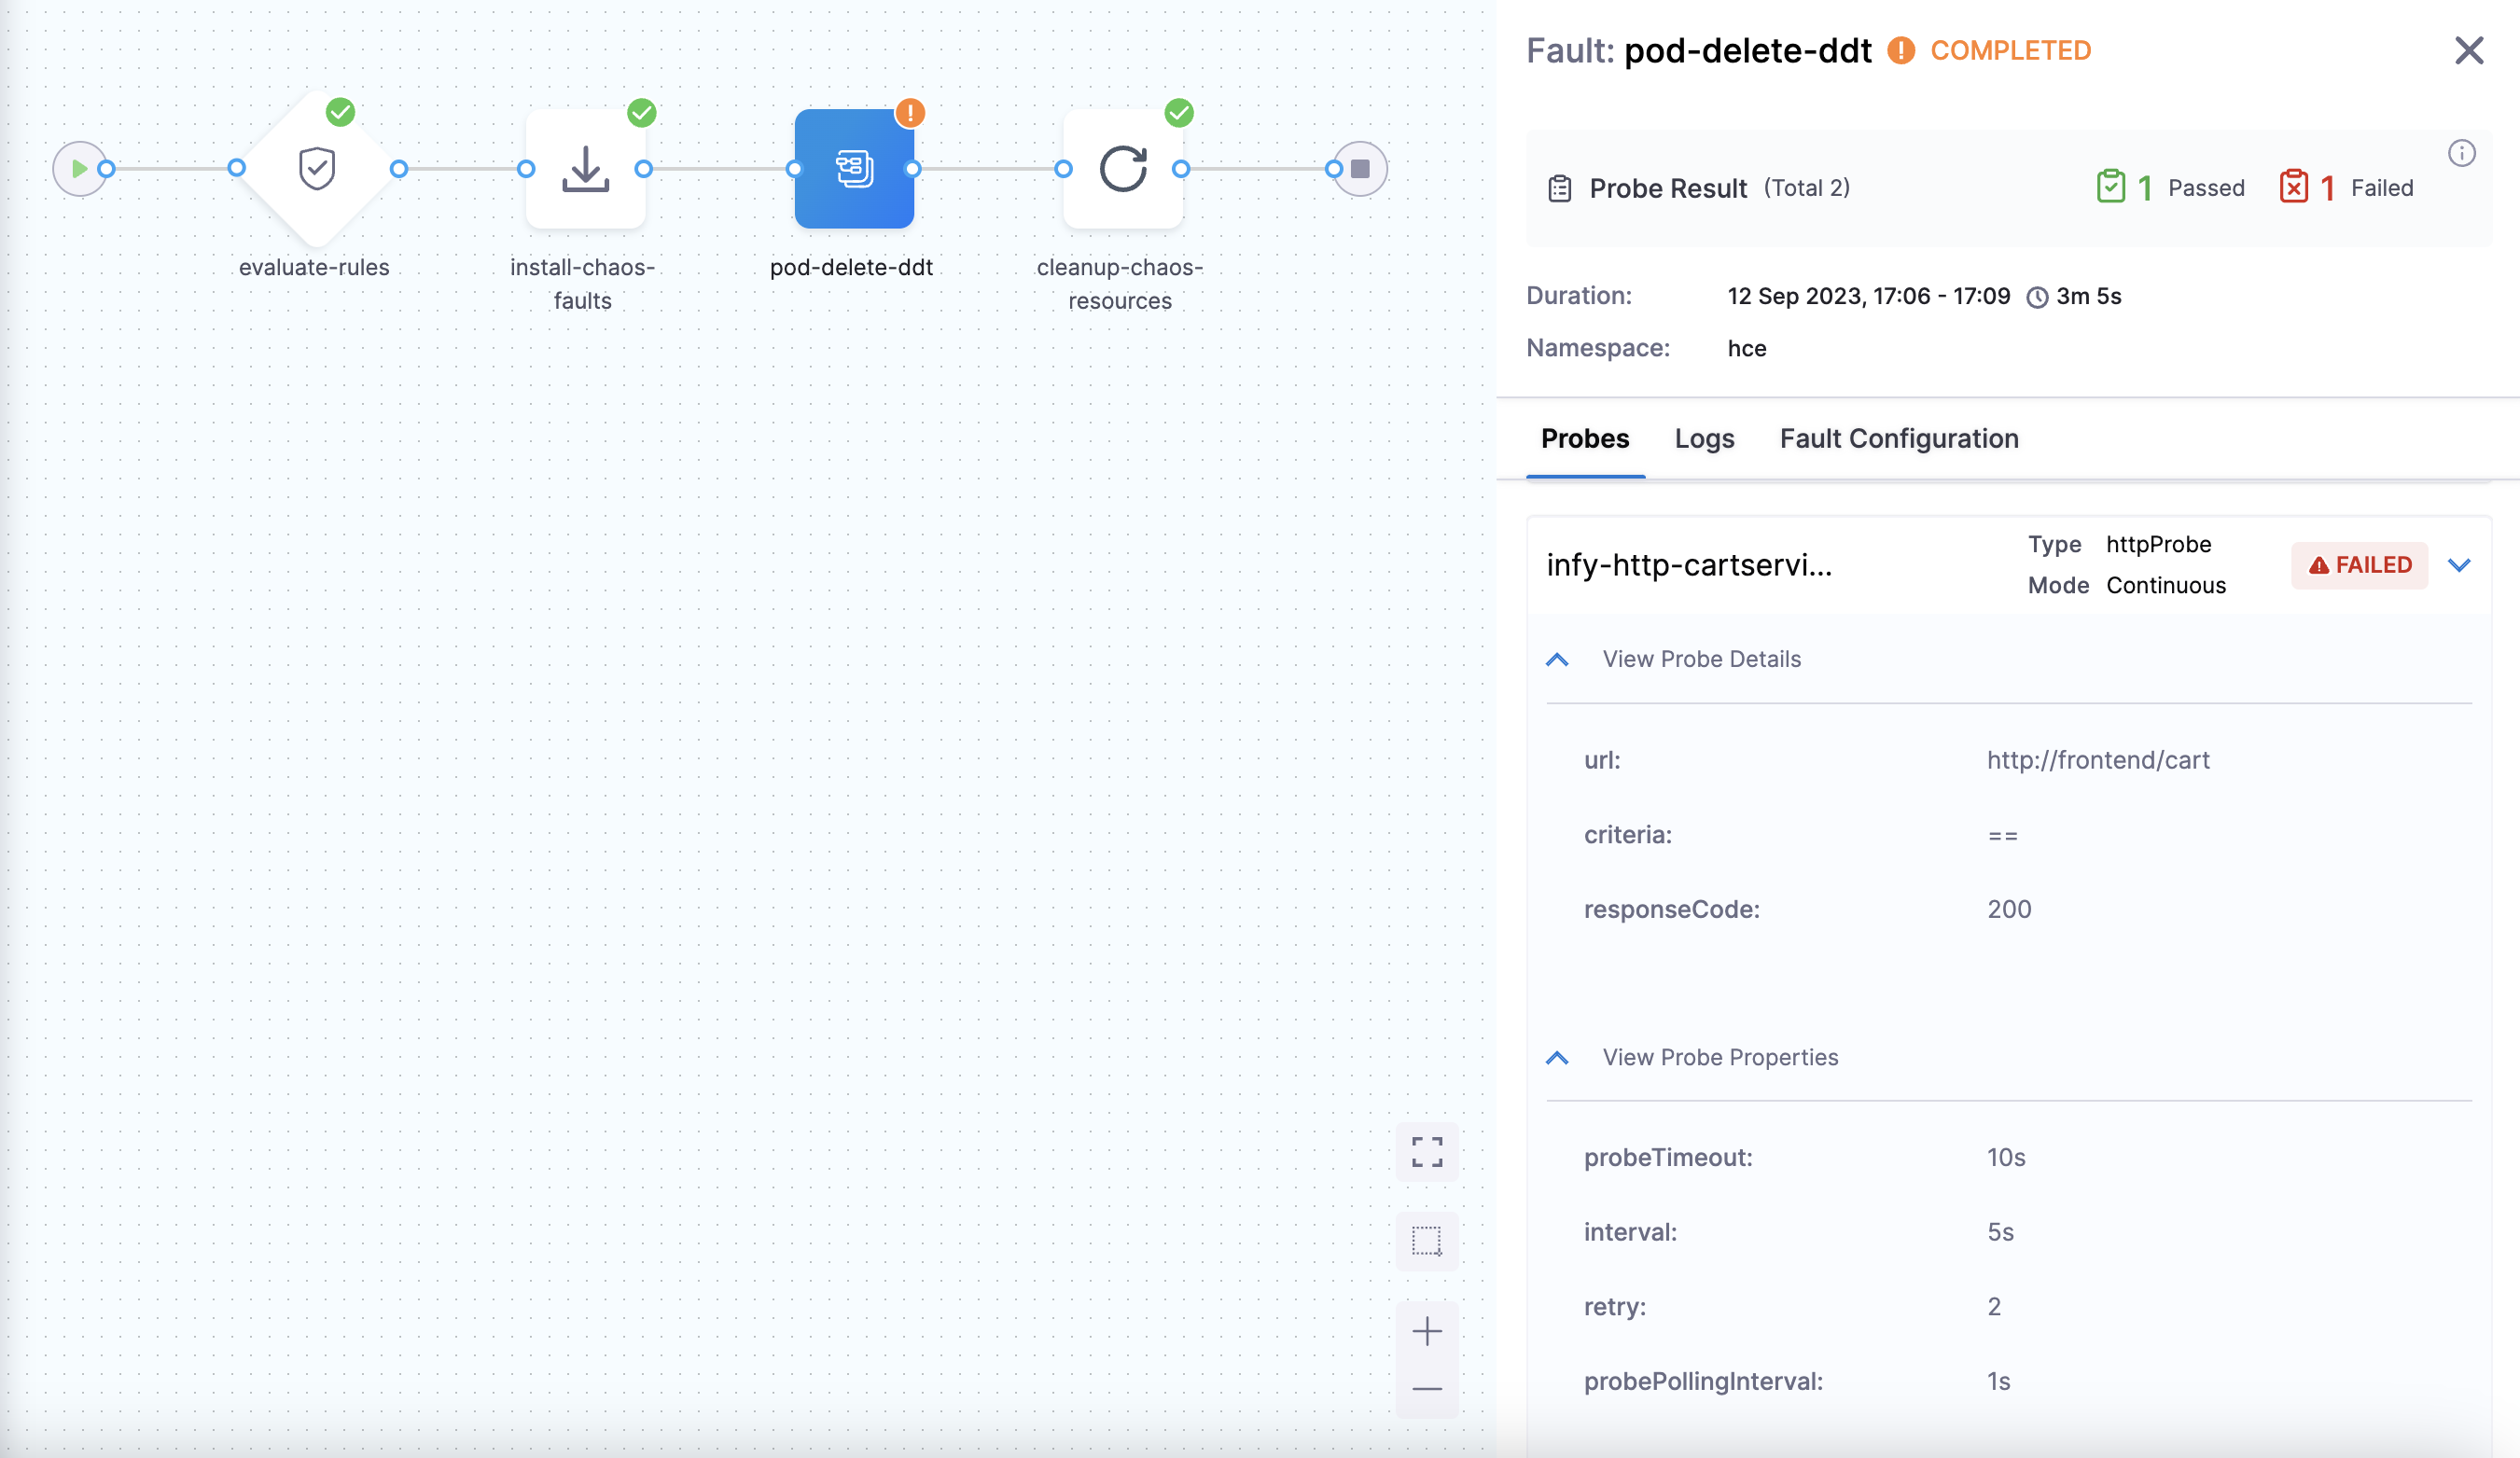
You can see that the value expected and the value obtained don't match. Hence, the probe fails.
Conclusion
Congratulations on running your first chaos experiment! Want to know how to remediate the application so as to pass the experiment run and probe checks? Increase the experiment pods to at least two so that at least one deployment pod survives the pod delete fault and helps the application stay afloat. Try running it on your own!
Once you've explored this, head over to the next tutorial, where you'll learn how to create chaos experiments from scratch and execute them for the same target application.