> For the complete documentation index, see [llms.txt](https://developer.harness.io/llms.txt). Markdown versions of documentation pages are available by appending `.md` to page URLs; this page is available as [Markdown](https://developer.harness.io/web-application-and-api-protection-waap-discovery-discovery-discovery-discovery/api-security-testing/ast-basics-and-workflow/scan-details/scan-runs.md).
# Scan Runs
Track each run of an API Security Testing scan, re-run a scan, and use run details to spot anomalies such as aborted runs
The **Scan Runs** tab lists all scan executions for the scan configuration in reverse-chronological order, with the latest at the top. Each row represents an individual scan execution and helps you track scan performance and behavior over time.
## What you will learn from this topic
By the end of this topic, you will be able to understand:
* The details displayed in the **Scan Runs** tab.
* The steps to re-run a scan.
* How to interpret the outcome of a scan run, including its status and status reason.
* The way you can use scan run data to detect anomalies.
* The details available for an individual scan run, including its validation summary and health signals.
***
## Before you begin
Make a note of the following before you review scan runs:
* Ensure that the scan has been queued or executed at least once, as Traceable lists a row per execution. For the steps to create and run a scan, go to [Creating a Scan](https://developer.harness.io/web-application-and-api-protection-waap-discovery-discovery-discovery-discovery/api-security-testing/ast-basics-and-workflow/creating-a-scan.md).
* Make sure that you have at least one configured runner, because Traceable executes and re-runs scans through runners. Go to [Runners](https://developer.harness.io/web-application-and-api-protection-waap-discovery-discovery-discovery-discovery/api-security-testing/ast-basics-and-workflow/runners-and-cli.md) for more details.
***
## Understand the Scan Runs tab
Navigate to **Testing** → **Scans**, click a scan, and then click the **Scan Runs** tab. Scan runs provide granular information for each scan run of a scan. These details help you understand scan consistency and detect anomalies, such as aborted scan runs and inconsistent test counts.
Scan Runs tab
The tab shows a table with the following details:
| Column | Description |
| ------------------- | ------------------------------------------------------------------------------------------------------------------------------------------------------------------------------------------------------------------------------------------------------------------------------------------------------------ |
| **Status** | Displays whether the scan was *Completed, Aborted, Queued* or is *Running*. Go to [Scan statuses](https://developer.harness.io/web-application-and-api-protection-waap-discovery-discovery-discovery-discovery/api-security-testing/ast-basics-and-workflow/scan-details.md#scan-statuses) for more details. |
| **Scan Run** | Displays the scan run in reverse sequential order. |
| **Duration** | Displays the time taken for scan completion. |
| **Tests Executed** | Displays the number of tests executed out of the number of tests generated for the PI endpoints. |
| **Scanned APIs** | Displays the number of API endpoints scanned during the scan run. |
| **Vulnerabilities** | Displays the number of issues (vulnerabilities) identified in the scan run. |
| **Start Time** | Displays the timestamp indicating when the scan began. |
| **⋮** (Actions) | Displays the actions available for the scan run. Go to [Actions in the Scan Runs tab](#actions-in-the-scan-runs-tab) for more details. |
These details help you understand scan consistency and detect anomalies, such as aborted scan runs and inconsistent test counts.
### Actions in the Scan Runs tab
The actions in the **Scan Runs** tab help you focus on runs by status or findings, export the run history, and act on individual runs. Traceable provides the following actions in the tab:
| Action | Description |
| ---------------------- | --------------------------------------------------------------------------------------------------------------- |
| **Filter** icon | Refines the data Traceable displays in the tab. Go to [Filter attributes](#filter-attributes) for more details. |
| **Group By** drop-down | Groups the data shown in the tab by *Status*, or displays it ungrouped (*None*). |
| **Download** icon | Downloads the list of scan runs for offline analysis. |
#### Filter attributes
The filter panel contains the **Filters**, **Saved**, and **Recent** tabs. After you apply a filter, you can save it for later use under **Filter** → **Saved**.
The table below lists the attributes available on the **Filters** tab:
| Attribute | Values |
| -------------- | ------------------------------------------------------------------------------------------------------------------------------------------------------------------------------------------------------------- |
| **Status** | The status of the scan run, such as *Completed*, *Aborted*, or *Undefined*. You can select more than one value. |
| **Severity** | The severity of the vulnerabilities detected in the scan run, such as *Vulnerability Severity Critical*, *Vulnerability Severity High*, and *Vulnerability Severity Low*. You can select more than one value. |
| **Vulnerable** | Whether the scan run detected vulnerable APIs, *True* or *False*. |
Once you have selected the values, click **Apply Filter**. To clear the selected values, click **Clear All**.
### Navigate from the table to coverage, test, and issue details
Traceable scopes the destination tab to the selected scan run when you click a value in the following columns:
* **Tests Executed:** Opens the **Tests** tab for the selected scan run and displays the tests Traceable executed, along with their status, vulnerability type, and response code. Go to [Tests](https://developer.harness.io/web-application-and-api-protection-waap-discovery-discovery-discovery-discovery/api-security-testing/ast-basics-and-workflow/scan-details/tests.md) for more details.
* **Scanned APIs:** Opens the **API Coverage** tab for the selected scan run and displays the endpoints Traceable covered, along with their test and plugin counts. Go to [API Coverage](https://developer.harness.io/web-application-and-api-protection-waap-discovery-discovery-discovery-discovery/api-security-testing/ast-basics-and-workflow/scan-details/api-coverage.md) for more details.
* **Vulnerabilities:** Opens the **Issues** tab for the selected scan run and displays the vulnerabilities Traceable identified. Go to [Issues](https://developer.harness.io/web-application-and-api-protection-waap-discovery-discovery-discovery-discovery/api-security-testing/ast-basics-and-workflow/scan-details/issues.md) for more details.
***
## Understand the Scan Run panel
The **Scan Run** slide-out panel provides detailed information about a single scan run. You can use it to verify what the run scanned, check whether Traceable could reach your APIs and run healthily, and troubleshoot a run that failed or underperformed. Click a scan run for further details grouped under the **Overview**, **Validation Summary**, **Logs**, and **Scan Run History** tabs.
{% hint style="info" %}
Scan Recommendations are available from Traceable CLI version *2.6.2* or later.
{% endhint %}
{% tabs %}
{% tab title="Overview" %}
The **Overview** tab displays the metadata and outcome of the selected scan run, which helps you confirm what Traceable scanned, who triggered the run, and why the run ended in its current status:
| Field | Description |
| --------------------------- | ---------------------------------------------------------------------------------------------------------------------------------------------------------------------------------------------------------------------------------------------------------------------------------------------------------------------------- |
| **Scan Id** | Displays the unique identifier Traceable assigned to the scan run, with a **Copy** icon. |
| **Environment Name** | Displays the environment in which Traceable executed the scan run. |
| **APIs Scanned** | Displays the number of endpoints Traceable tested out of the total endpoints, with a progress bar. |
| **Vulnerability Breakdown** | Displays the number of vulnerabilities identified for each severity. |
| **Initiated By** | Displays the user or system that triggered the scan run. |
| **Time Taken** | Displays the time the scan run took to complete. |
| **Scan Status** | Displays the outcome of the scan run, such as *Completed,* *Aborted, Queued,* or *Running*. Go to [Scan statuses](https://developer.harness.io/web-application-and-api-protection-waap-discovery-discovery-discovery-discovery/api-security-testing/ast-basics-and-workflow/scan-details.md#scan-statuses) for more details. |
| **Scan Status Reason** | Displays the explanation behind the reported status, such as *Scan aborted* or *Scan Timed Out*, which is useful when a scan run did not complete or completed without scanning every API. Go to [Interpret the outcome of a scan run](#interpret-the-outcome-of-a-scan-run) for more details. |
| **Initiation Source** | Displays where the scan run was triggered from, such as *PLATFORM*. |
| **Traffic Type** | Displays the traffic type of the scan run, such as *Live Traffic* or *Replay Traffic*. |
| **Policy** | Displays the policy used by the scan run. Go to [Policies](https://developer.harness.io/web-application-and-api-protection-waap-discovery-discovery-discovery-discovery/api-security-testing/advanced-usage/policies.md) for more details. |
| **Open API Specs** | Displays the specification files used by the scan run. Click the **View** icon to preview a file. |
| **Runner** | Displays the runner that executed the scan run. |
| **CLI Version** | Displays the CLI version of the runner. |
Scan runs Overview
{% hint style="info" %}
A *Completed* scan run does not necessarily mean the scan was successful. A scan run is successful when it finds no vulnerabilities and generates no recommendations. Go to [**Validation Summary**](#validation-summary) for more details.
{% endhint %}
{% endtab %}
{% tab title="Validation Summary" %}
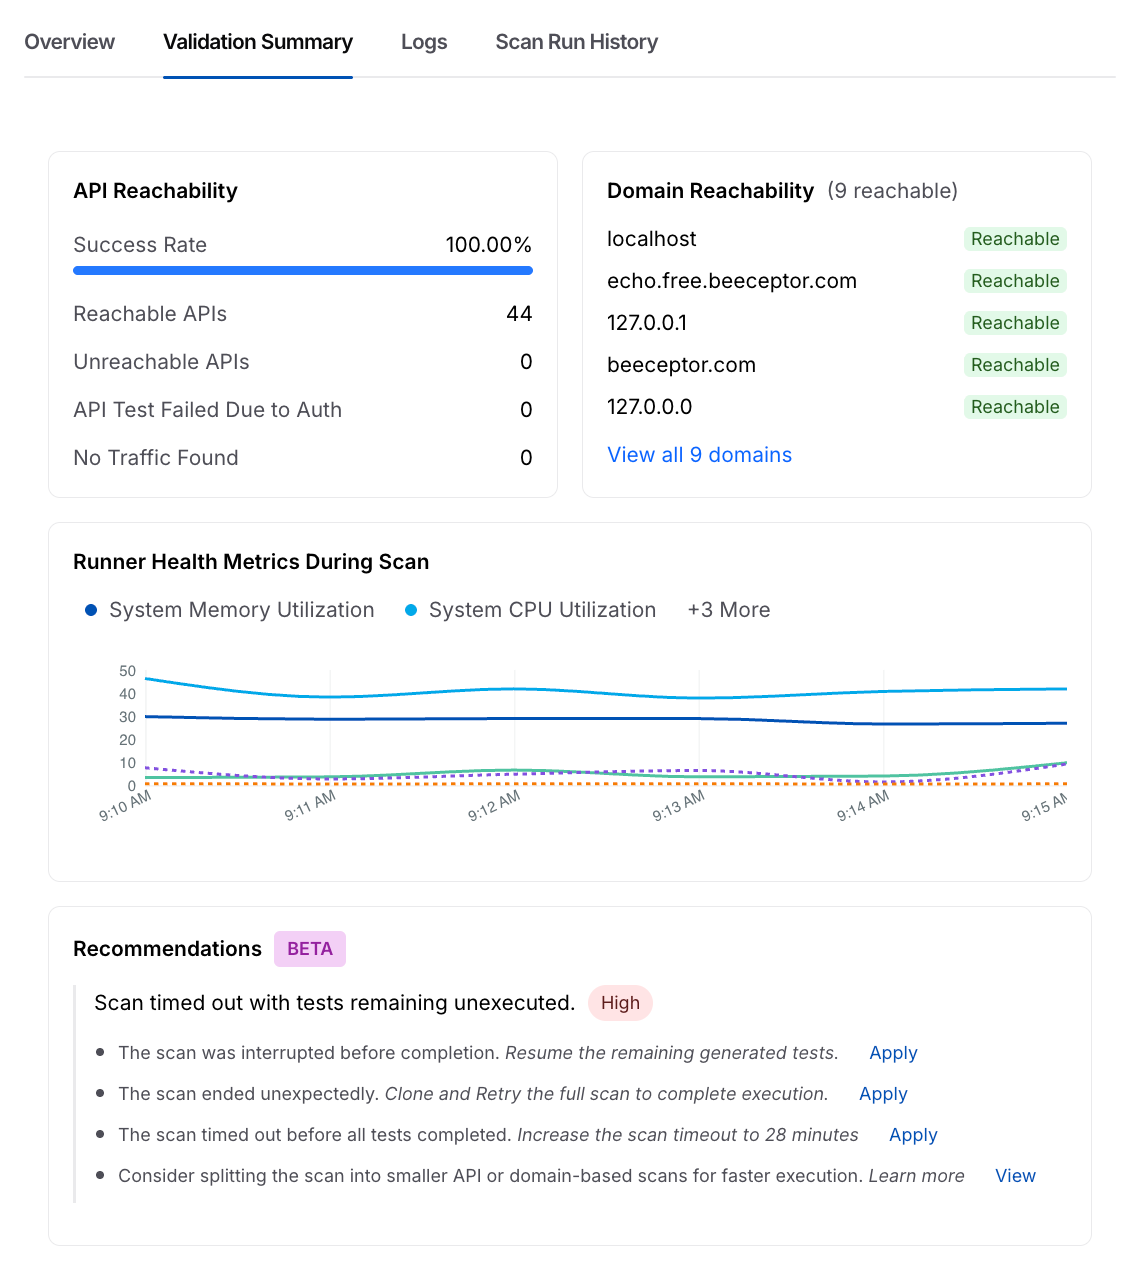
The **Validation Summary** tab reports whether Traceable could reach your APIs and run the scan healthily, across the following widgets:
**API reachability**
This widget displays the **Success Rate**, the percentage of APIs that Traceable successfully reached, along with the following counts, which help you identify connectivity, authentication, or configuration issues that may affect scan coverage:
* **Reachable APIs**: The number of APIs Traceable reached. Click this label to open the **API Coverage** tab for the scan run, filtered by **API Reachability**.
* **Unreachable APIs**: The number of APIs Traceable could not reach.
* **API Test Failed Due to Auth**: The number of APIs whose tests failed authentication.
* **No Traffic Found**: The number of APIs for which Traceable observed no traffic.
Click the issue to be redirected to the **API Coverage** tab with the issue applied as a filter under **API Reachability.** Go to API Coverage for more details.
**Domain reachability**
This widget displays the number of reachable domains and lists the domains associated with the scanned APIs, each with a status such as *Reachable* or *No Traffic Found*, which helps you verify whether those domains are accessible to Traceable.
**Runner health metrics during scan**
This widget displays a time-series chart of runner resource utilization during the scan run, such as *System Memory Utilization, System CPU Utilization, System Filesystem Utilization, Runner CPU Utilization* and *Runner Memory Utilization*, which helps you determine whether runner performance issues affected scan execution.
**Scan recommendations**
This widget displays actionable, contextual guidance based on the health signals of the scan run. For example, if the runner stopped sending heartbeat signals, Traceable displays a *High*-severity recommendation with steps to verify runner connectivity and resource availability. If there are no recommendations, Traceable displays *No recommendations for this scan run*.
Traceable tags each recommendation with a severity, *Critical*, *High*, *Medium*, or *Low*, and lists specific remediation steps to help you resolve the underlying issue before the next scan run. Traceable provides two types of recommendations:
* **Direct actions**: Traceable modifies the scan configuration based on your approval, and the change takes effect on the next scan run. To use a recommendation, click **Apply**, and Traceable updates the configuration accordingly.
* **Informational redirects**: Traceable redirects you to a page with deeper context or controls to resolve the issue. For example, the **View no-traffic APIs** link opens the **API Coverage** tab filtered to the APIs for which Traceable found no traffic.
Traceable makes these recommendations available for the following issues:
* **Runner Health Issue**: Triggered by runner-side failures, such as crashes, resource exhaustion, and missed heartbeats.
* **Scan Idle Timeout**: Triggered when a scan stops because the runner idles for more than 30 minutes and zero tests are generated.
* **Scan Timeout**: Triggered when the scan was being executed but exceeded the configured timeout.
* **Coverage Issues**: Triggered when there are widespread authentication failures, no traffic, or unreachable APIs across the scan.
Scan Details Validation Summary
{% endtab %}
{% tab title="Logs" %}
The **Logs** tab provides detailed runtime activity around the scan. It lists the initialization steps, execution flow, and any errors or warnings, which is helpful for troubleshooting failures, timeouts, authentication errors, and unexpected scan behavior.
{% endtab %}
{% tab title="Scan Run History" %}
The **Scan Run History** tab provides a detailed history of a scan run. It lists the user who queued the scan for execution, the associated runner name, the CLI version, the time the scan started, and the total time taken for the scan, which helps you identify who triggered the scan and when. The table below lists the columns in the tab:
| Column | Description |
| --------------- | ---------------------------------------------------- |
| **#** | Displays the sequence number of the execution. |
| **Run By** | Displays the user who queued the scan for execution. |
| **Runner Name** | Displays the runner associated with the execution. |
| **CLI Version** | Displays the CLI version of the runner. |
| **Start Time** | Displays the time the execution started. |
| **Duration** | Displays the total duration of the execution. |
Scan Run History
{% endtab %}
{% endtabs %}
### Re-run a scan
Re-running a scan is useful when the number of tests executed is less than the number of tests generated, or when the scan run was aborted. Traceable displays the results of the re-run in the same **Scan Runs** tab.
{% hint style="info" %}
A re-run executes only the remaining tests that Traceable already generated for the scan. To have Traceable generate a new set of tests, run the scan again instead of re-running it.
{% endhint %}
To re-run a scan, complete the following steps:
1. Click a scan run to open the slide-out panel.
2. Click **Re-Run** in the top right corner of the panel. Traceable displays the **Re-Run Scan** pop-up window.
3. Under **Runners**, select how Traceable should select the runner from the following options:
| Option | Description |
| ----------------------------------------- | ------------------------------------------------------------------------------------------------------------------------------------------------------------------------------------------------------- |
| **Select runner automatically** (default) | Enables Traceable to select the most suitable runner from the configured runners list. |
| **Select specific runners** | Enables Traceable to execute the scan using the runners you select from the **Select Runners** drop-down. |
| **Select specific labels** | Enables Traceable to execute the scan using the most suitable runner from the labels you select in the **Label** list. Traceable displays the runners with the selected labels in the **Runners** list. |
4. (Optional) Click **Refresh** to reload the list of runners or labels.
5. Click **Re-Run**.
Re-run a scan
{% hint style="info" %}
* Traceable enables the **Re-Run** button only after you select at least one runner or label.
* To configure new runners, click the **Runner Management** link in the pop-up window. Go to [Runners](https://developer.harness.io/web-application-and-api-protection-waap-discovery-discovery-discovery-discovery/api-security-testing/ast-basics-and-workflow/runners-and-cli.md) for more details.
{% endhint %}
Re-running a scan is useful when the number of tests executed is less than the number of tests generated, or when the scan run was aborted for some reason. Traceable displays the results in the same **Scan Runs** tab.
### Scan run actions
Traceable provides actions for each scan run. In the slide-out panel, click ⋮ to view the available actions:
| Action | Description |
| ----------------------------------- | --------------------------------------------------------------------------------------------------------------------------------------------------------------------------------------------------------------------------------------------------------- |
| **View Report** | Opens the report for the scan run. |
| **Delete Scan** | Removes the scan run. |
| **Clone & Run** | Creates a copy of the configuration of the scan run and queues it for execution. |
| **Make Base Scan/Remove Base Scan** | Toggle the base scan status to set or remove a scan run as the base scan. A base scan serves as a baseline for identifying new and existing vulnerabilities. Subsequent scan runs can use it to highlight regressions or changes in the security posture. |
{% hint style="info" %}
* A scan run in the *Queued* state provides only the **View Report** and **Delete** actions.
* Only platform scans that are completed or terminated can be cloned.
{% endhint %}
***
## Interpret the outcome of a scan run
The **Scan Status** and **Scan Status Reason** fields in the **Overview** tab together show how a scan run ended. You can use these fields to decide whether to review results, re-run the scan, or correct its configuration. When you automate scans, use them to select completed runs from which to pull results. Go to [Scan statuses](https://developer.harness.io/web-application-and-api-protection-waap-discovery-discovery-discovery-discovery/api-security-testing/ast-basics-and-workflow/scan-details.md#scan-statuses) for the list of statuses.
### Completed scan runs
Traceable reports a scan run as *Completed* when any of the following conditions occurs:
* The runner executed all the tests that Traceable generated for the scan run.
* A resumed scan run finished executing its remaining tests.
* The runner reported completion for a scan that uses live traffic.
* The scan run reached its configured timeout.
* The runner did not receive any further tests that required execution.
* The runner stayed idle for the configured idle duration after it executed all available tests, which Traceable reports as *Scan Timed Out*.
{% hint style="info" %}
A *Completed* status does not mean that Traceable scanned every API. Traceable does not scan an API in the following cases:
* The API is unreachable.
* The API fails authentication.
The scan run completes once the tests available for the remaining APIs have run. To identify the APIs that Traceable did not scan, navigate to **Validation Summary** tab and review **API reachability**. Go to [Validation Summary](#validation-summary) for more details.
{% endhint %}
### Aborted scan runs
Traceable reports a scan run as *Aborted* when any of the following conditions occurs:
* You abort the scan run from the user interface (UI).
* The reachability tests did not pass and no eligible APIs remain to test.
* All APIs are unreachable.
* The API discovery job times out.
* Traceable could not process the OpenAPI specs, such as when no specs were processed, discovery failed, or an exception occurred during processing.
* The runner is unhealthy before the scan run starts executing.
You can re-run an aborted scan run after you resolve the underlying cause. Go to [Re-run a scan](#re-run-a-scan) for more details.
***
## Leverage the data shown in the tab
Consider a scenario where you created a scan that runs once daily. You can use the **Scan Runs** tab to compare scan executions and scan statuses over time.
For example, *Scan #7* generates the most tests and executes successfully, indicating comprehensive API coverage. However, *Scan #3* gets aborted midway, executing only *100* tests and scanning only *3* APIs, which may be caused by factors, such as an environmental error or an authentication failure. In this scenario, you can analyze the issue and set up alerts so the scan does not abort midway.
Consistent values across the *Tests Executed* and *Scanned APIs* columns help you confirm scan stability, while a reduced vulnerability count helps you validate the security measures you have taken. Any sudden drop or spike in either value may indicate a change, such as API reachability, availability, or configuration issues.
The **Scan Runs** tab acts as an audit trail that helps you:
* Identify and troubleshoot aborted scans.
* Validate whether newly added APIs are being tested in the scans.
* Confirm whether the identified issues are increasing or decreasing.
* Modify scan configurations according to your requirements.
***
## Resume scan analysis
Once you have identified the scan run you want to investigate, you can continue your analysis in the other tabs of the Scan Details page:
* To review the endpoints covered in that run, open the **API Coverage** tab. Go to [API Coverage](https://developer.harness.io/web-application-and-api-protection-waap-discovery-discovery-discovery-discovery/api-security-testing/ast-basics-and-workflow/scan-details/api-coverage.md) for more details.
* To review the individual tests executed in that run, open the **Tests** tab. Go to [Tests](https://developer.harness.io/web-application-and-api-protection-waap-discovery-discovery-discovery-discovery/api-security-testing/ast-basics-and-workflow/scan-details/tests.md) for more details.
* To review the vulnerabilities detected in that run, open the **Issues** tab. Go to [Issues](https://developer.harness.io/web-application-and-api-protection-waap-discovery-discovery-discovery-discovery/api-security-testing/ast-basics-and-workflow/scan-details/issues.md) for more details.
* To confirm which endpoints were eligible for testing in that run, open the **Reachability Tests** tab. Go to [Reachability Tests](https://developer.harness.io/web-application-and-api-protection-waap-discovery-discovery-discovery-discovery/api-security-testing/ast-basics-and-workflow/scan-details/reachability-tests.md) for more details.