> For the complete documentation index, see [llms.txt](https://developer.harness.io/llms.txt). Markdown versions of documentation pages are available by appending `.md` to page URLs; this page is available as [Markdown](https://developer.harness.io/web-application-and-api-protection-waap/discovery/discovery-1/inventory/endpoint-details.md).
# Endpoint Details
Updates (July 2026 to September 2026)
* *September 2026* — Updated the page to add information about the Open Issues, Posture Events, and Security Events sections. For more information, see [Endpoint details overview](#endpoint-details-tabs1).
The **API endpoint details** page provides a comprehensive view of your API, including its activity, performance, and security. The page highlights malicious behaviors observed in the API, its OpenAPI specifications, and detailed trace information. It also provides API performance metrics, such as error and latency rates, along with detailed information about the parameters, which track the API’s behavior and structure over time.
## **What you will learn from this topic**
By the end of this topic, you will understand:
* The information available on each tab of the Endpoint details page.
* How to monitor an API's behavior, performance, and security from one place.
* How to investigate security issues and track how an endpoint's posture changes over time.
***
## **Navigate to the endpoint details page**
To view this page, navigate to the **Discovery** → **Inventory** → **API Endpoints** tab and click the API for which you want to view the details.
Endpoint Details
***
## **Endpoint details overview**
The Endpoint details page organizes information into the following tabs. Click the relevant tab to learn more about the information displayed in each tab.
{% tabs %}
{% tab title="Overview" %}
The **Overview** tab shows detailed information about an API using the following sections:
* **Details** — This section contains the following information:
* Service and domain associated with the API.
* The time at which the API was created and last updated.
* The auth type, encryption, and type of API.
* The source and environment of the API.
* The authorized roles and scopes that can access the API. You can also edit these roles and scopes according to your requirements. For more information, see the section below.
* The ownership of the API. For more information, see [API ownership](/web-application-and-api-protection-waap/discovery/discovery-1/api-ownership.md).
* **Risk Score** — This section highlights the risk score assigned to the API. This score is calculated based on various contributors. For more information on risk scoring, see [Risk score](/web-application-and-api-protection-waap/discovery/settings/risk-scoring.md). The section also highlights the contributors to the risk score. You can expand each contributor to view detailed information about it. You can also create Jira issues to remediate each issue. To do so, click **Create** corresponding to the contributor, specify the details in the pop-up, and click **Create**.
You must integrate Jira with Traceable to be able to create Jira issues. For information on setting it up, see Jira integration.
* **User Roles** — This section outlines the various user roles that utilize your API. You can use this information to identify any unauthorized roles using the API. The section also displays a chart showing the number of requests per user role and the total number of requests to the API. For more information on how you can capture these roles from APIs, see [User Attribution](/web-application-and-api-protection-waap/settings/discovery/user-attribution-and-session-identification/user-attribution.md). Once you have set up user attribution, you can also assign additional roles or remove existing roles that have access to this API. This ensures that only authorized users can make the API calls. For more information on setting this up, see [Security Scheme](/web-application-and-api-protection-waap/discovery/settings/security-scheme.md).
* **Requests** — This section displays the total number of API requests and includes a time series chart that shows the requests at a specific time. It also displays another time series chart showing active attack requests and blocked requests, along with the top 5 detected attack types and the top 5 blocked attack types listed below. You can use this information to quickly block specific API requests.
* **API Documentation** — Traceable learns the API documentation throughout its discovery process and identifies sensitive data (parameters) in API requests and responses. This section provides a detailed overview of the traceable documentation, including sensitive data (parameters). You can click on a sensitive data type from the list, and Traceable highlights it in the documentation. You can also download the documentation in either of the following formats:
* Open API YAML
* Open API JSON
* WSDL (for *SOAP* API types only)
To do this, click the **Download** (:download:) icon corresponding to the format drop-down. You can use the downloaded documentation with applications such as Postman.
If you wish to download the OpenAPI or WSDL specifications for a domain, service, label, or environment, you can use the APIs provided by Traceable. For more information, see [Downloading API Documentation](/web-application-and-api-protection-waap/discovery/discovery-1/downloading-api-documentation.md).
API documentation is not generated for third-party APIs.
***
### Editing Authorized Roles and Scopes
If you have already configured the authorized roles and/or scopes, or if Traceable has automatically learned them from the incoming API traffic, these details are shown in the **Overview** tab.
{% hint style="info" %}
If you have not yet set up the authorized roles and scopes, see [Security Scheme](/web-application-and-api-protection-waap/discovery/settings/security-scheme.md).
{% endhint %}
In the **Overview** tab, you can edit existing roles and scopes according to your requirements. To do so, click the **Edit** () icon corresponding to the **Authorized Roles**/**Scopes** field, and in the pop-up window, perform either of the following actions:
Editing Authorized Roles/Scopes
* **Add Roles/Scopes**
1. Click the **+** icon in the top right corner.
2. In the **Manage Roles/Scopes** pop-up, click the drop-down, and select/deselect the check-box corresponding to the roles/scopes you wish to update. You can also create a new role/scope by specifying the name in the **Search** field and clicking **+ type to create new role/scope**.
* **Mark Auto-Learned Roles/Scopes as User-Defined**
Traceable represents Auto-Learned roles and scopes using the icon.
1. Click the **Ellipse** () icon corresponding to the role/scope you wish to update.
2. Click **Mark as User-defined**.
* **Delete Roles/Scopes**
1. Click the **Ellipse** () icon corresponding to the role/scope you wish to delete.
2. Click **Delete**.
{% endtab %}
{% tab title="Parameters" %}
The **Parameters** tab provides an overview and details of the various parameters used in an API as well as their location and sensitivity. The Parameters tab also includes information about the datatypes and datasets associated with a parameter. This is useful for gaining in-depth insights into your API activity and understanding the criticality of parameters.
{% hint style="info" %}
Parameters are not generated for third-party APIs.
{% endhint %}
Parameters
The visualization section in the tab provides information about the following:
* **Parameters by Location** — Displays a chart showing the total number of parameters discovered in different sections of an API request or response, with each location represented in a different color.
* **Parameters by Sensitivity** — Displays a chart showing the total number of parameters discovered in an API request or response, grouped by sensitivity and represented in different colors.
Parameters that are not associated with a datatype are not assigned a sensitivity (None) as shown above.
The tab also displays a list of parameters that Traceable has discovered in the API request and response. By default, Traceable displays the list of parameters that it has learned. The following details are shown for each parameter:
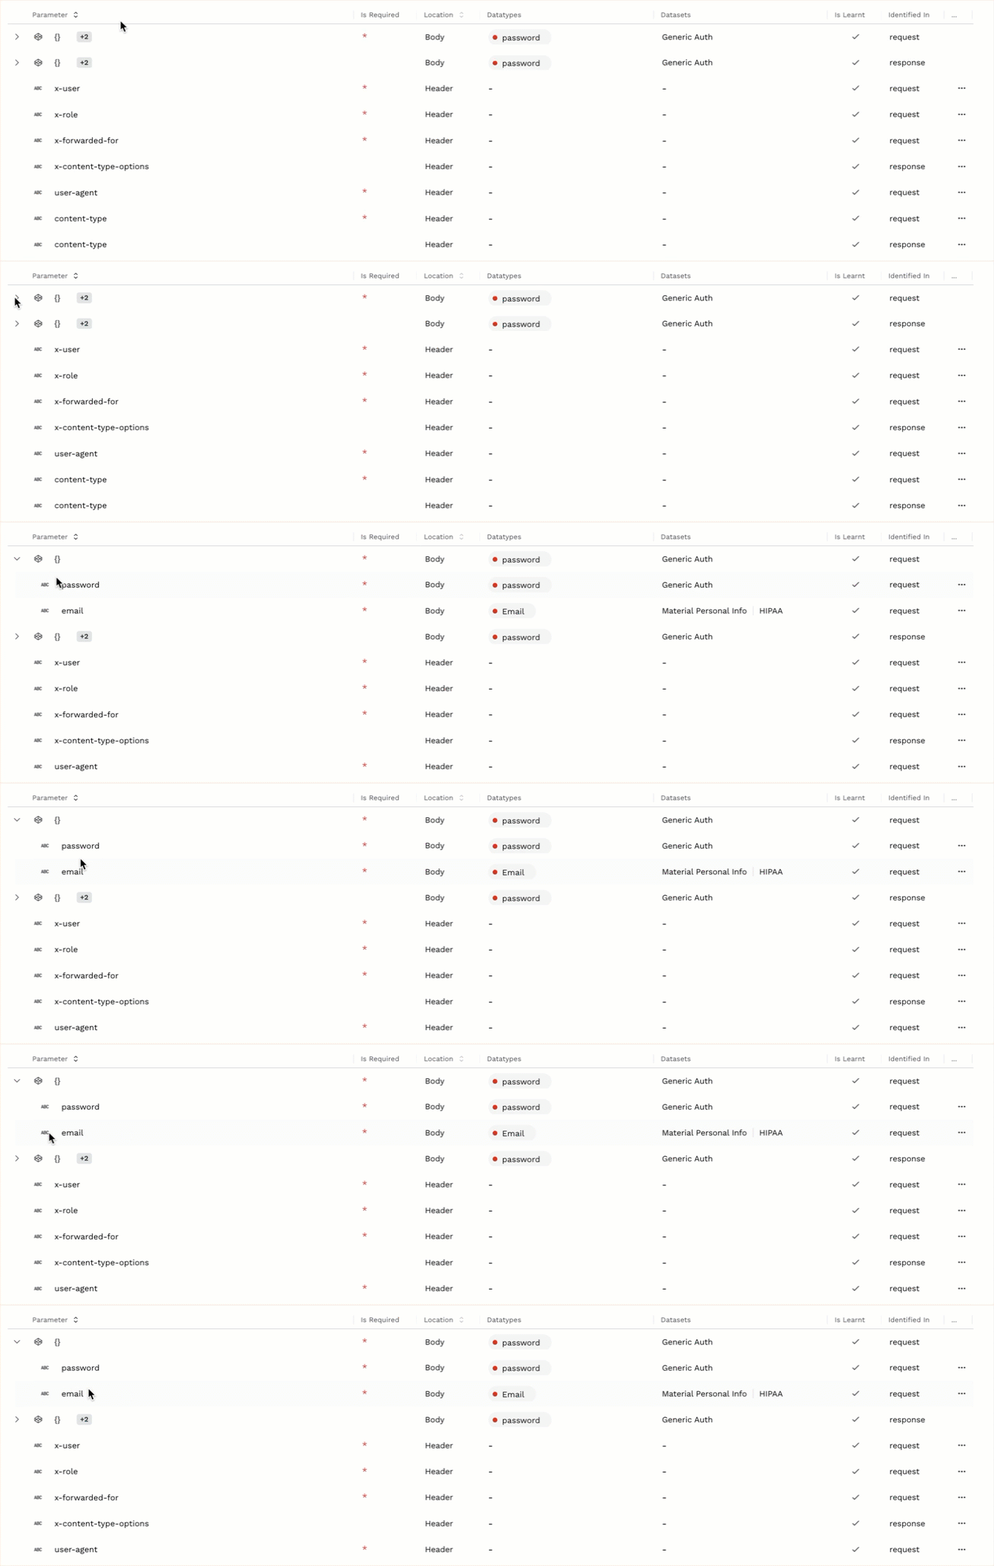
* **Parameter** — The name of the parameter discovered by Traceable. Objects containing multiple child parameters or objects are represented by *{}*. You can click the **Expand** () icon corresponding to an object to view the parameters under it. The icon next to a parameter name indicates the type of value sent in that parameter. You can hover over the icon to view the type, for example, *ABC*, which represents a *String*.
* **Is Required** — Highlights whether the parameter is required or not. Traceable marks a parameter as required if it appears in 99% of API calls. Required parameters are highlighted with an asterisk (\*) as shown above.
* **Location** — The location within the request or response of the API where Traceable observed the parameter, for example, body, header, etc.
* **Datatypes** — The Traceable datatype(s) associated with the parameter, for example, *password* and *Email* as shown above. You can also hover over a datatype to view its basic details.\
You can add or edit datatypes for each parameter according to your requirements by clicking the **Ellipse** (:ellipsis:) icon corresponding to a row and selecting **Add Datatype** or **Manage Datatype**, respectively. Specify or modify the datatype details in the respective pop-up window according to your requirements. For detailed information on these fields, see [Data Classification](/web-application-and-api-protection-waap/settings/discovery/data-classification.md).
You can add or edit datatypes only at a parameter level and not at an object ()level. Therefore, you must expand objects to be able to add or edit datatypes. For example, in the above screenshot, the object level is represented by {} in the first row, and upon expanding, the parameter level is represented by the child rows password and email.
A datatype can belong to one or more datasets. Make sure that the dataset to which you want to add the datatype is available in the Dataset drop-down list. If it is not listed, then create a dataset from Settings (:gear:) → Discovery → Data Classification → Datasets tab. For more information, see Data Classification.
* **Datasets** — The Traceable dataset(s) associated with the parameter, for example, *Generic Auth* and *HIPAA* as shown above. You can also hover over a dataset to view the corresponding datatypes under it.
* **Is Learnt** — Highlights whether the parameter is learned or not. While Traceable shows learned parameters by default, you can remove the **Is Learnt** filter at the top of the tab to view both learned and under-learning parameters. The learned and under-learning parameters are highlighted using the  and icons respectively.
* **Identified In** — The API component (request or response) where Traceable observed the parameter.
{% hint style="info" %}
As Traceable keeps monitoring both learned and under-learning APIs continuously, the parameters visible in the tab may change with time.
{% endhint %}
You can also do the following in the tab:
* Search for a specific parameter using the **Search** bar.
* Filter data to view parameters based on certain conditions by clicking the **Filter** (:filter:) icon.
{% endtab %}
{% tab title="Open Issues" %}
The **Open Issues** tab displays the security issues detected for the selected API endpoint. You can use this information to identify and investigate security gaps associated with the endpoint. For more information, see [Issues](/web-application-and-api-protection-waap/discovery/risk/issues-overview.md) and [Issue Management](/web-application-and-api-protection-waap/discovery/risk/issue-management.md).
Open Issues tab
You can use the search bar to find specific issues, filter the displayed data using the **Filter** (:filter:) icon, and group the data using the **Group by** drop-down. You can also download the data as a CSV file using the **Download** (:download:) icon.
{% endtab %}
{% tab title="Posture Events" %}
The **Posture Events** tab provides a history of events that affect the security posture of the selected API endpoint, such as newly discovered vulnerabilities, API changes, risk score changes, and sensitive data discovery. You can use these events to understand how the endpoint's security posture has changed over time. For more information, see [Posture Events](/web-application-and-api-protection-waap/discovery/risk/posture-events.md).
Posture Events tab
You can filter the displayed data using the **Filter** (:filter:) icon in the top-right corner and download it as a CSV file using the **Download** (:download:) icon.
{% endtab %}
{% tab title="Security Events" %}
The **Security Events** tab provides a correlated view of security-relevant activity associated with the selected API endpoint. You can use this information to investigate requests associated with threats and protection rules directly on the endpoint details page and to understand the security activity in the context of the API endpoint. For more information, see [Security Events](/web-application-and-api-protection-waap/protection/web-app-api-protection/security-events.md).
Security Events tab
You can use the search bar to find specific security events and download the data as a CSV file by clicking **Action** in the top-left corner and selecting **Download as CSV**.
{% endtab %}
{% tab title="Traces" %}
The **Traces** tab displays detailed information about the requests associated with the API endpoint.
Traces tab
The tab also displays **Exit Calls**, which help you identify the backend and third-party services that the API calls. This information can help you identify unauthorized third-party calls. You can also click on the **> icon** corresponding to a row to view more details about the trace.
You can also filter the data displayed on the page to meet your requirements. To do so, click the search bar at the top of the tab and select the parameter or parameters based on which you want to filter the data.
{% endtab %}
{% tab title="Metrics" %}
The **Metrics** tab displays detailed statistical information about the API endpoint's performance. By default, this information is shown for the past 5 minutes; however, you can change it to view data for up to 6 hours.
Metrics tab
The following information is displayed for an API:
* Performance information, such as **P50**, **P95**, and **P99** latency numbers. These metrics help identify the API performance for different user groups. If you encounter unexpected latency numbers, consider checking the APIs for resource consumption, performance bottlenecks, and network issues.
* The error rate and error percentage during the selected time period. The error rate is the number of failed requests per second, while the error percentage is the number of failed requests relative to the total number of requests, expressed as a percentage. These values help detect issues and monitor the API’s reliability. If you encounter unexpected numbers, consider checking the APIs for network issues, security problems, and configuration errors.
* The number of calls per minute to the API during the selected period. If you notice an unusually high number of calls to an API, it may indicate API abuse or a DDoS attack.
* The data transfer rate during the selected period can also provide insights into the API’s usage. If you encounter an unexpected data transfer rate for an API that should have a low rate, it may indicate a potential breach in API security.
* The top status codes that you can monitor to infer the health of the API. You may want to check the API for issues if you see many error status codes.
{% endtab %}
{% endtabs %}
{% @harness-feedback/feedback %}
***
## **Leverage the endpoint details page**
When an API's risk, performance, and activity data live in separate tools and dashboards, investigating an endpoint means jumping between them and manually stitching the story back together. That gap makes it easy to miss the connection between a performance anomaly and a security issue on the same endpoint.
The endpoint details page closes that gap by keeping each tab scoped to a single endpoint. **For example,** if a risk score suddenly spikes, you can review the **Overview** tab to understand the factors contributing to the score, check **Parameters** or **User Roles** for additional context, and review **Security Events** to investigate related security activity. Because everything stays on the same endpoint as you move between tabs, you spend less time re-establishing context and more time deciding what to fix.

 If you wish to download the OpenAPI or WSDL specifications for a domain, service, label, or environment, you can use the APIs provided by Traceable. For more information, see [Downloading API Documentation](/web-application-and-api-protection-waap/discovery/discovery-1/downloading-api-documentation.md).
 ) icon corresponding to the **Authorized Roles**/**Scopes** field, and in the pop-up window, perform either of the following actions:

 icon.
icon. ) icon corresponding to the role/scope you wish to update.
2. Click **Mark as User-defined**.
* **Delete Roles/Scopes**
1. Click the **Ellipse** (
) icon corresponding to the role/scope you wish to update.
2. Click **Mark as User-defined**.
* **Delete Roles/Scopes**
1. Click the **Ellipse** ( ) icon corresponding to the role/scope you wish to delete.
2. Click **Delete**.
{% endtab %}
{% tab title="Parameters" %}
The **Parameters** tab provides an overview and details of the various parameters used in an API as well as their location and sensitivity. The Parameters tab also includes information about the datatypes and datasets associated with a parameter. This is useful for gaining in-depth insights into your API activity and understanding the criticality of parameters.
{% hint style="info" %}
Parameters are not generated for third-party APIs.
{% endhint %}
) icon corresponding to the role/scope you wish to delete.
2. Click **Delete**.
{% endtab %}
{% tab title="Parameters" %}
The **Parameters** tab provides an overview and details of the various parameters used in an API as well as their location and sensitivity. The Parameters tab also includes information about the datatypes and datasets associated with a parameter. This is useful for gaining in-depth insights into your API activity and understanding the criticality of parameters.
{% hint style="info" %}
Parameters are not generated for third-party APIs.
{% endhint %}

 * **Is Required** — Highlights whether the parameter is required or not. Traceable marks a parameter as required if it appears in 99% of API calls. Required parameters are highlighted with an asterisk (\*) as shown above.
* **Location** — The location within the request or response of the API where Traceable observed the parameter, for example, body, header, etc.
* **Datatypes** — The Traceable datatype(s) associated with the parameter, for example, *password* and *Email* as shown above. You can also hover over a datatype to view its basic details.\
You can add or edit datatypes for each parameter according to your requirements by clicking the **Ellipse** (:ellipsis:) icon corresponding to a row and selecting **Add Datatype** or **Manage Datatype**, respectively. Specify or modify the datatype details in the respective pop-up window according to your requirements. For detailed information on these fields, see [Data Classification](/web-application-and-api-protection-waap/settings/discovery/data-classification.md).
* **Is Required** — Highlights whether the parameter is required or not. Traceable marks a parameter as required if it appears in 99% of API calls. Required parameters are highlighted with an asterisk (\*) as shown above.
* **Location** — The location within the request or response of the API where Traceable observed the parameter, for example, body, header, etc.
* **Datatypes** — The Traceable datatype(s) associated with the parameter, for example, *password* and *Email* as shown above. You can also hover over a datatype to view its basic details.\
You can add or edit datatypes for each parameter according to your requirements by clicking the **Ellipse** (:ellipsis:) icon corresponding to a row and selecting **Add Datatype** or **Manage Datatype**, respectively. Specify or modify the datatype details in the respective pop-up window according to your requirements. For detailed information on these fields, see [Data Classification](/web-application-and-api-protection-waap/settings/discovery/data-classification.md).
 )level. Therefore, you must expand objects to be able to add or edit datatypes. For example, in the above screenshot, the object level is represented by {} in the first row, and upon expanding, the parameter level is represented by the child rows password and email.
 icons respectively.
* **Identified In** — The API component (request or response) where Traceable observed the parameter.
{% hint style="info" %}
As Traceable keeps monitoring both learned and under-learning APIs continuously, the parameters visible in the tab may change with time.
{% endhint %}
You can also do the following in the tab:
* Search for a specific parameter using the **Search** bar.
* Filter data to view parameters based on certain conditions by clicking the **Filter** (:filter:) icon.
{% endtab %}
{% tab title="Open Issues" %}
The **Open Issues** tab displays the security issues detected for the selected API endpoint. You can use this information to identify and investigate security gaps associated with the endpoint. For more information, see [Issues](/web-application-and-api-protection-waap/discovery/risk/issues-overview.md) and [Issue Management](/web-application-and-api-protection-waap/discovery/risk/issue-management.md).
icons respectively.
* **Identified In** — The API component (request or response) where Traceable observed the parameter.
{% hint style="info" %}
As Traceable keeps monitoring both learned and under-learning APIs continuously, the parameters visible in the tab may change with time.
{% endhint %}
You can also do the following in the tab:
* Search for a specific parameter using the **Search** bar.
* Filter data to view parameters based on certain conditions by clicking the **Filter** (:filter:) icon.
{% endtab %}
{% tab title="Open Issues" %}
The **Open Issues** tab displays the security issues detected for the selected API endpoint. You can use this information to identify and investigate security gaps associated with the endpoint. For more information, see [Issues](/web-application-and-api-protection-waap/discovery/risk/issues-overview.md) and [Issue Management](/web-application-and-api-protection-waap/discovery/risk/issue-management.md).


